- Welcome
- Data Overview
- How to Use These Data
- Why Are These Data Important?
- What Do These Data Show?
- What Do These Data Not Show?
- Implications for Public Health Practice
- Executive Summary
- Summary Table
- Longitudinal Trends
- Chlamydia trachomatis infection
- Gonorrhea
- Campylobacteriosis
- Salmonellosis (excluding Salmonella Typhi infection and Salmonella Paratyphi infection)
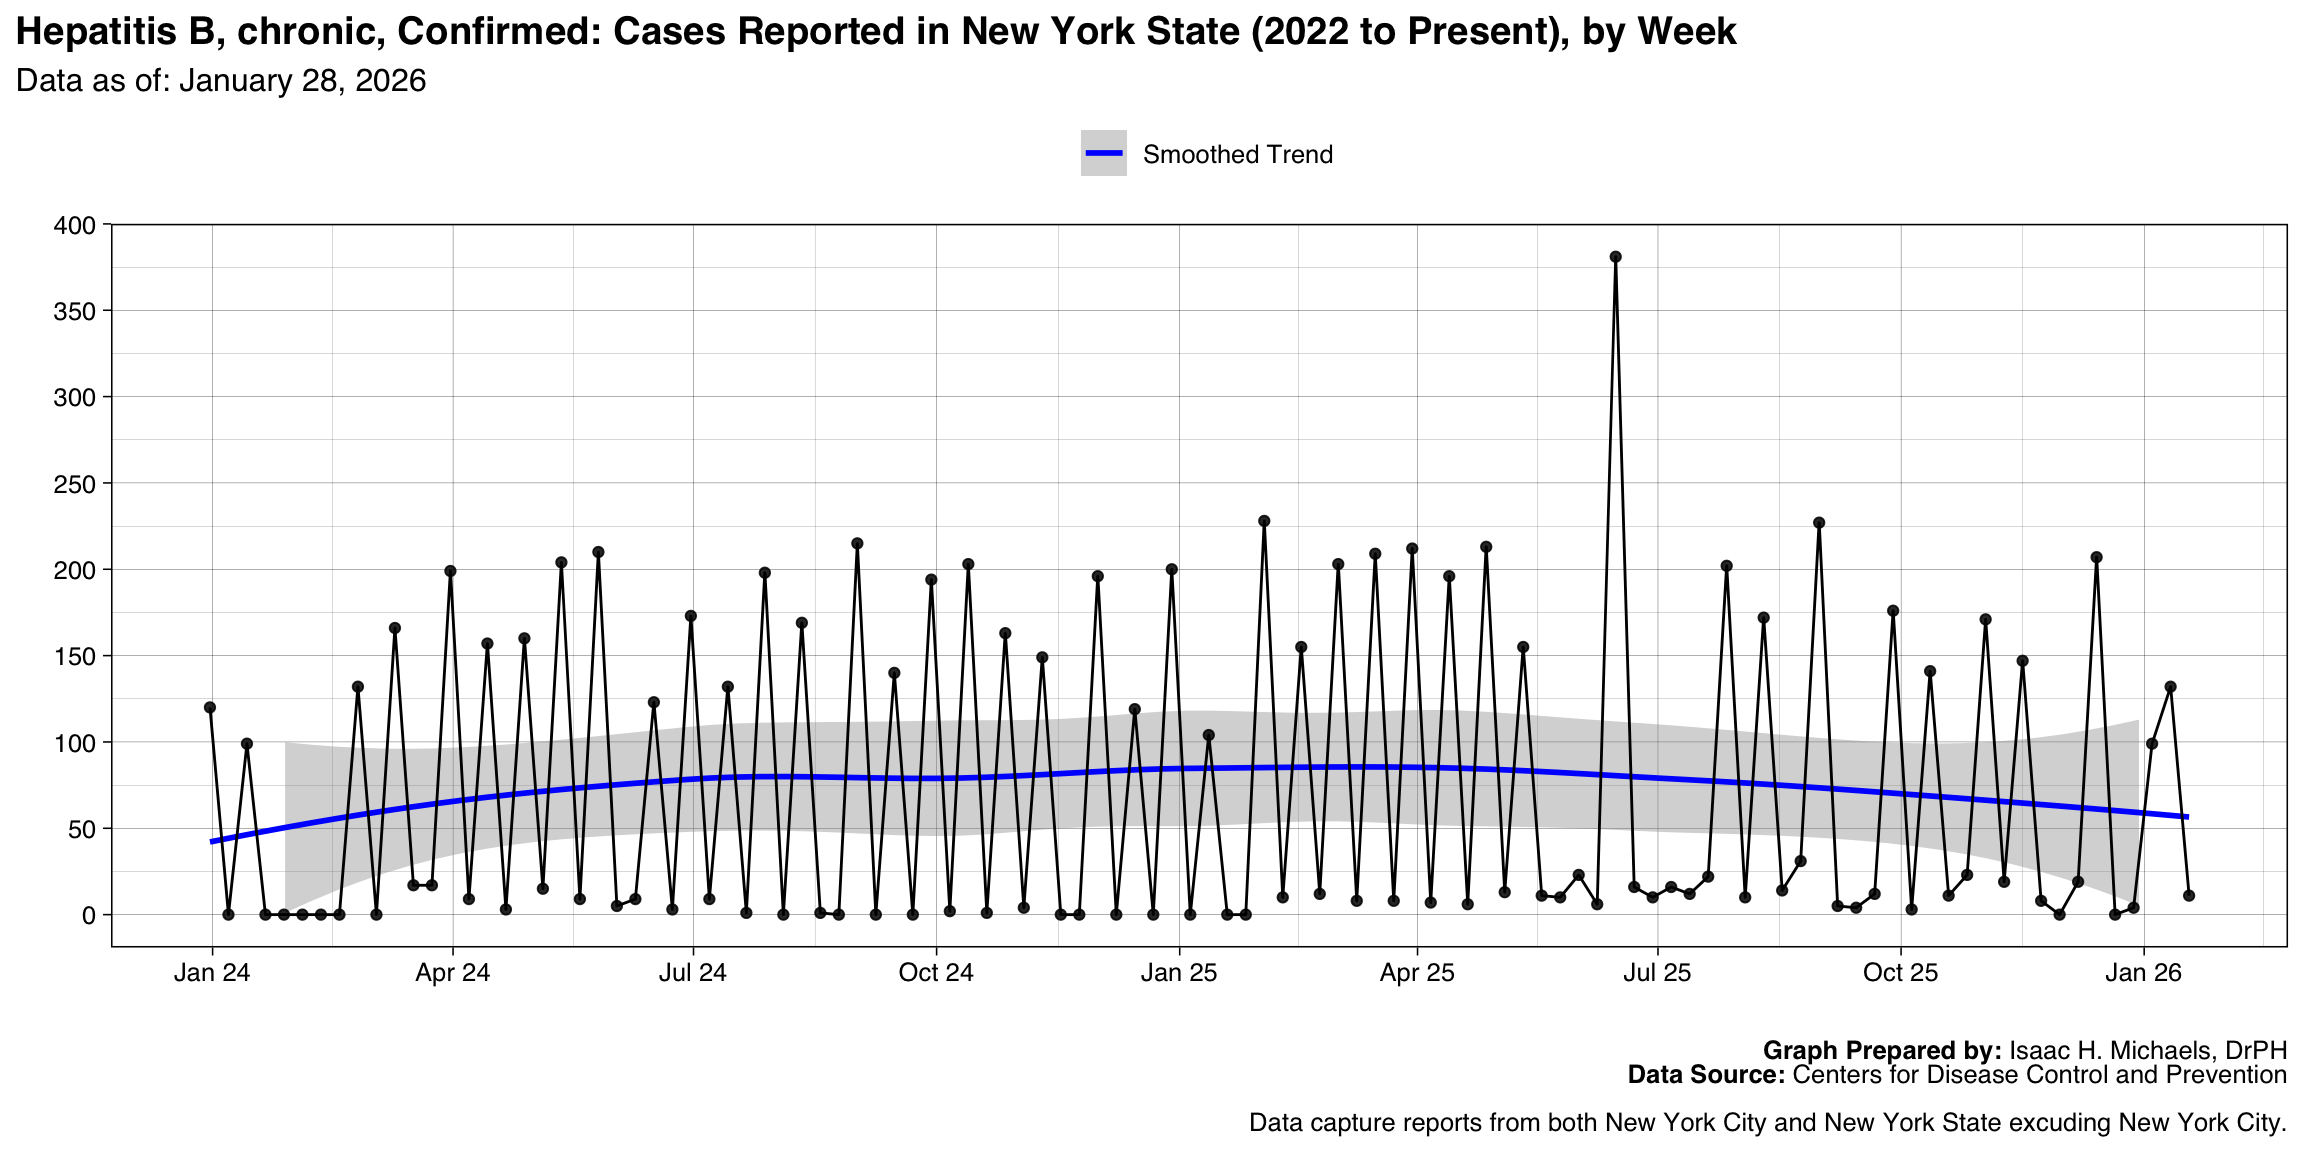
- Hepatitis B, chronic, Confirmed
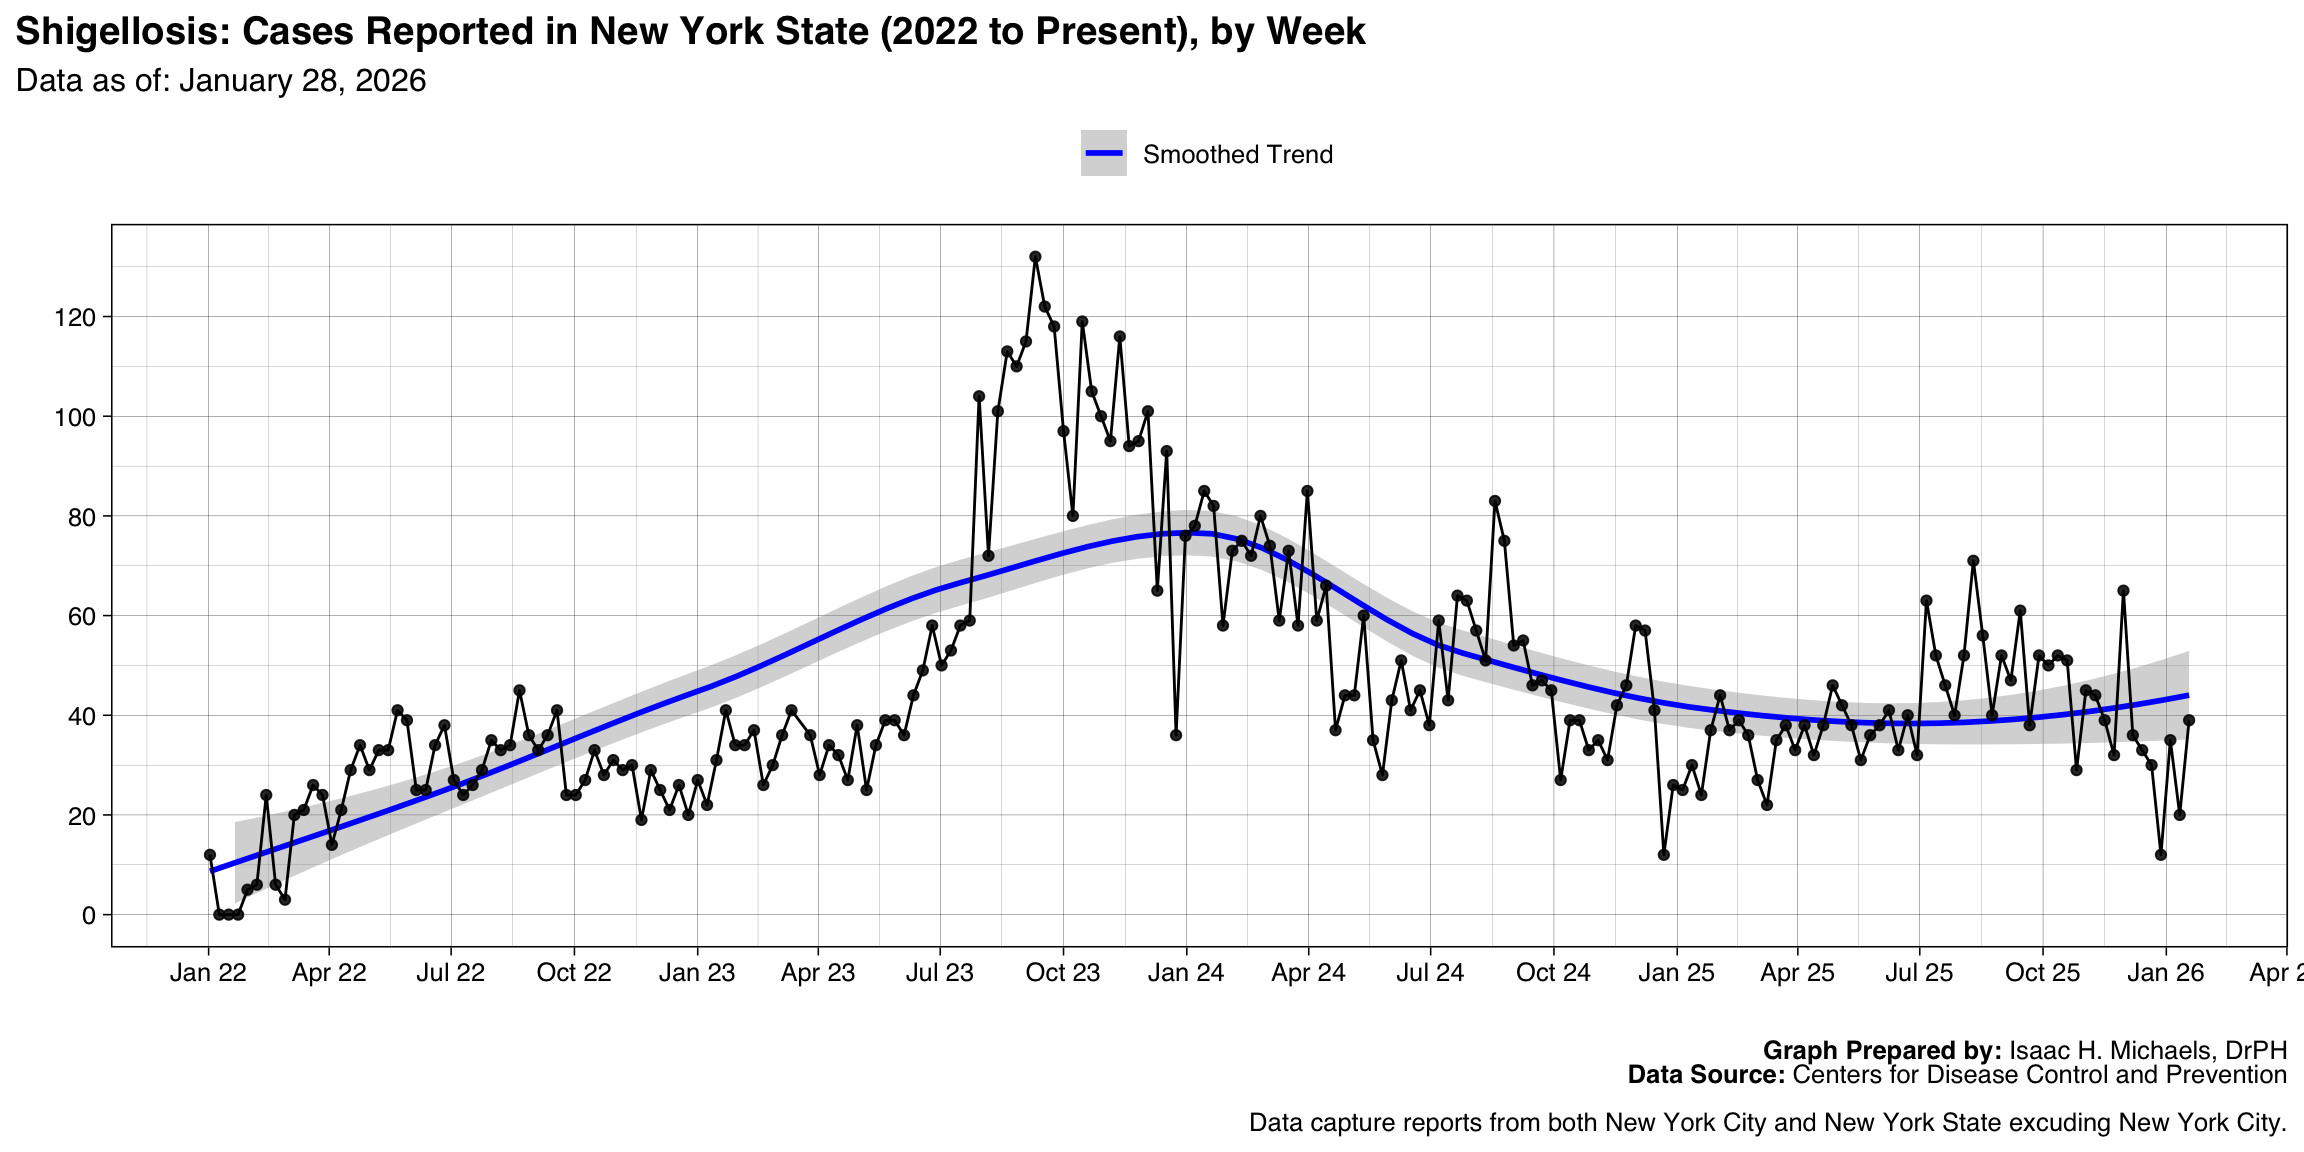
- Shigellosis
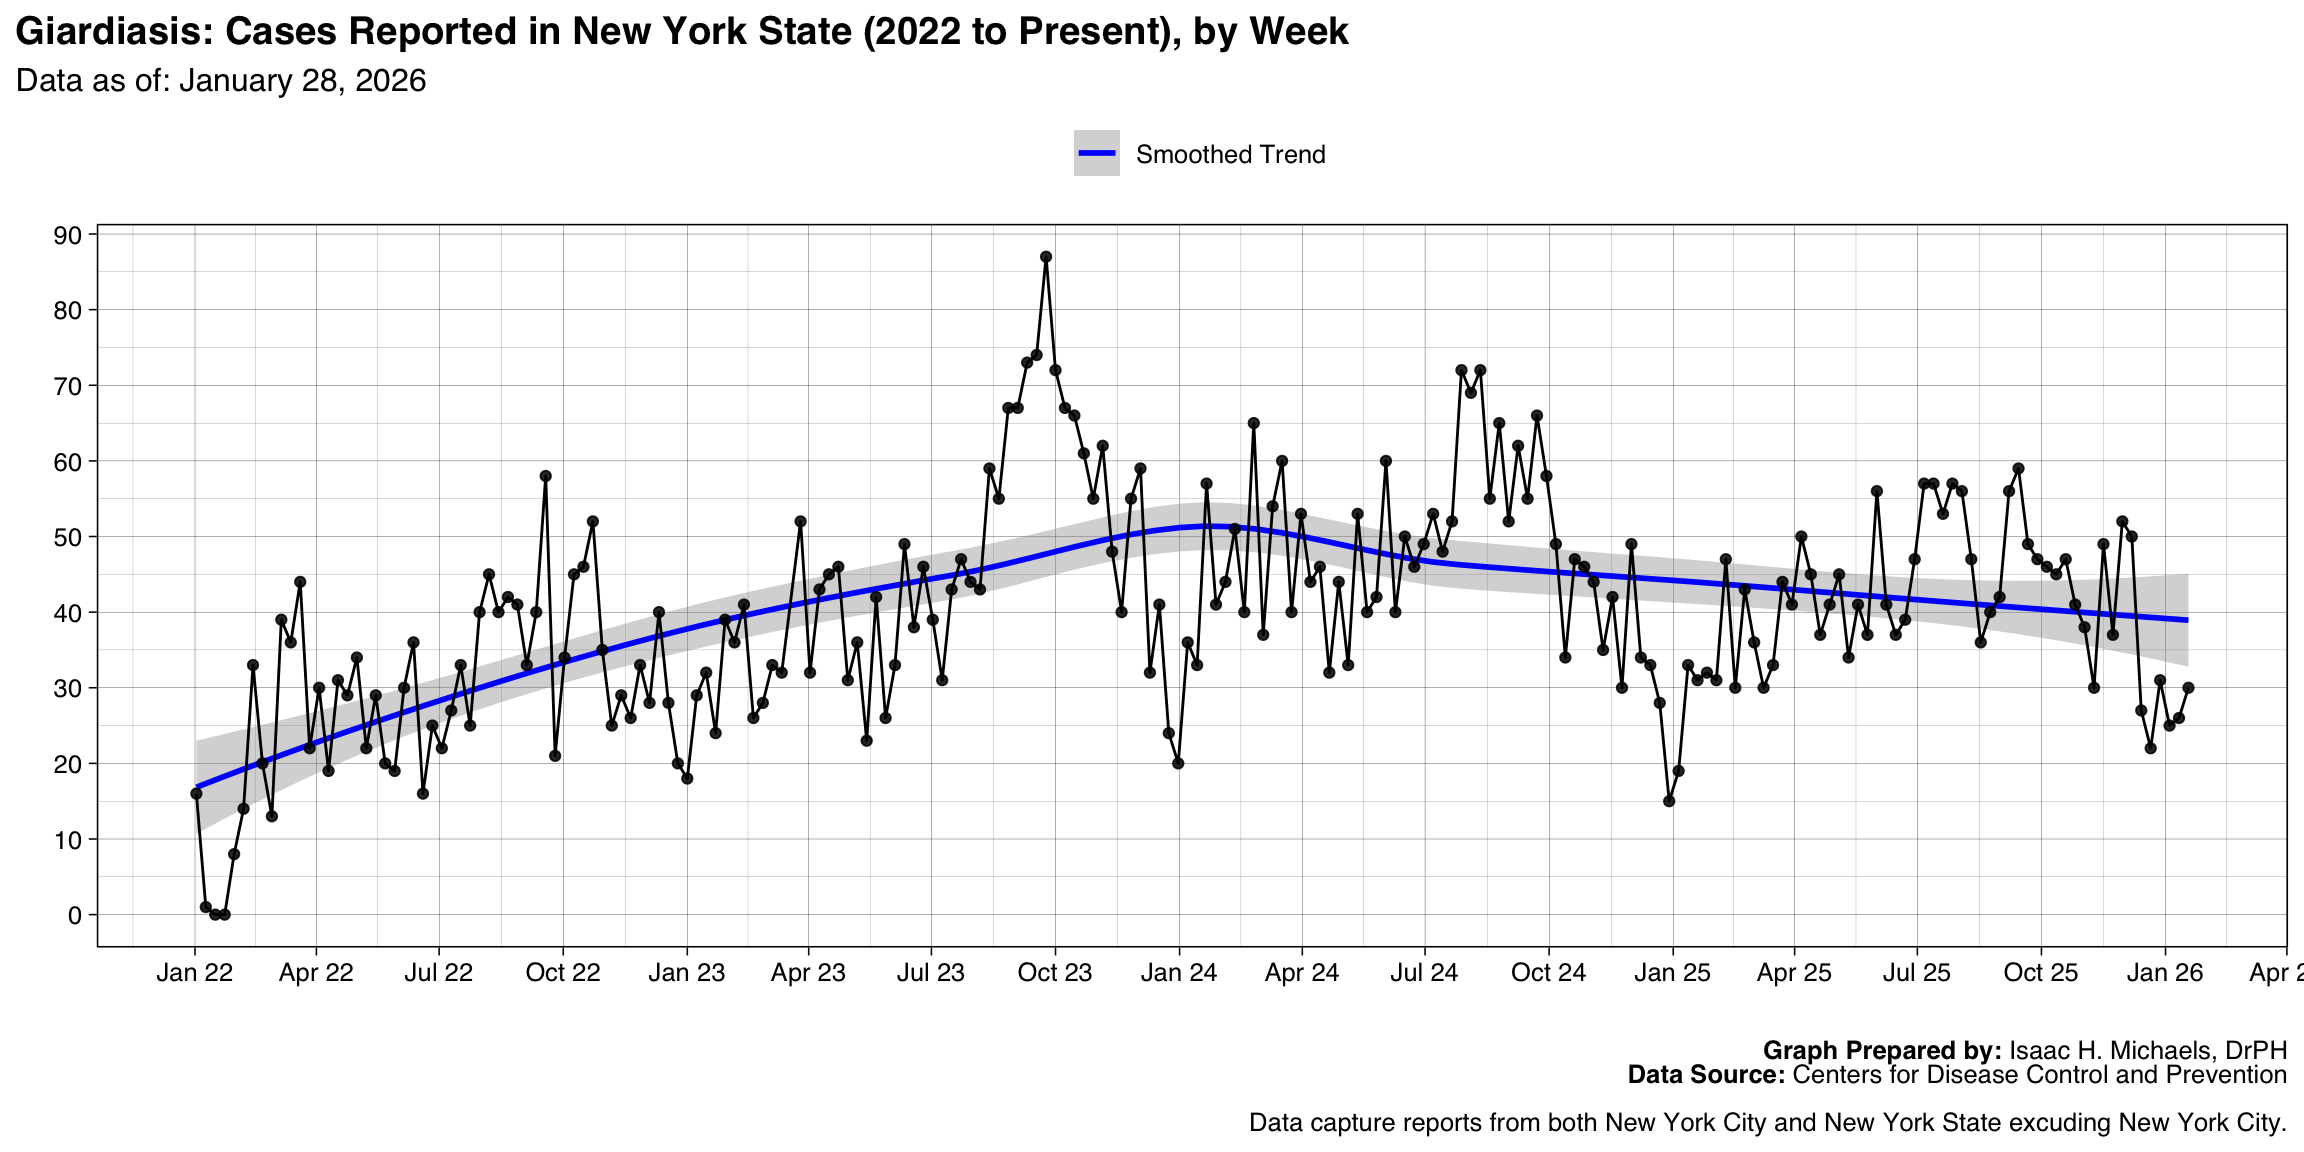
- Giardiasis
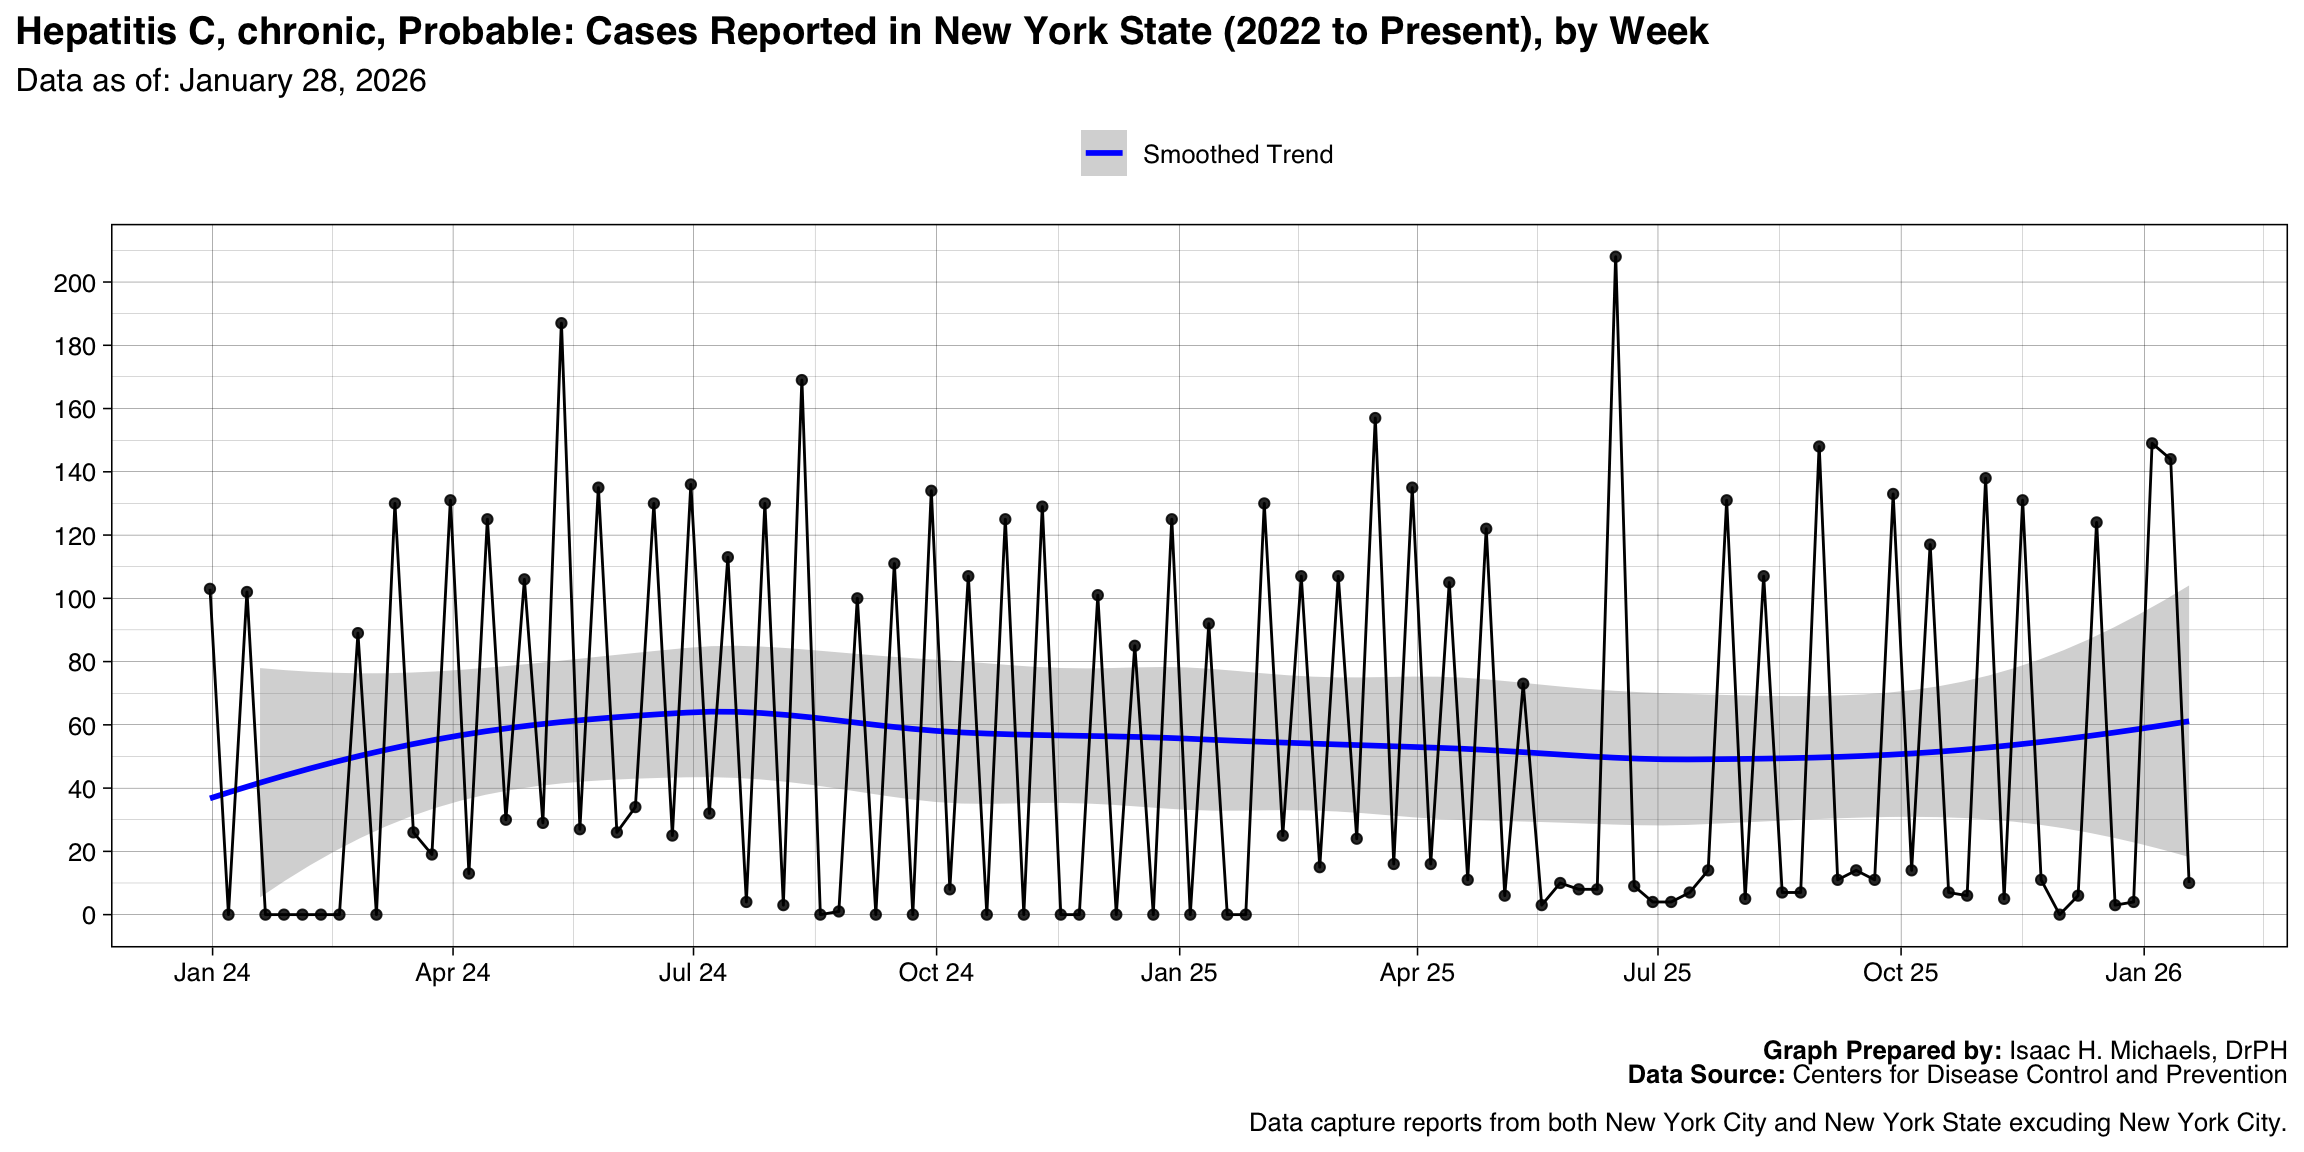
- Hepatitis C, chronic, Probable
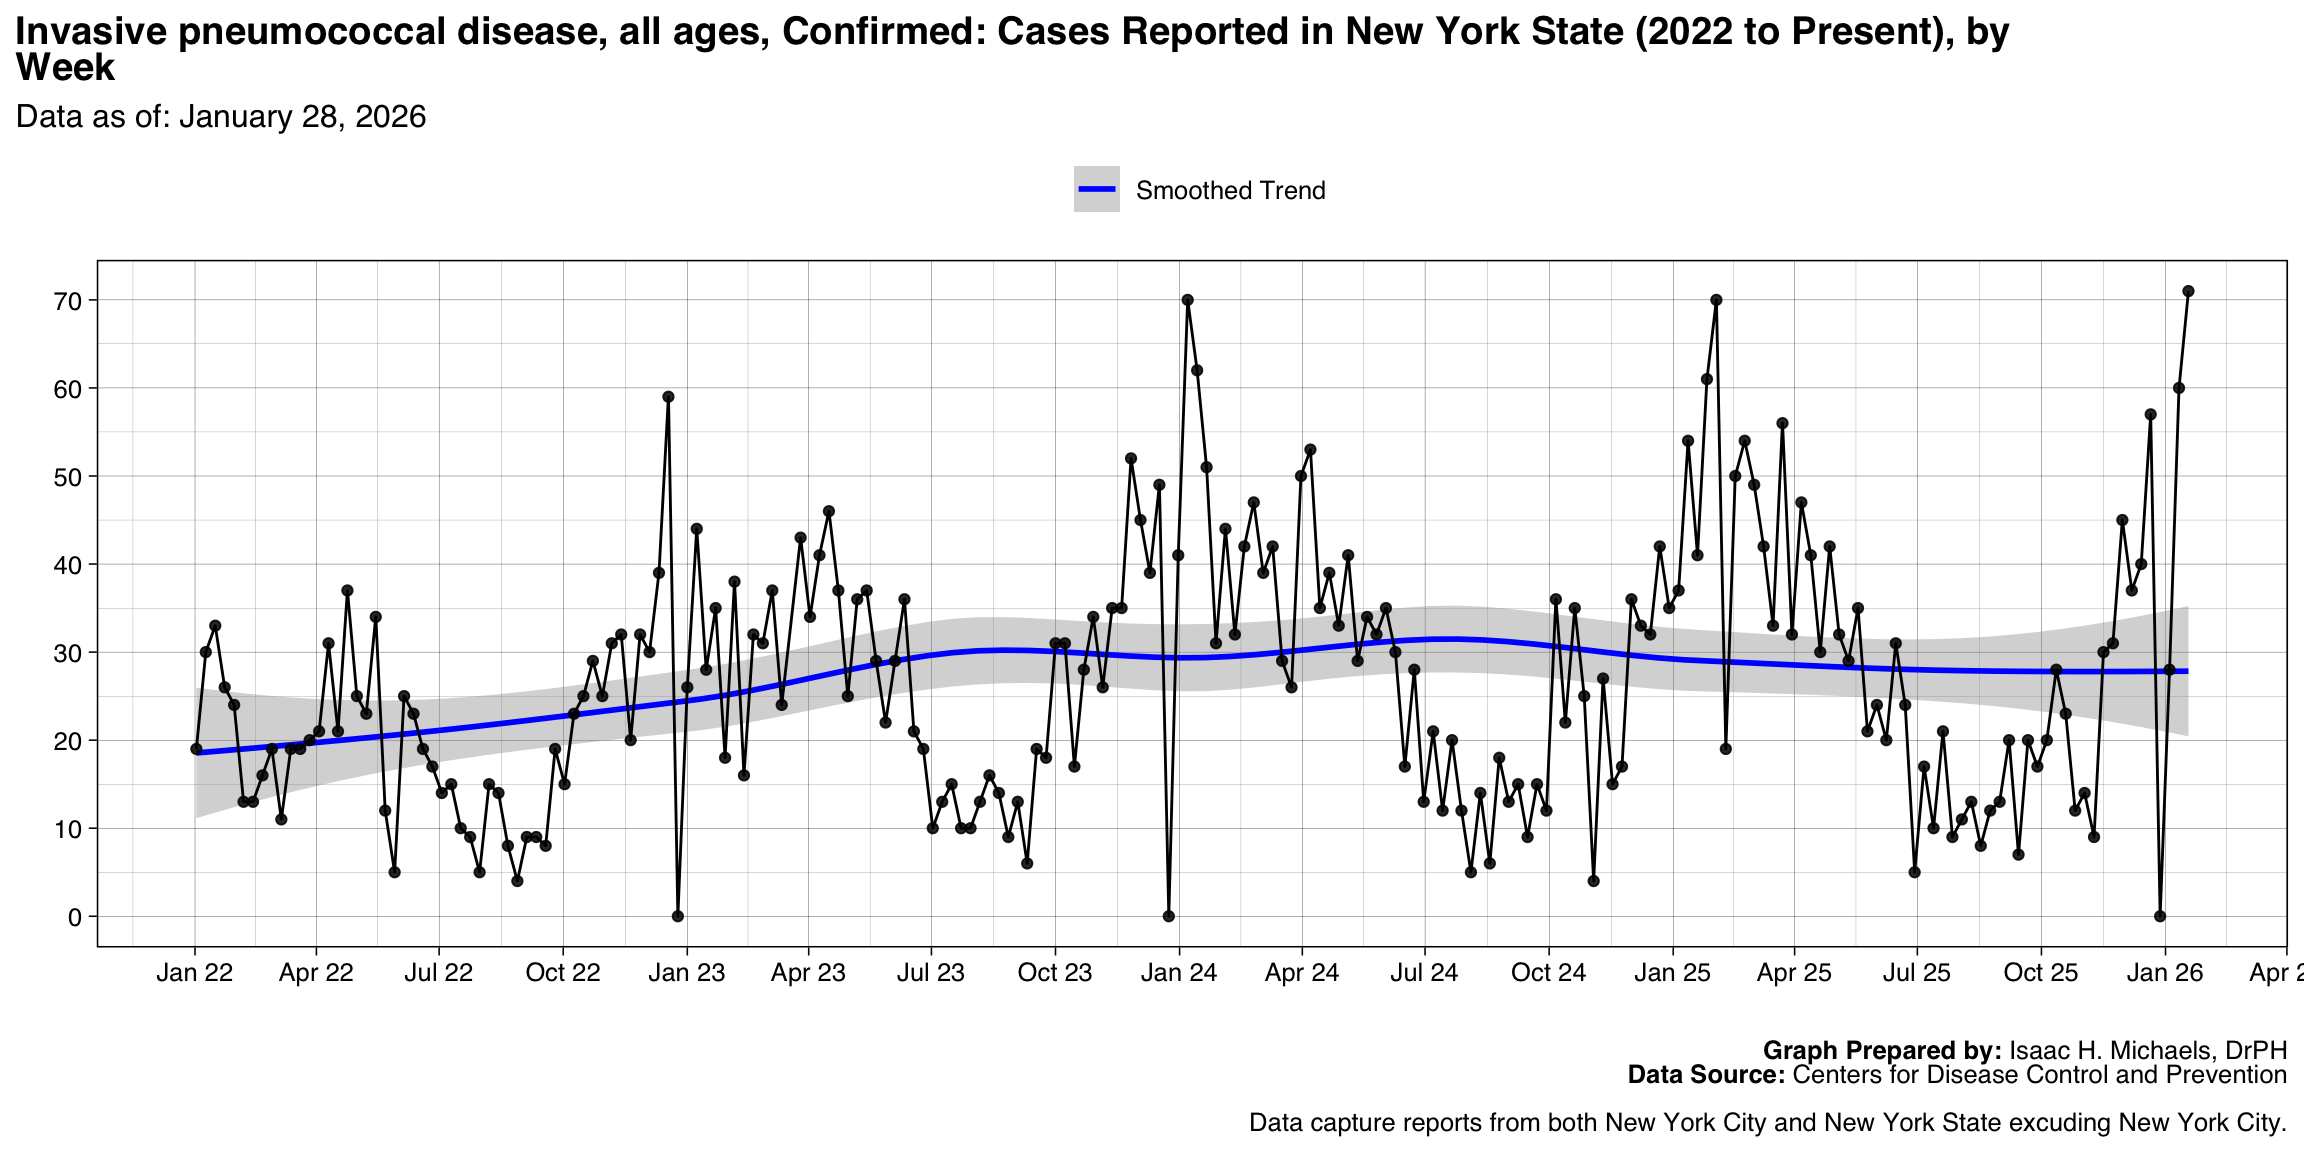
- Invasive pneumococcal disease, all ages, Confirmed
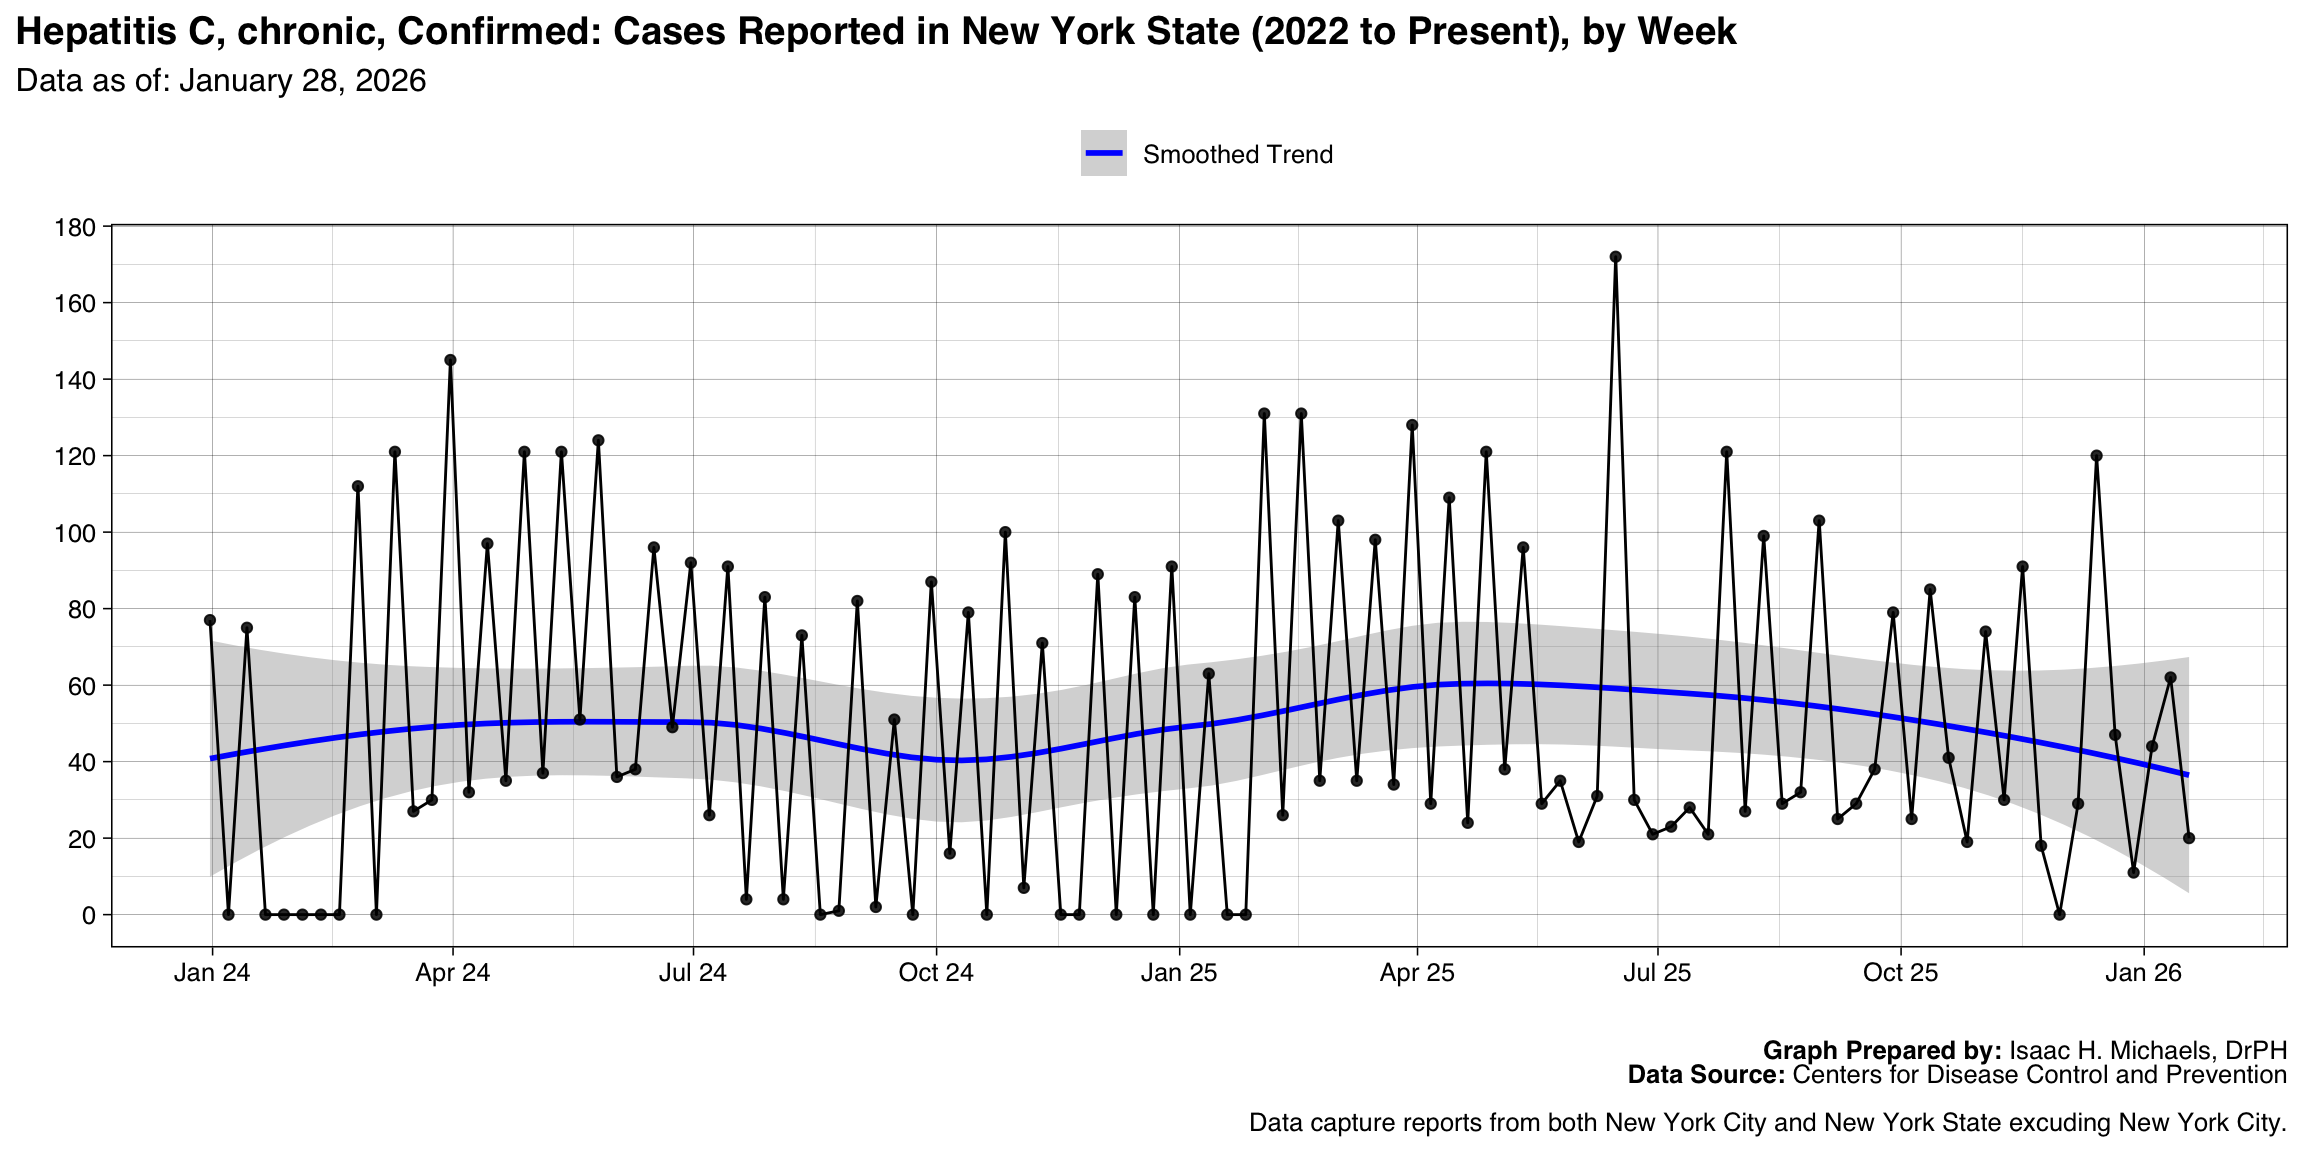
- Hepatitis C, chronic, Confirmed
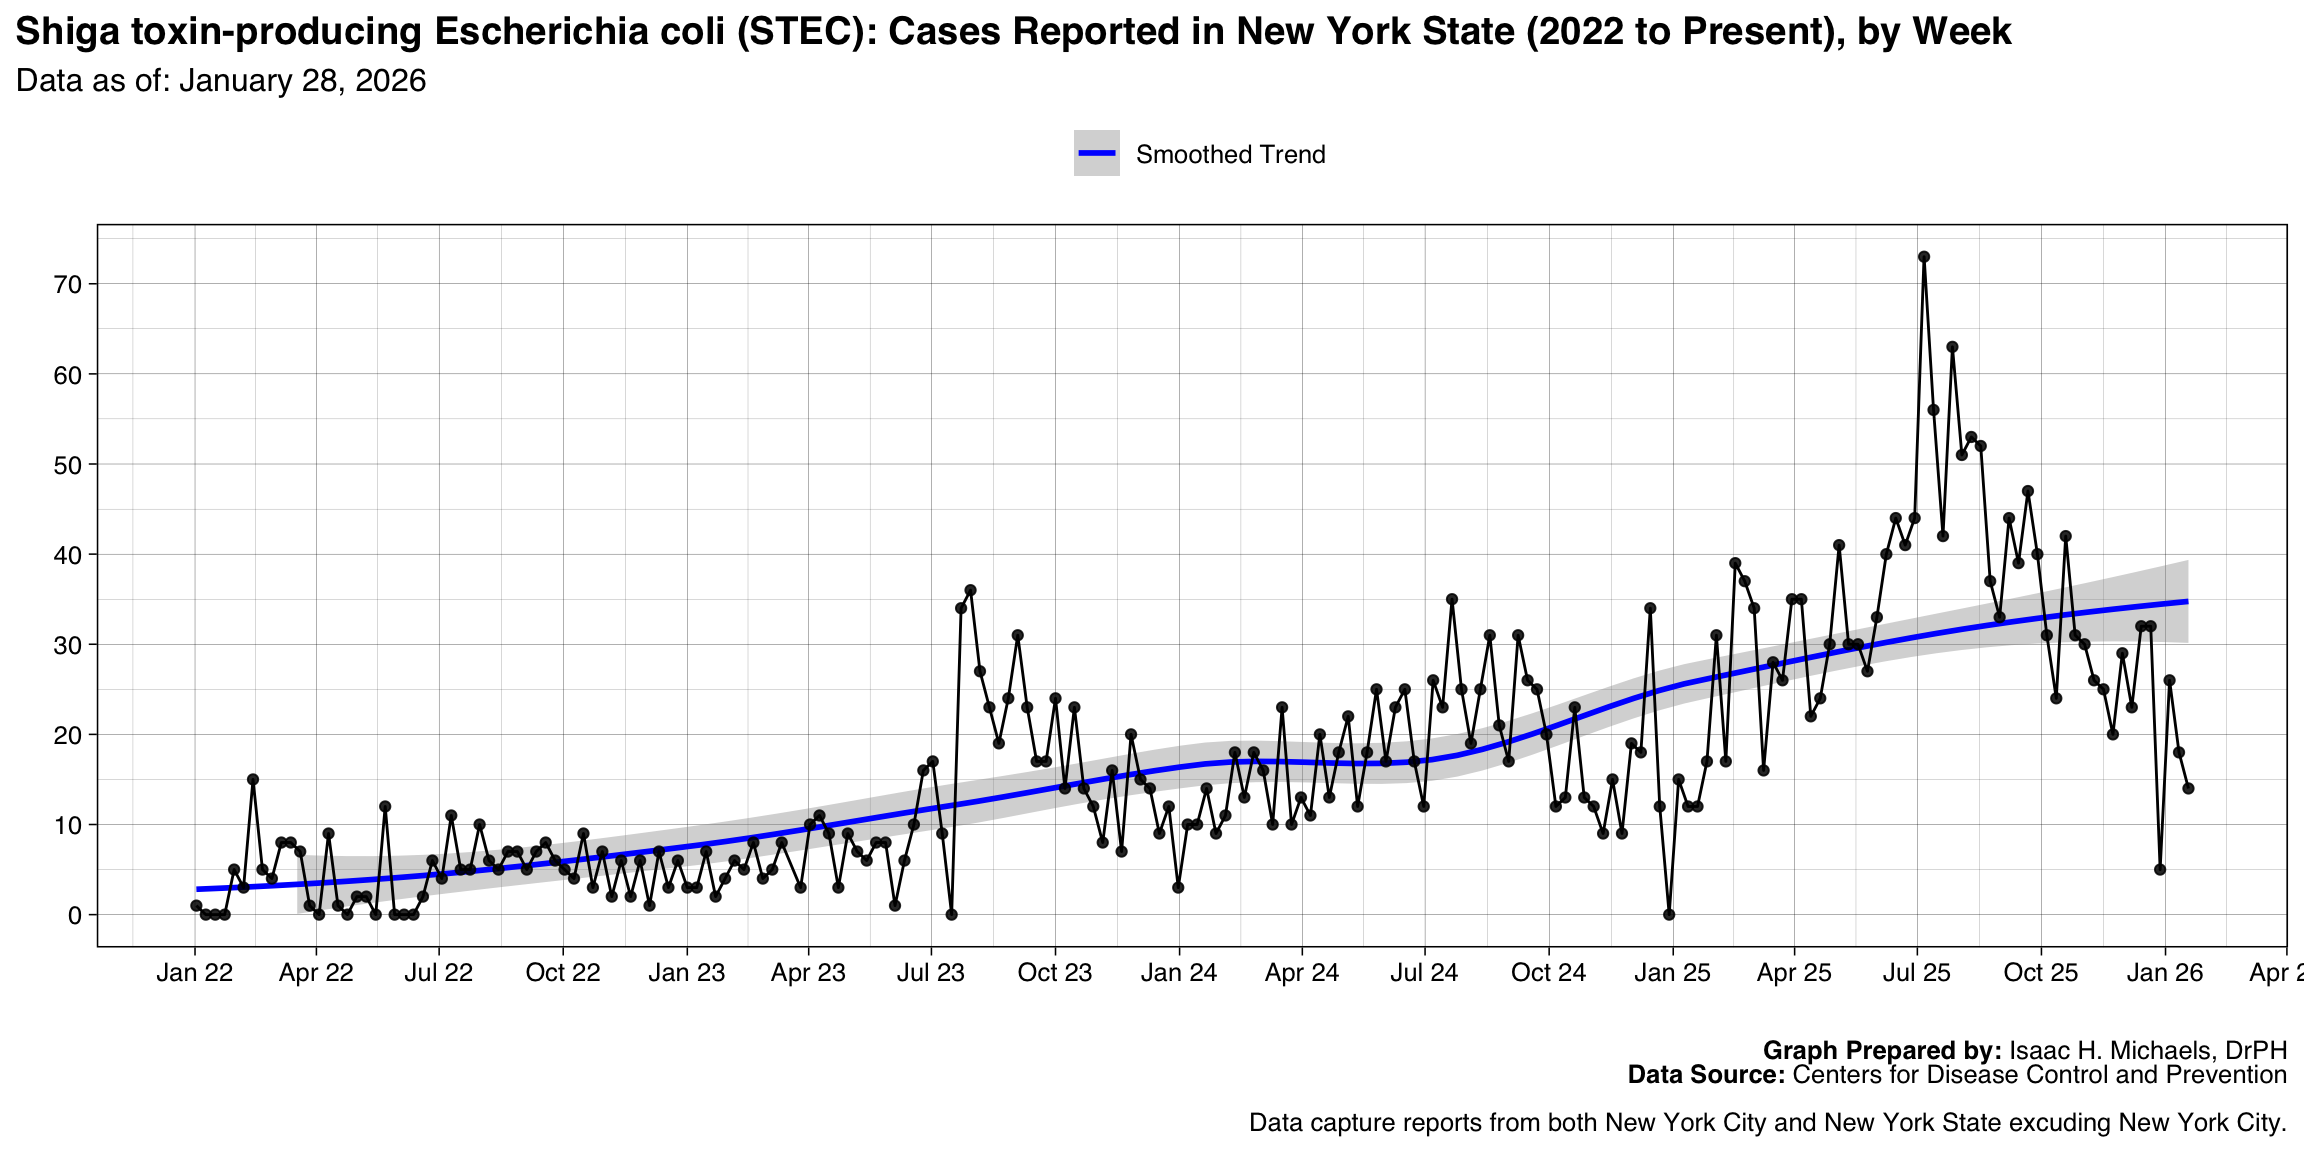
- Shiga toxin-producing Escherichia coli (STEC)
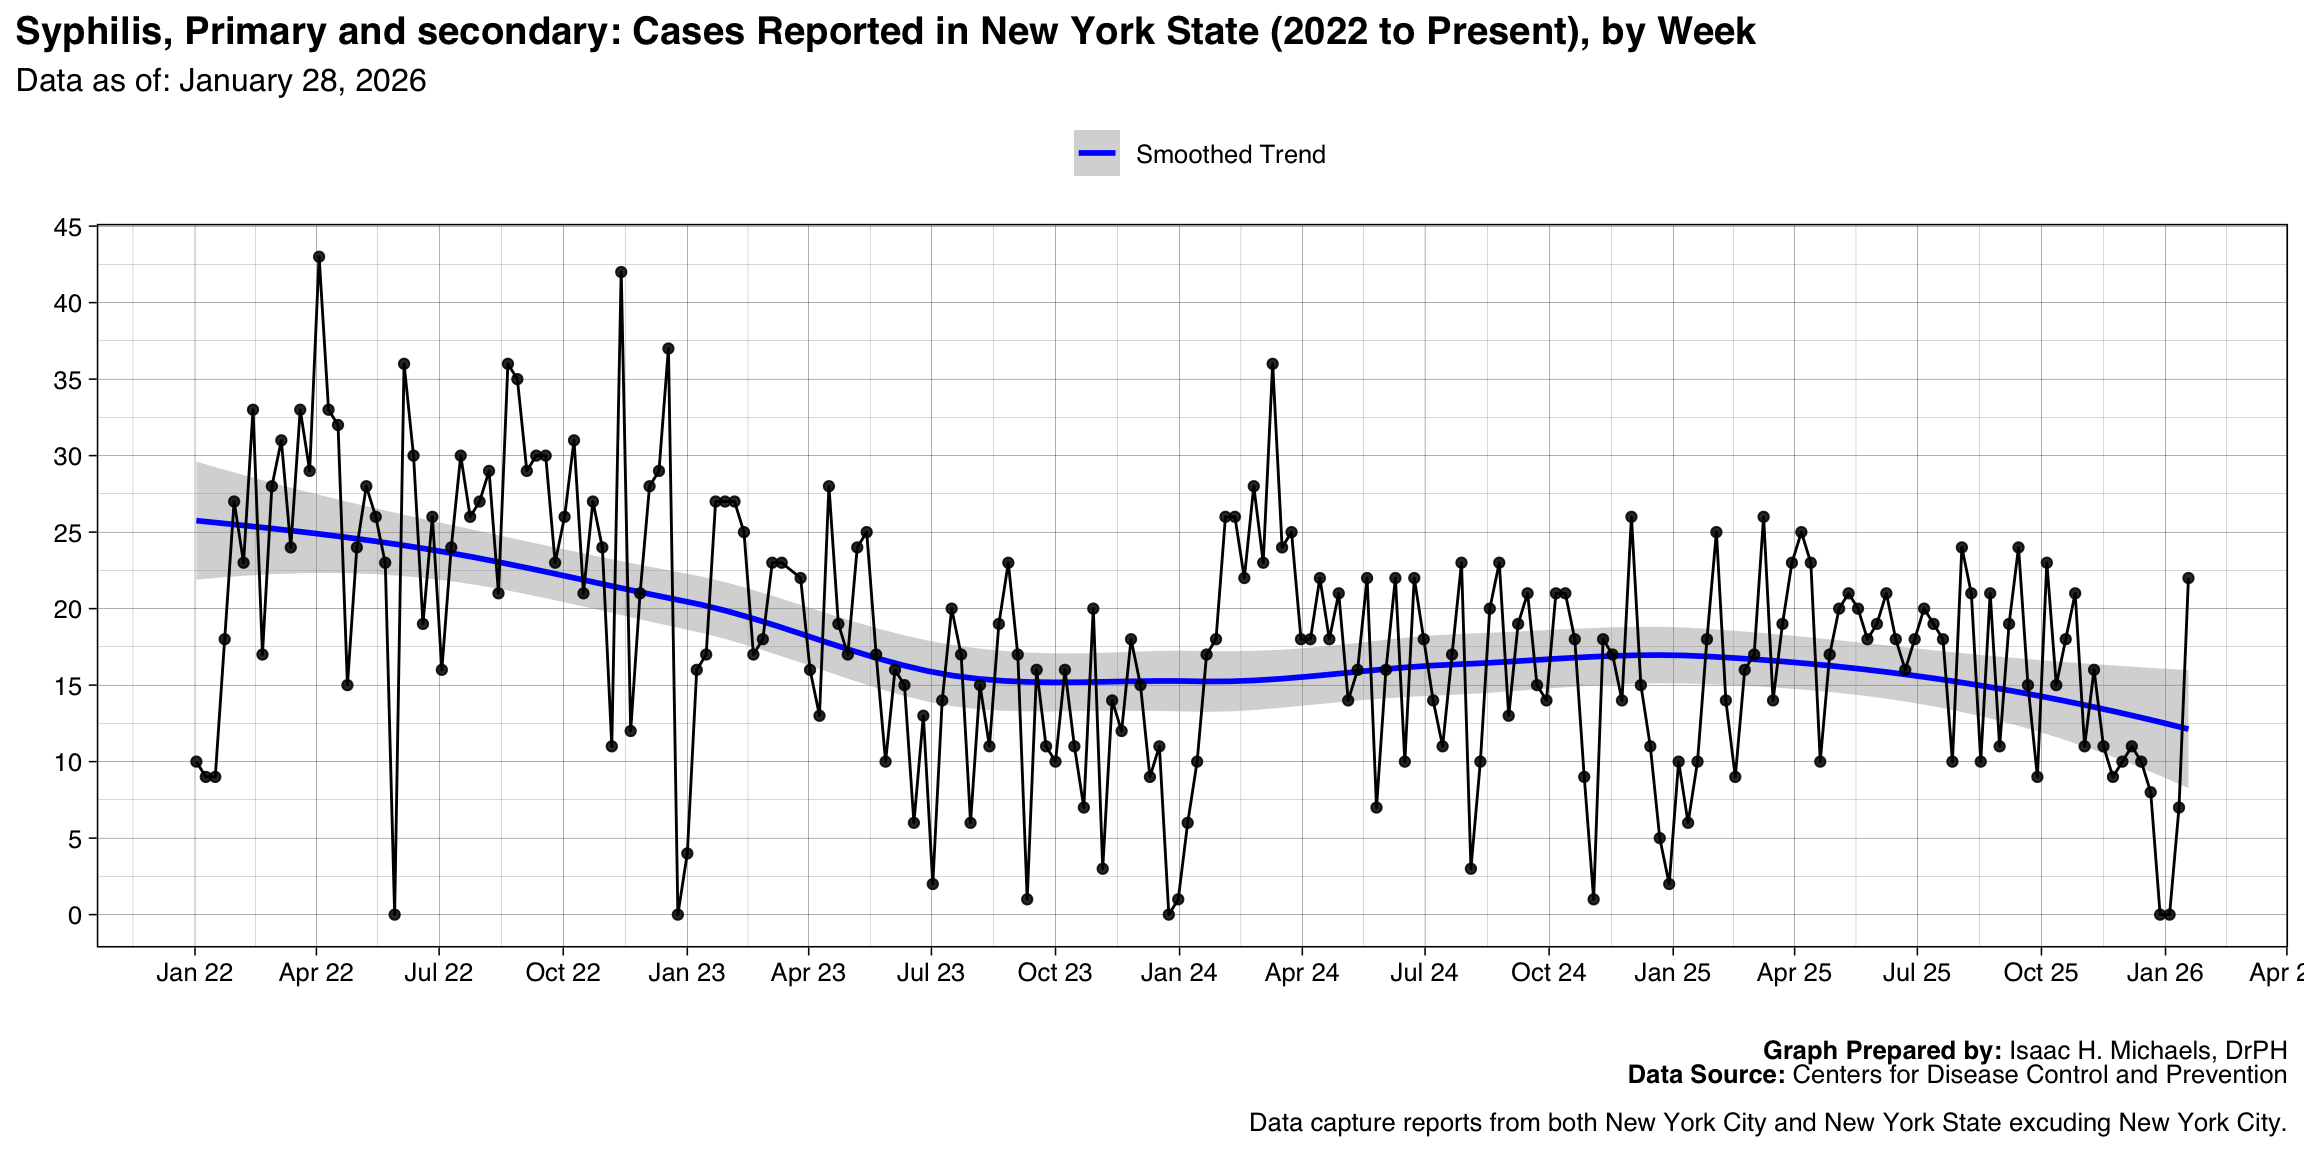
- Syphilis, Primary and secondary
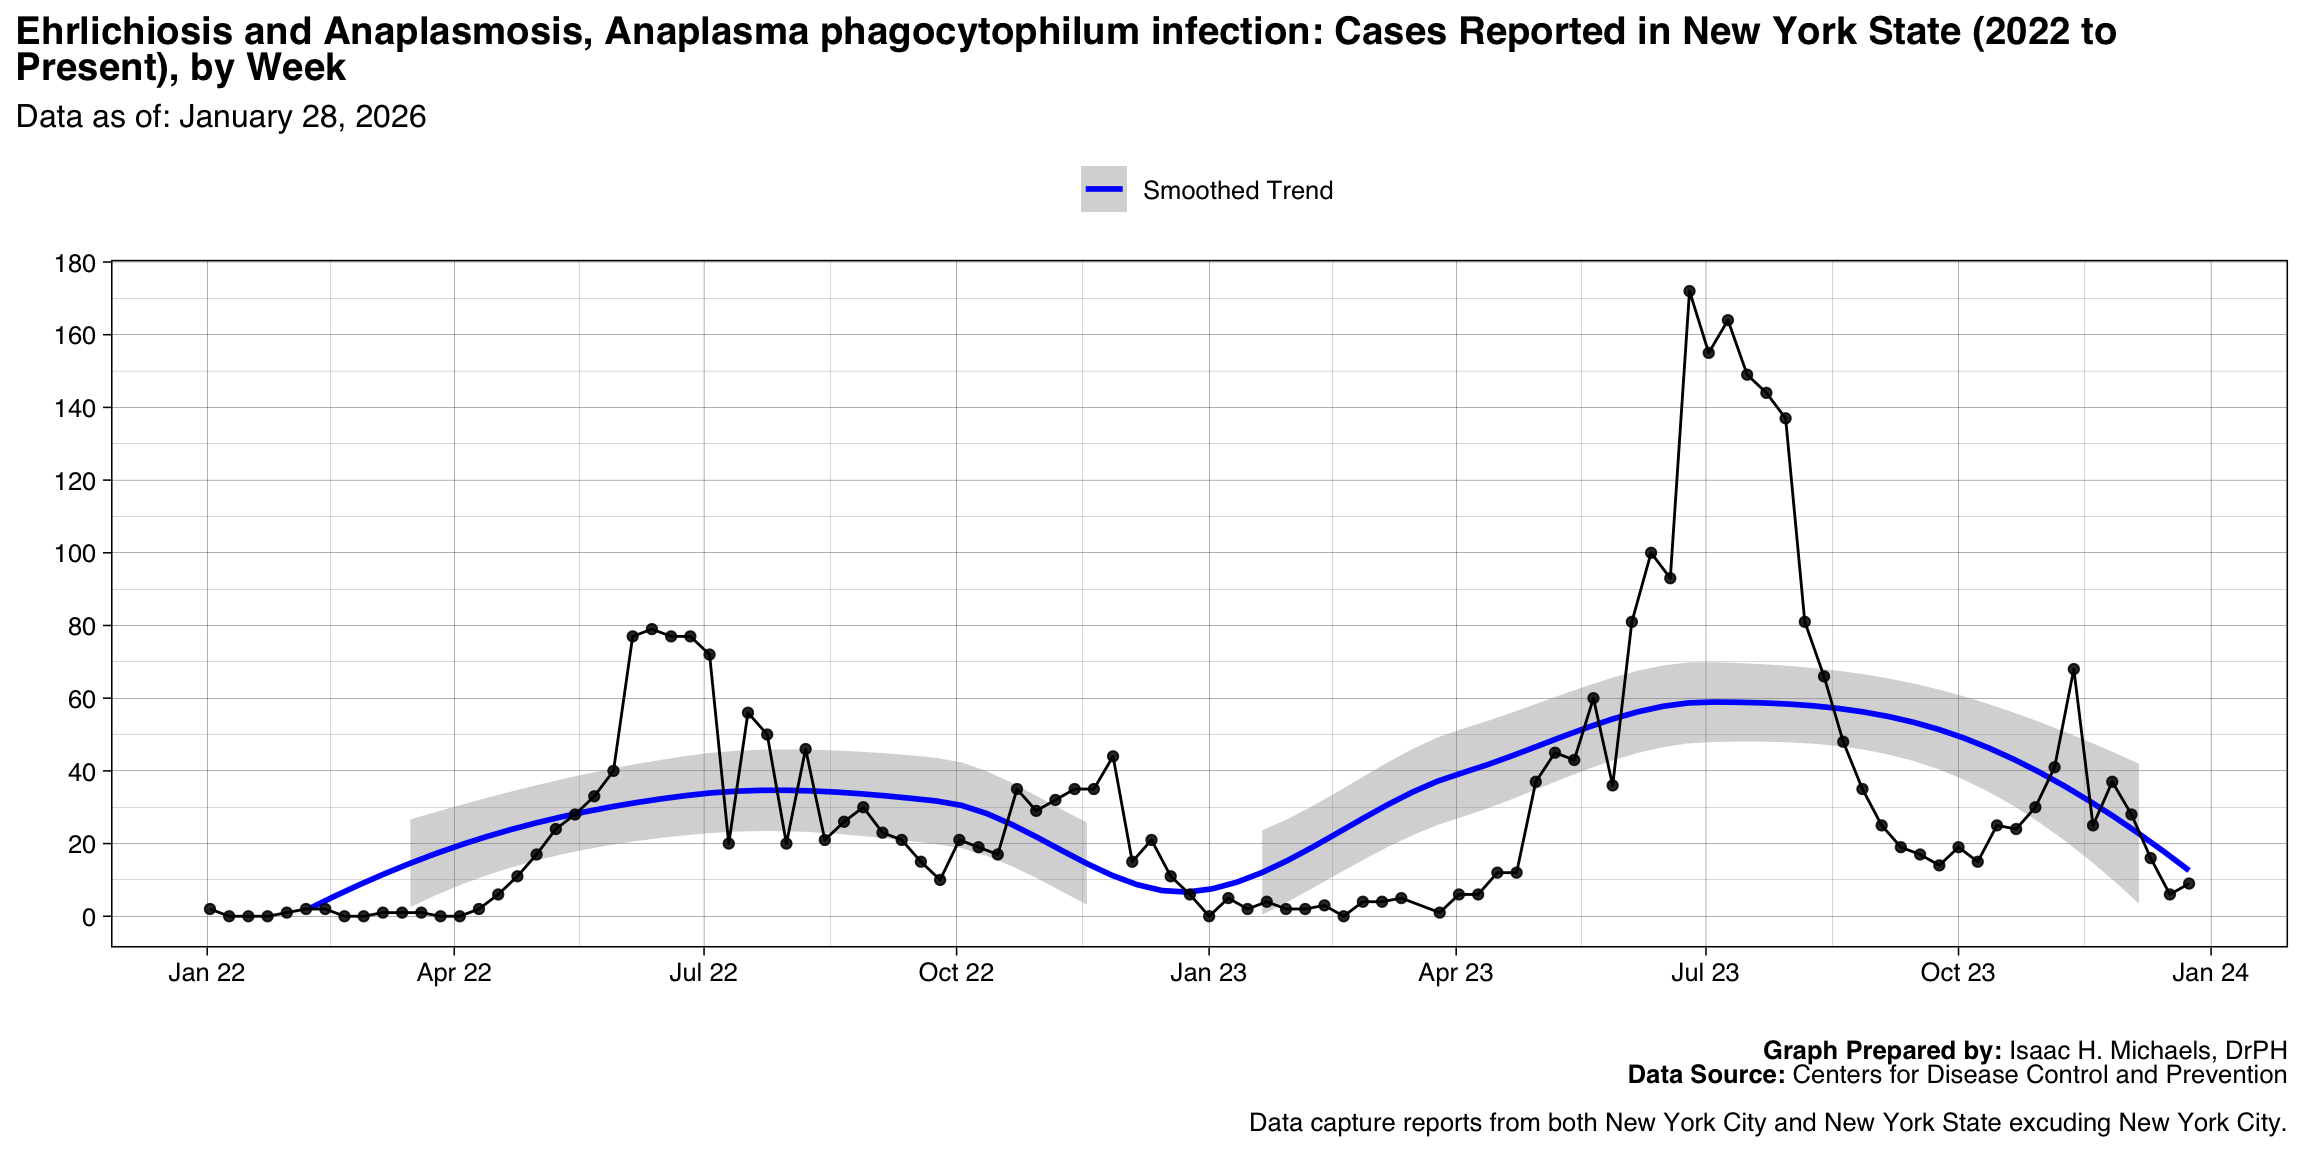
- Ehrlichiosis and Anaplasmosis, Anaplasma phagocytophilum infection
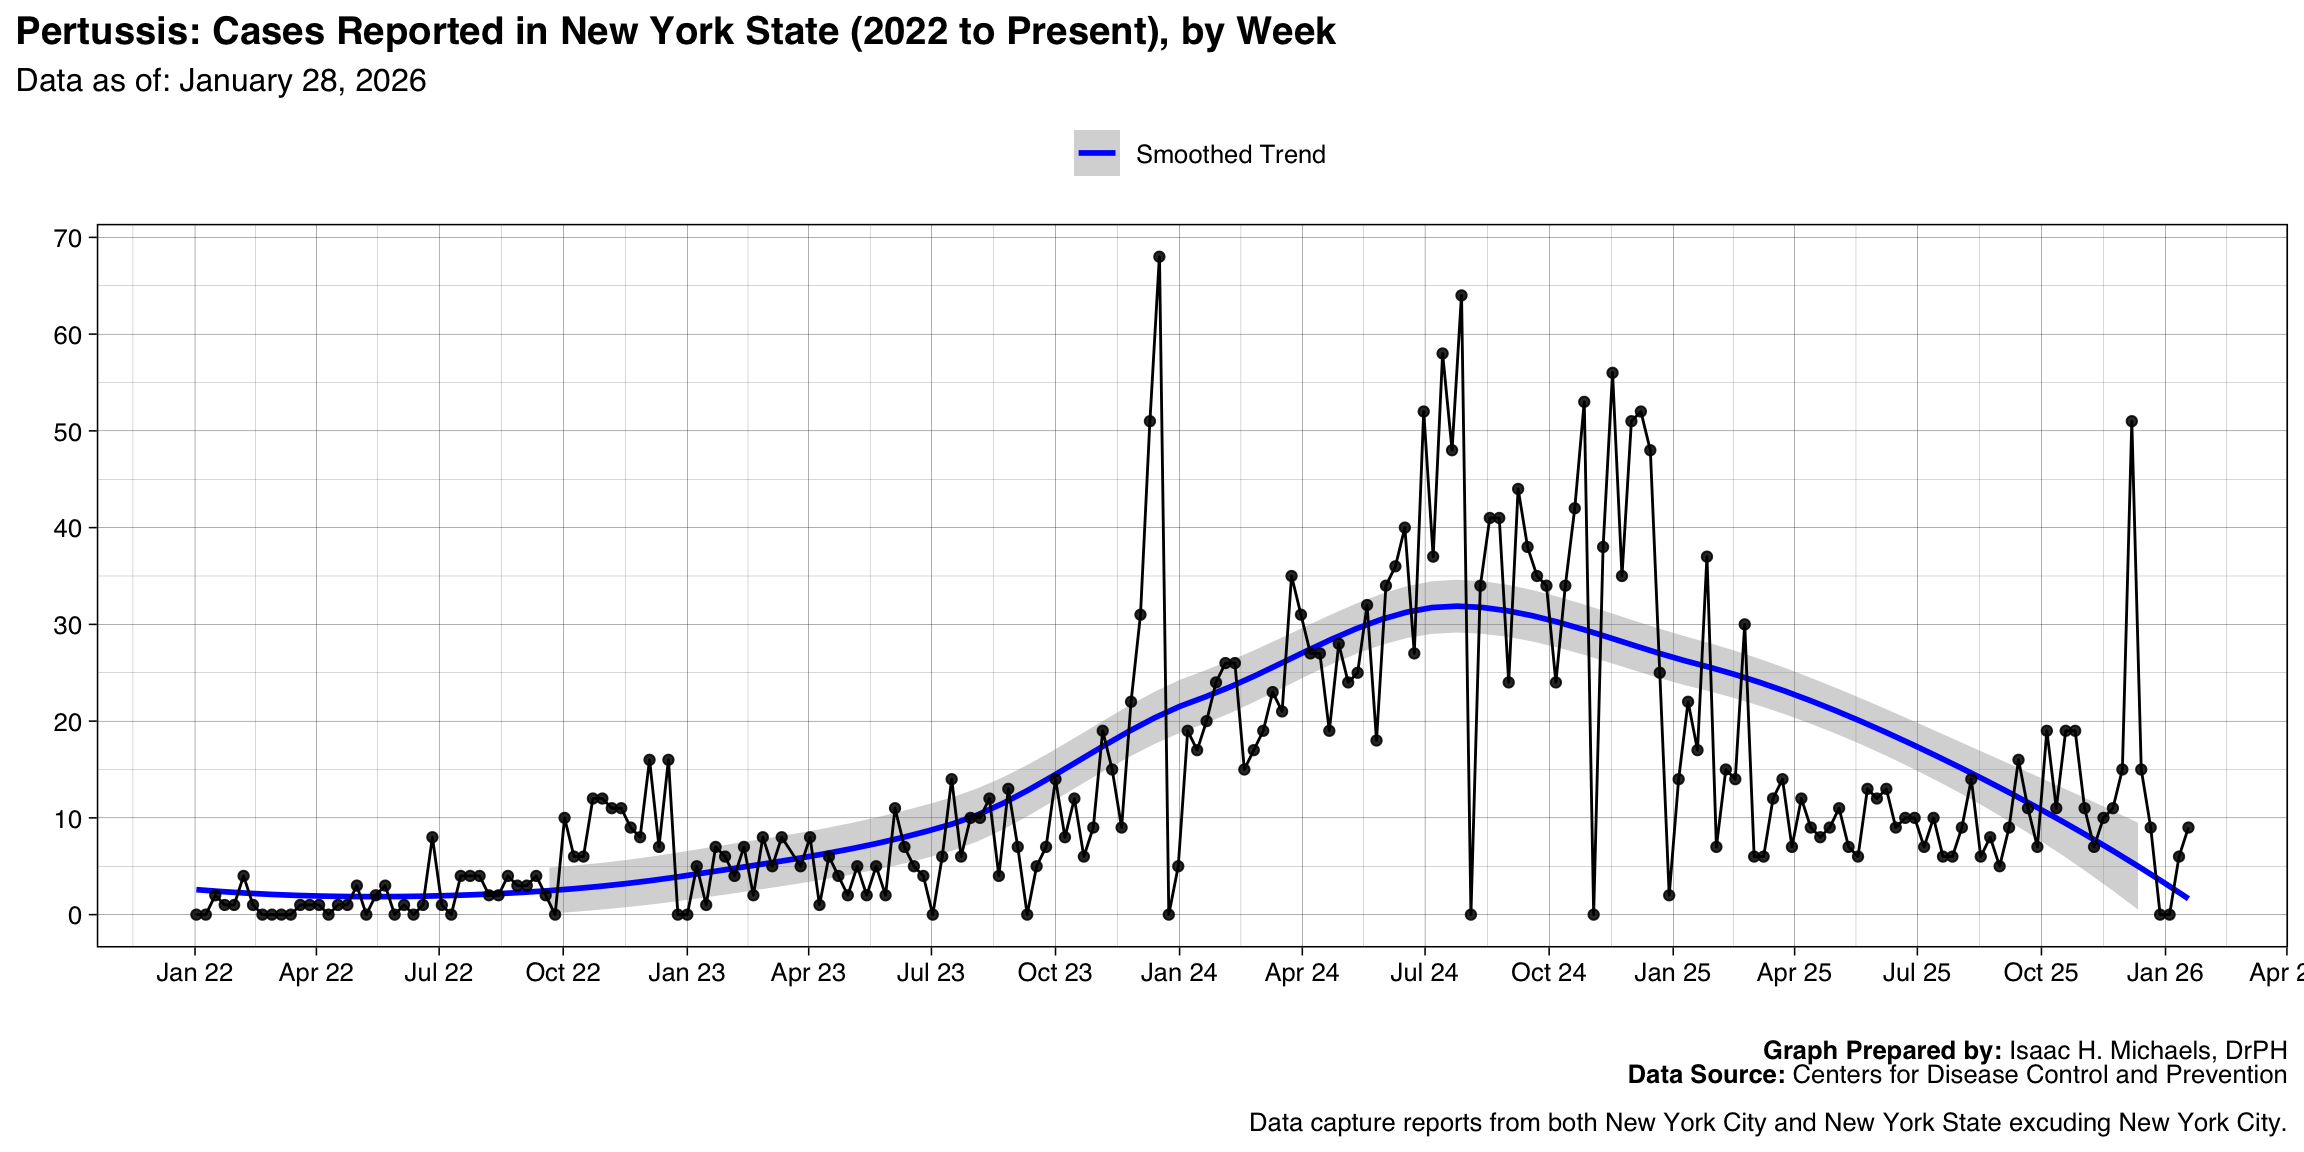
- Pertussis
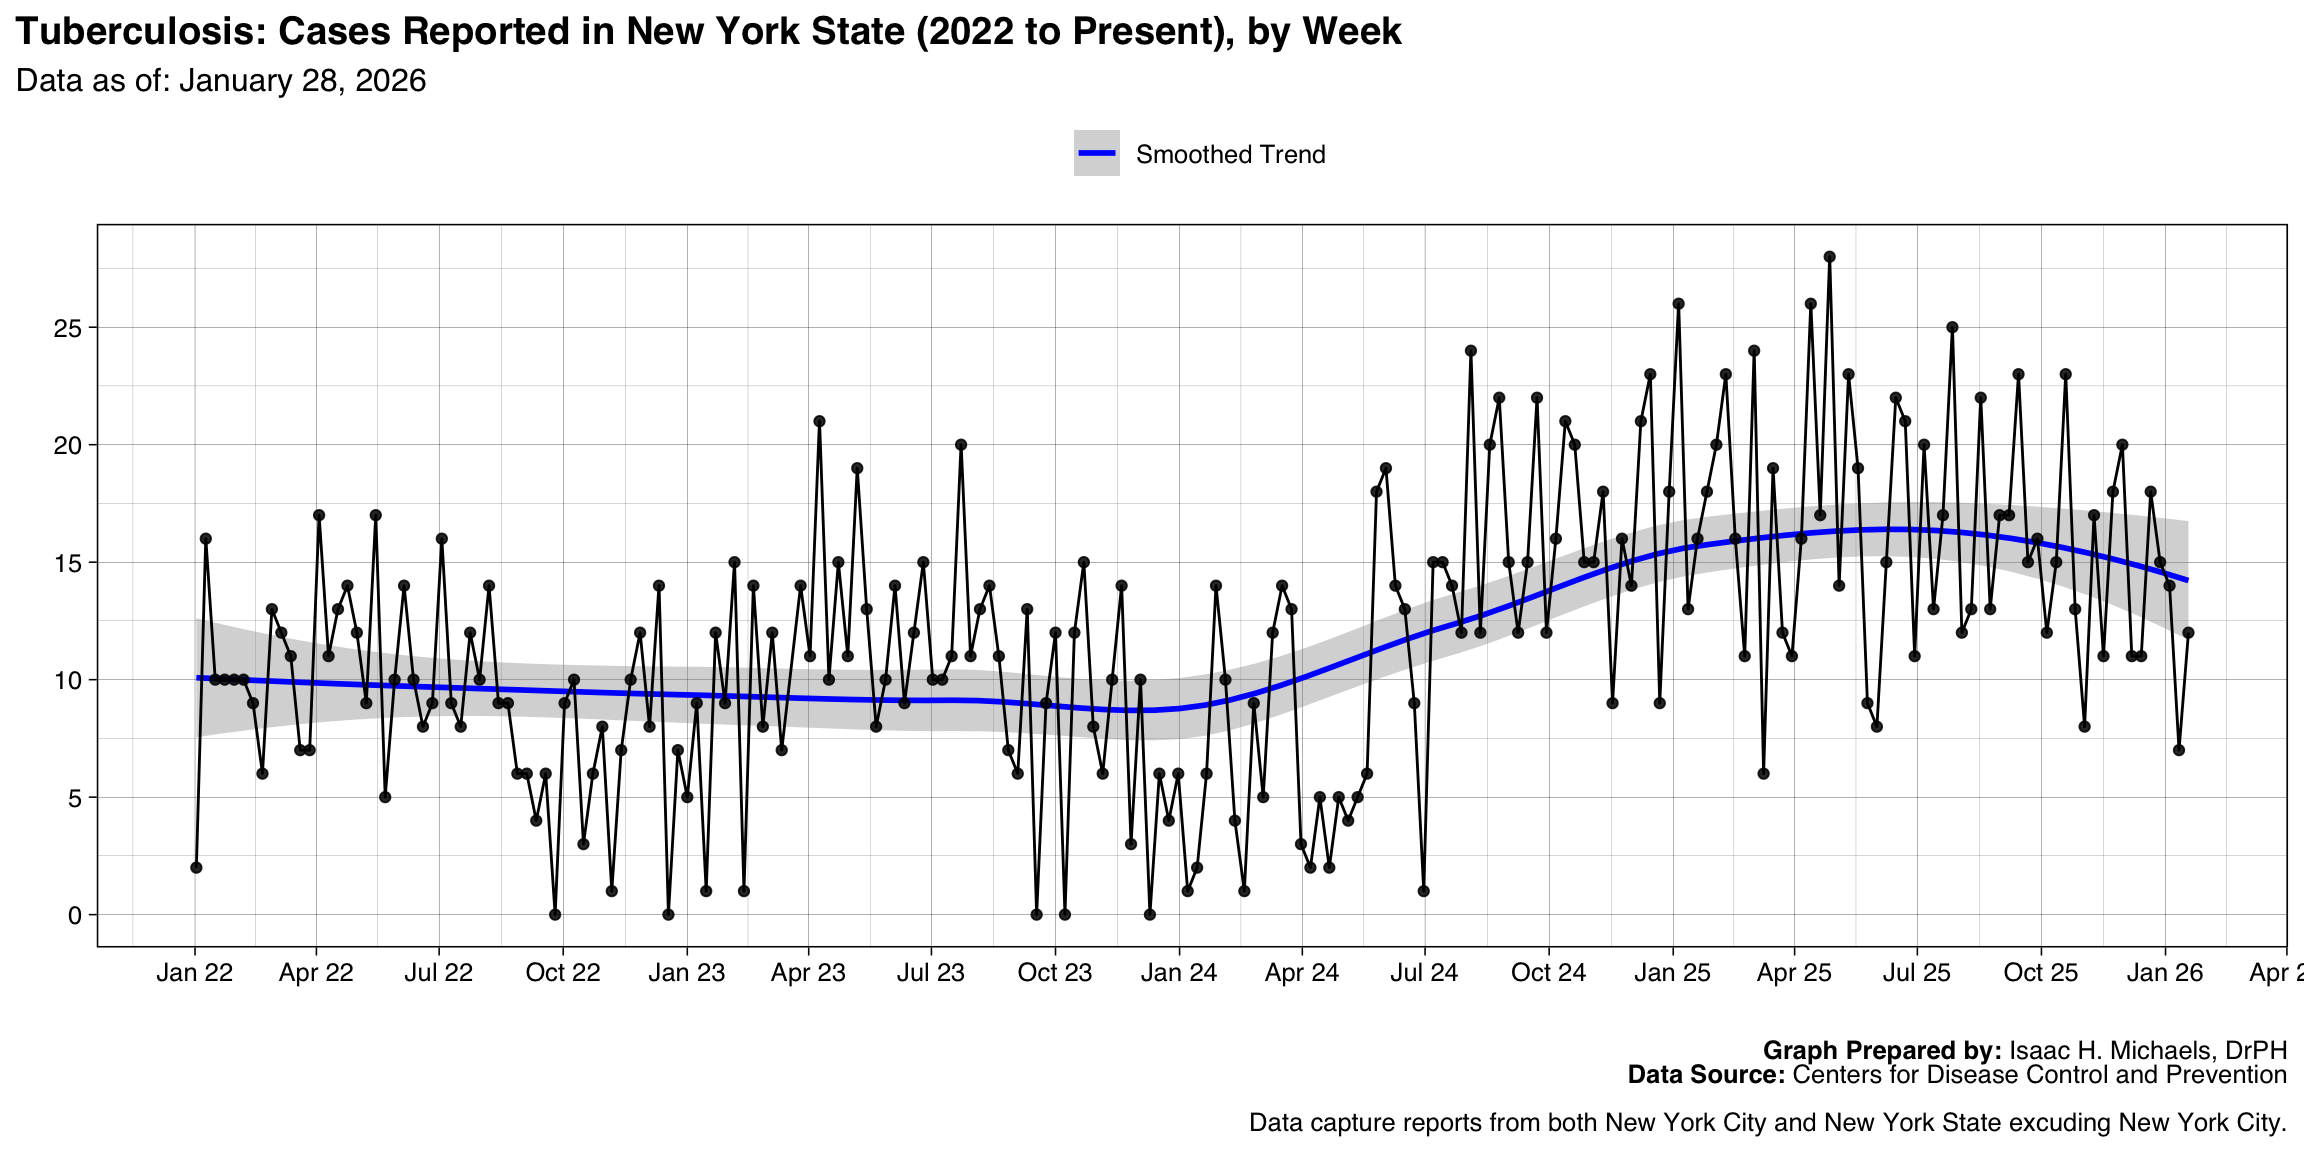
- Tuberculosis
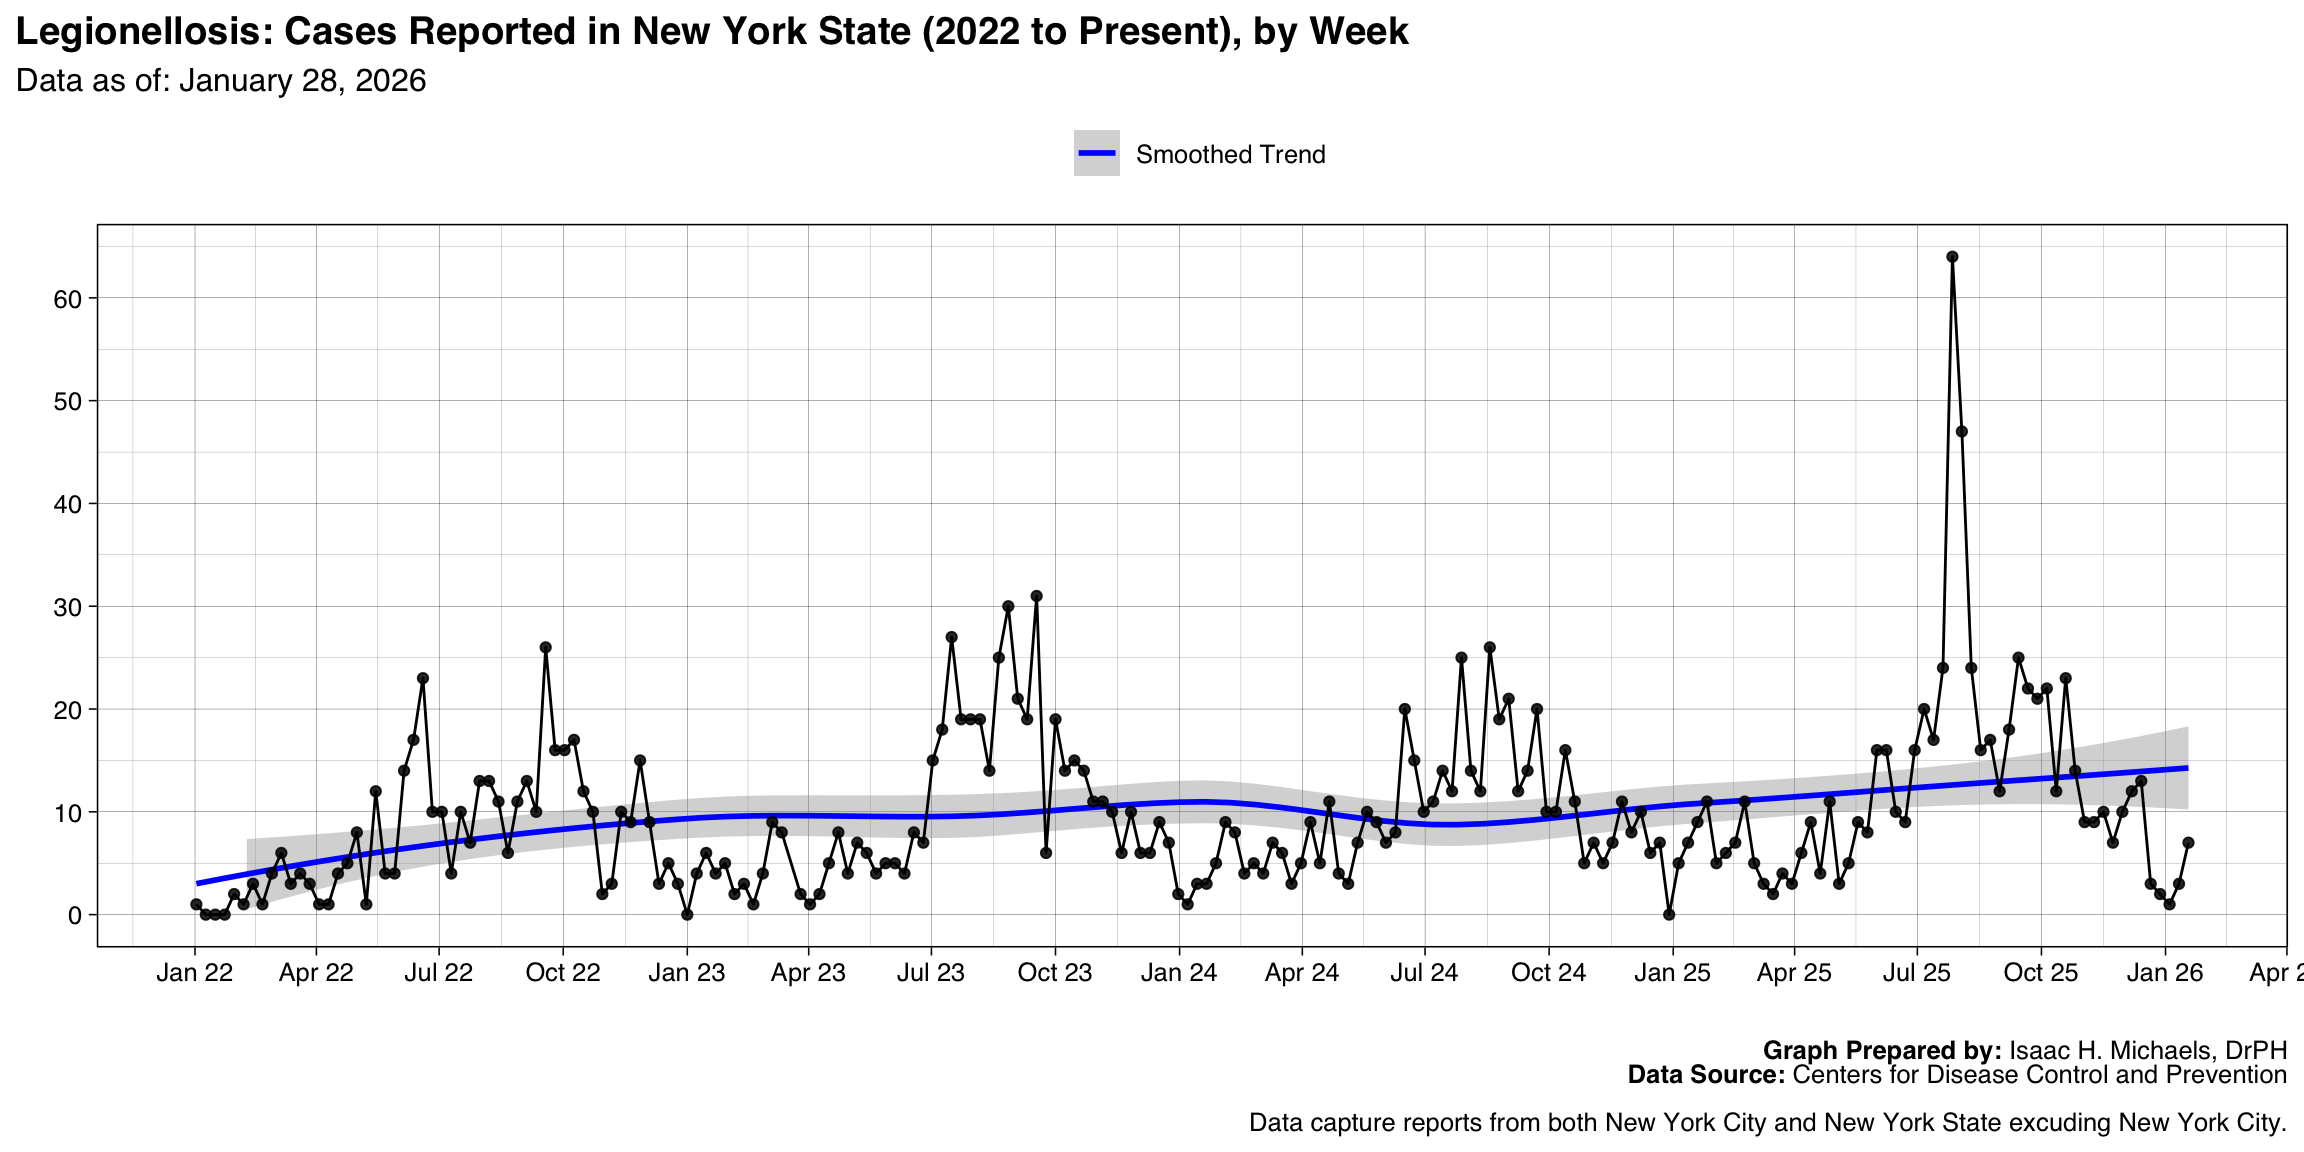
- Legionellosis
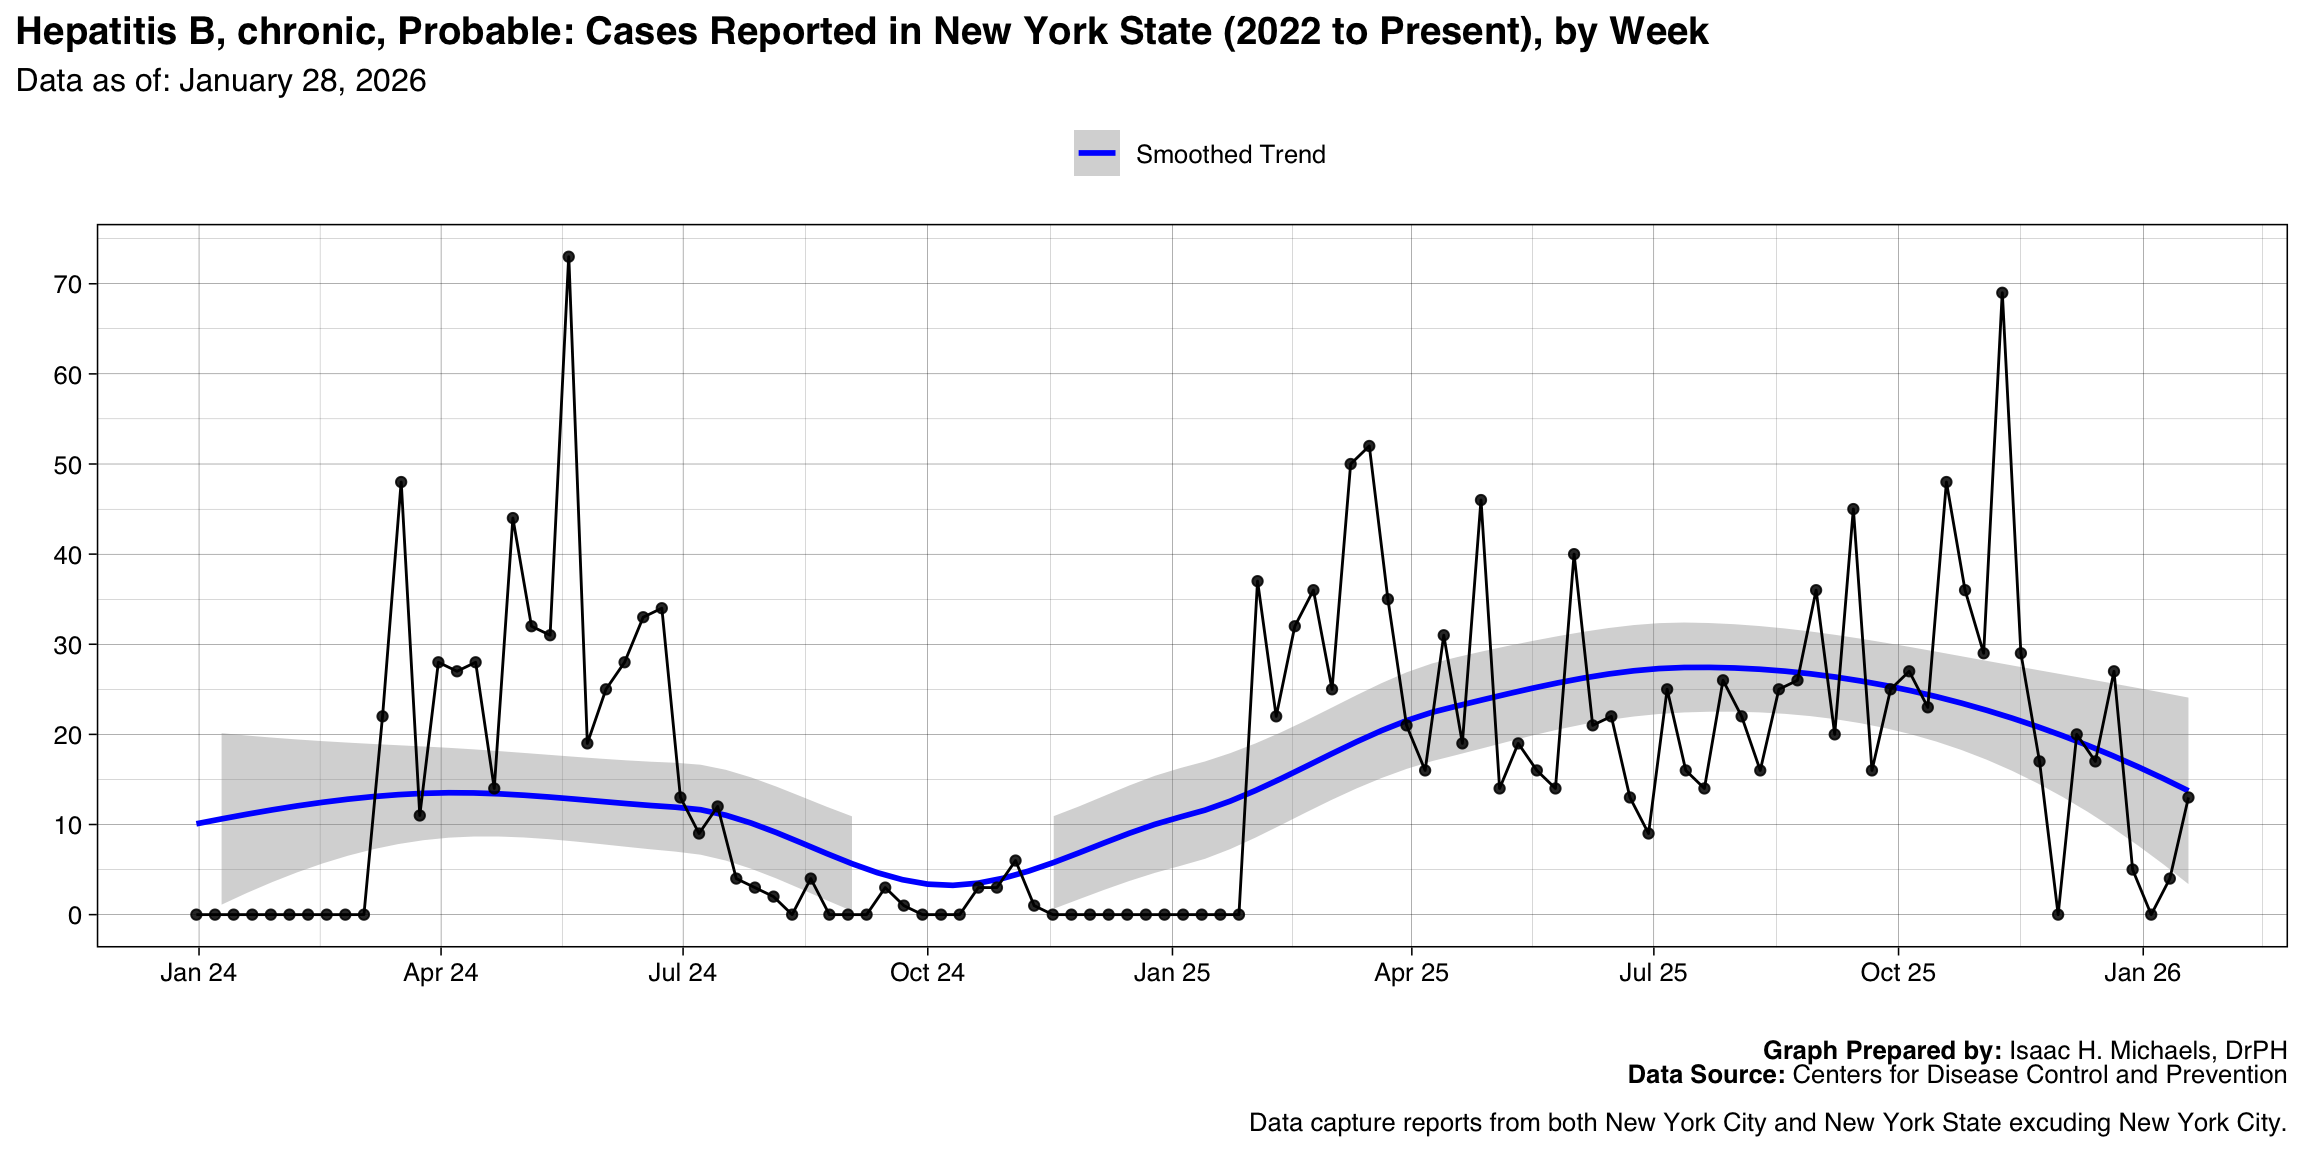
- Hepatitis B, chronic, Probable
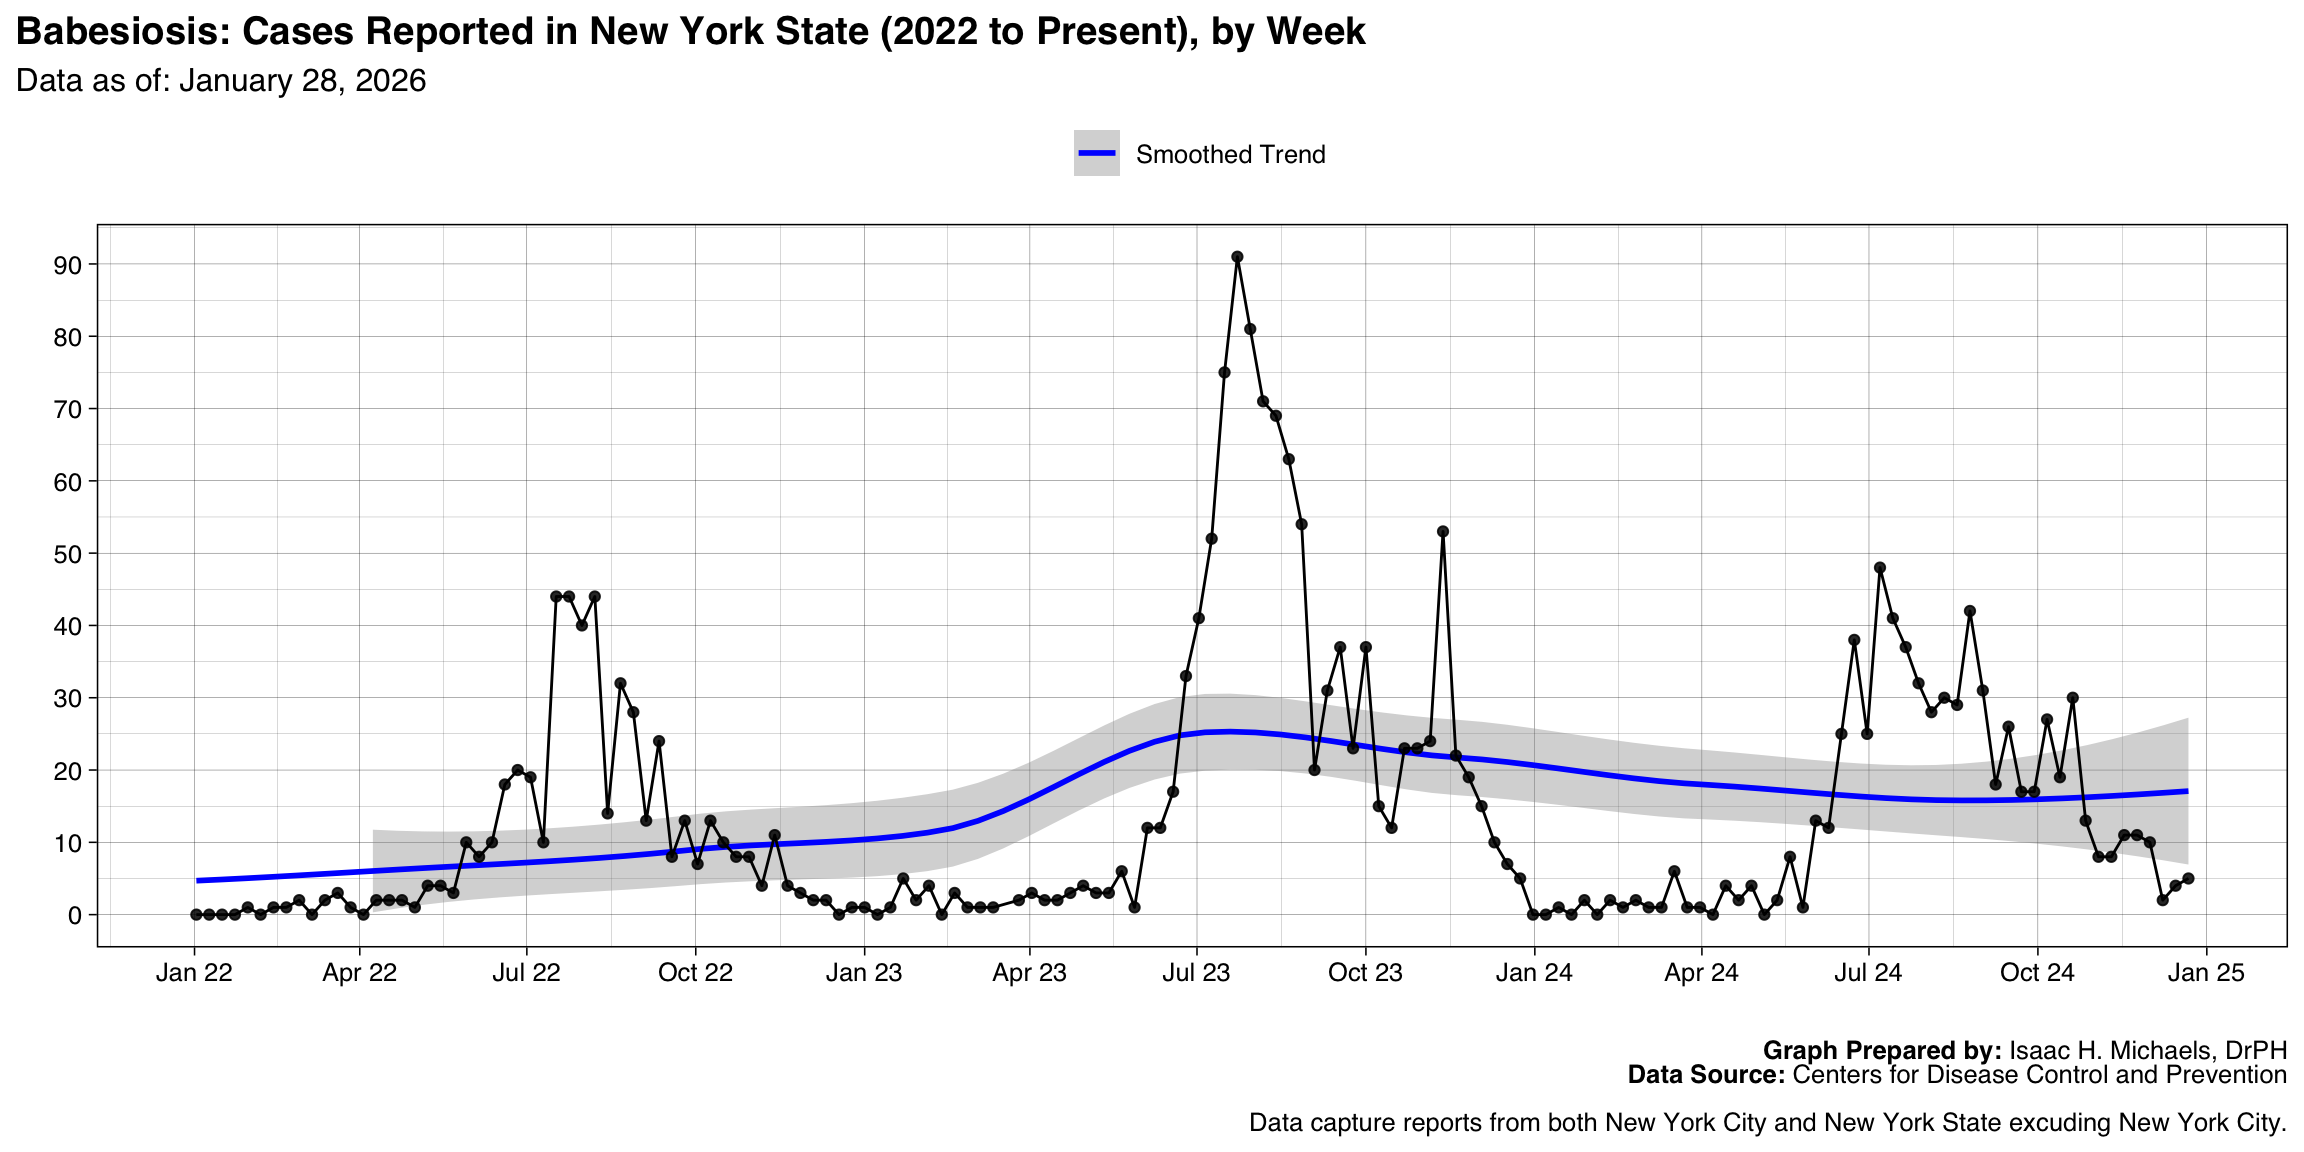
- Babesiosis
- Cryptosporidiosis
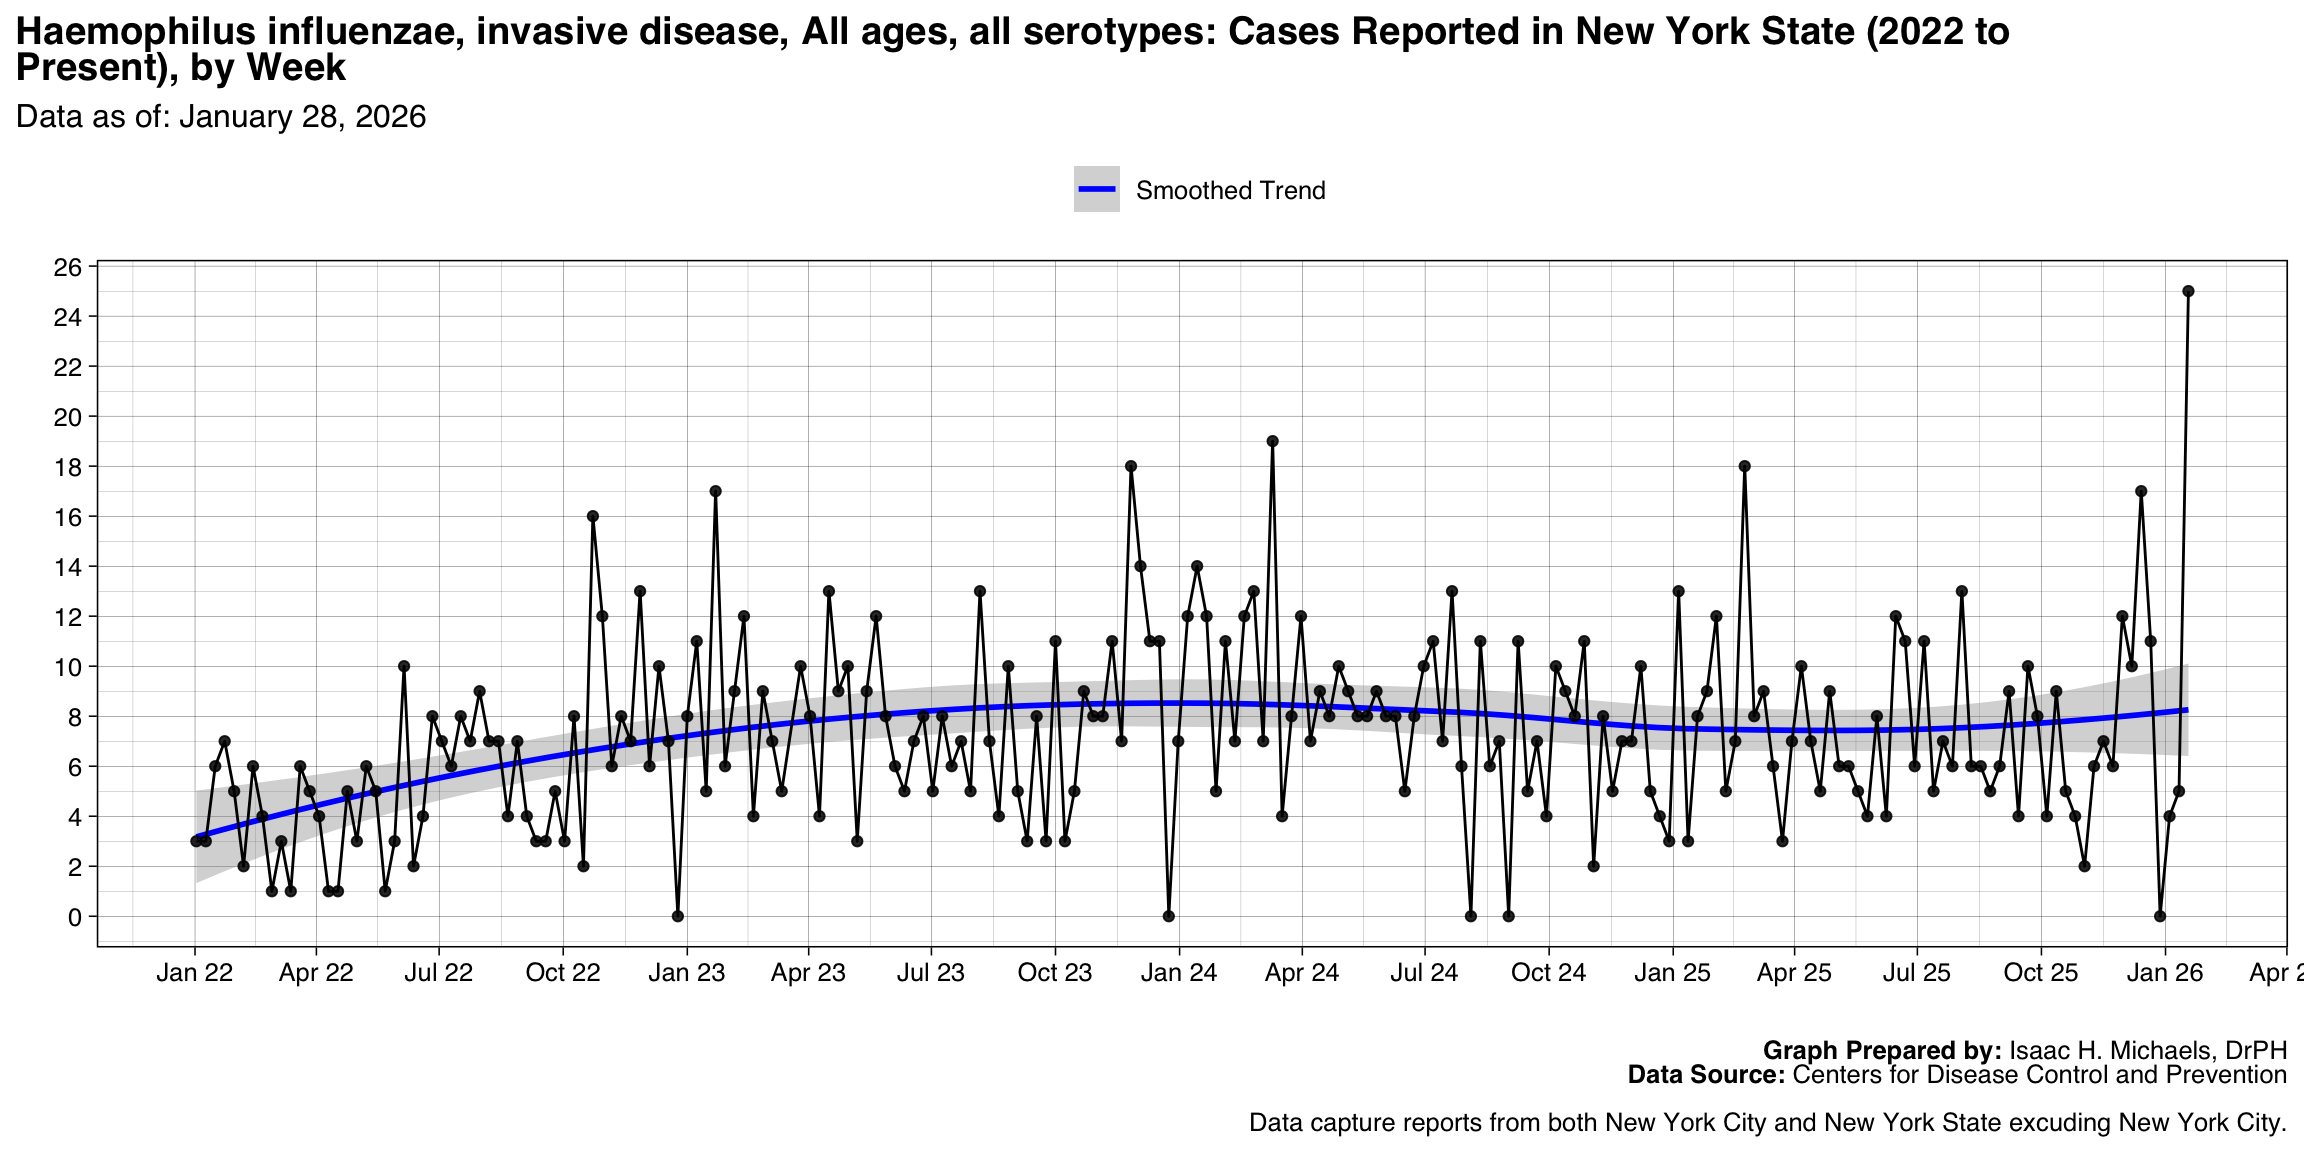
- Haemophilus influenzae, invasive disease, All ages, all serotypes
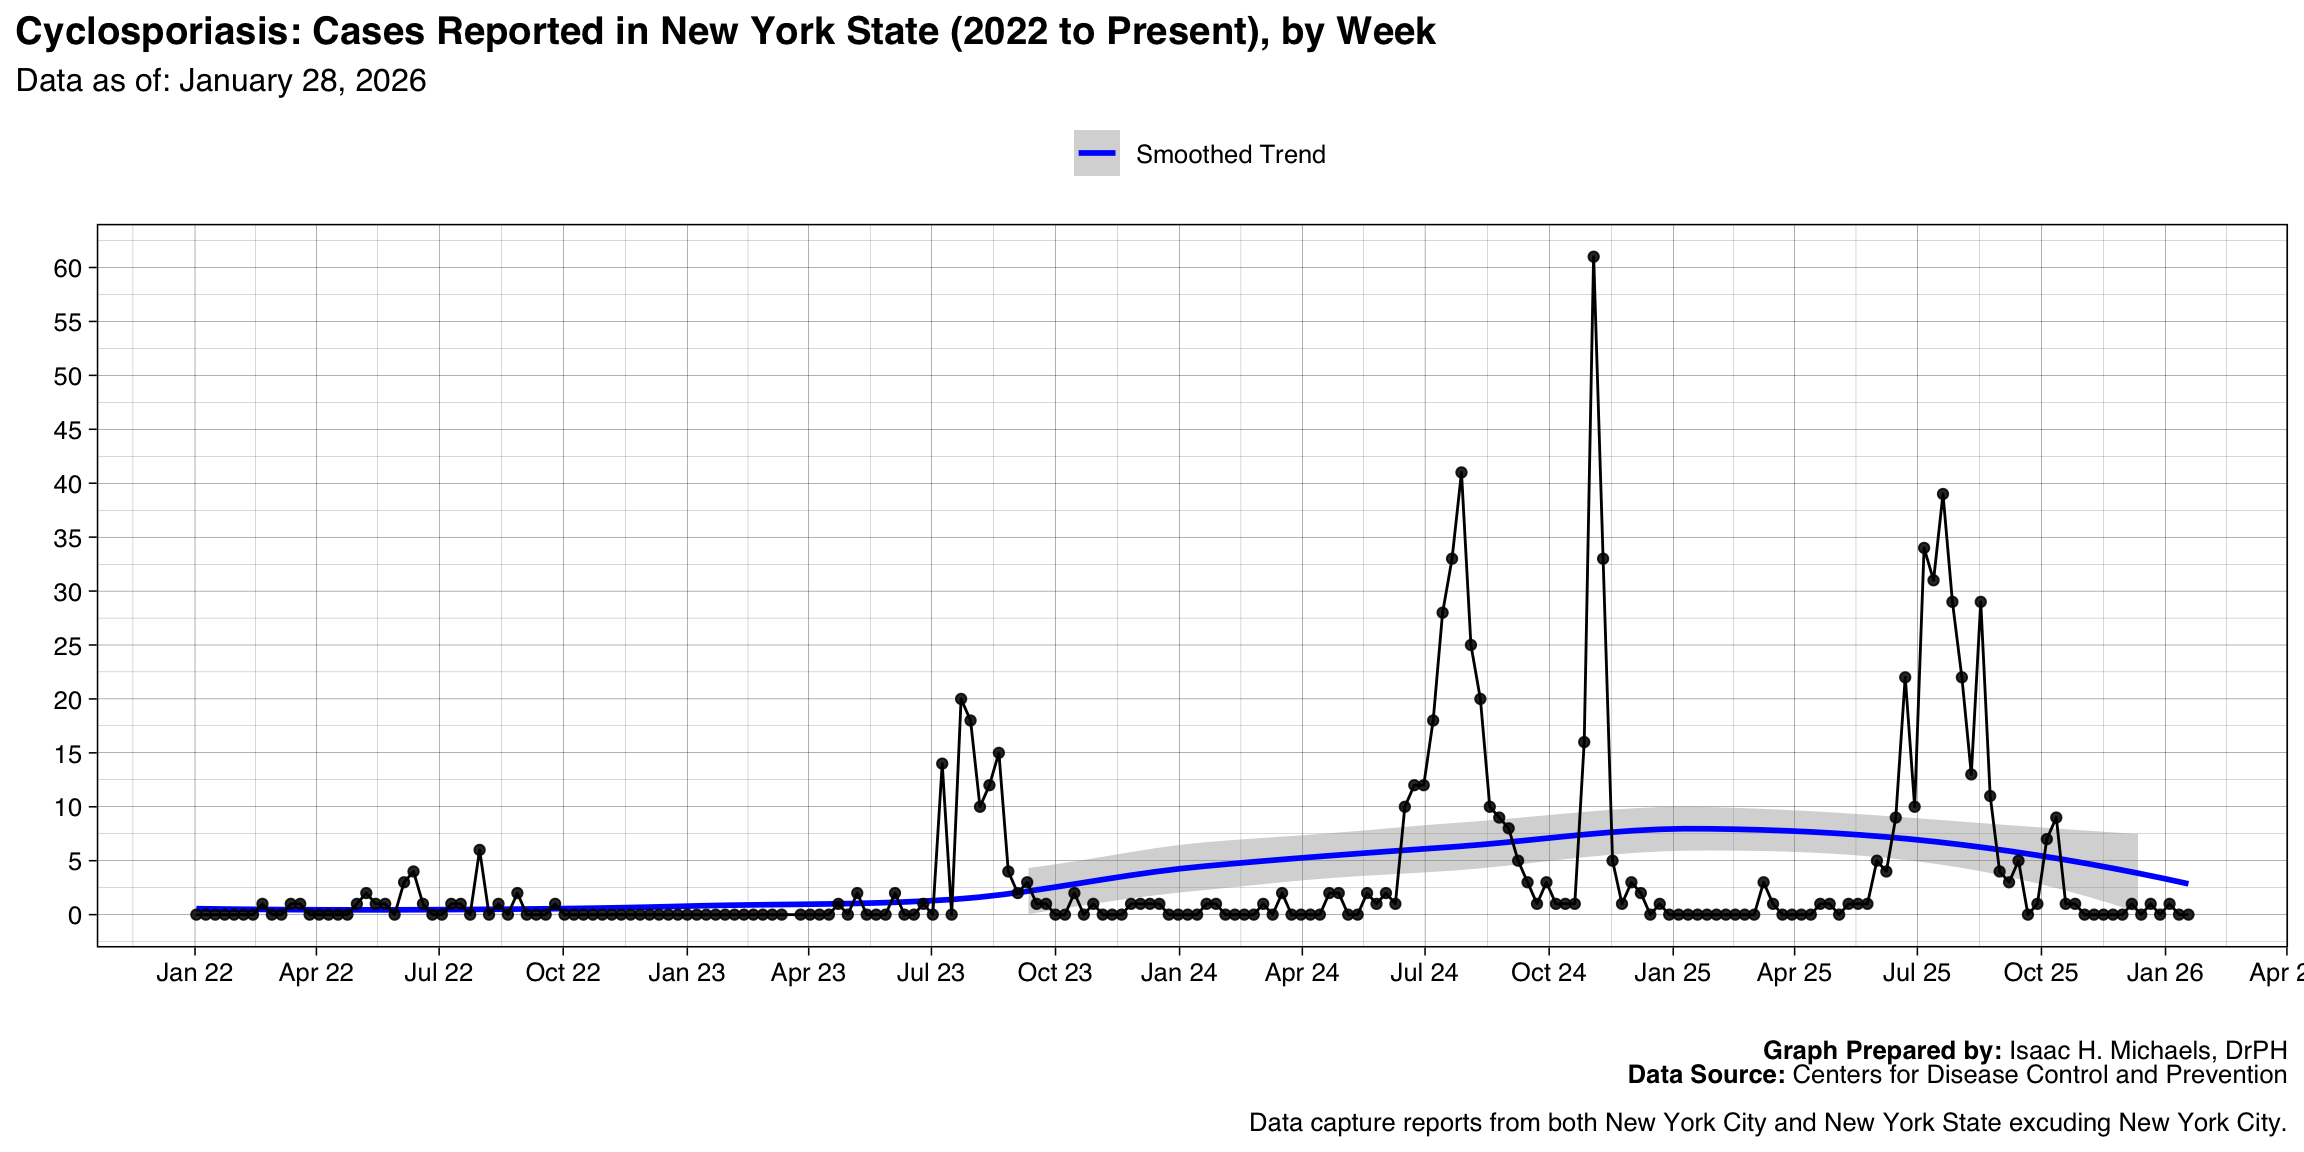
- Cyclosporiasis
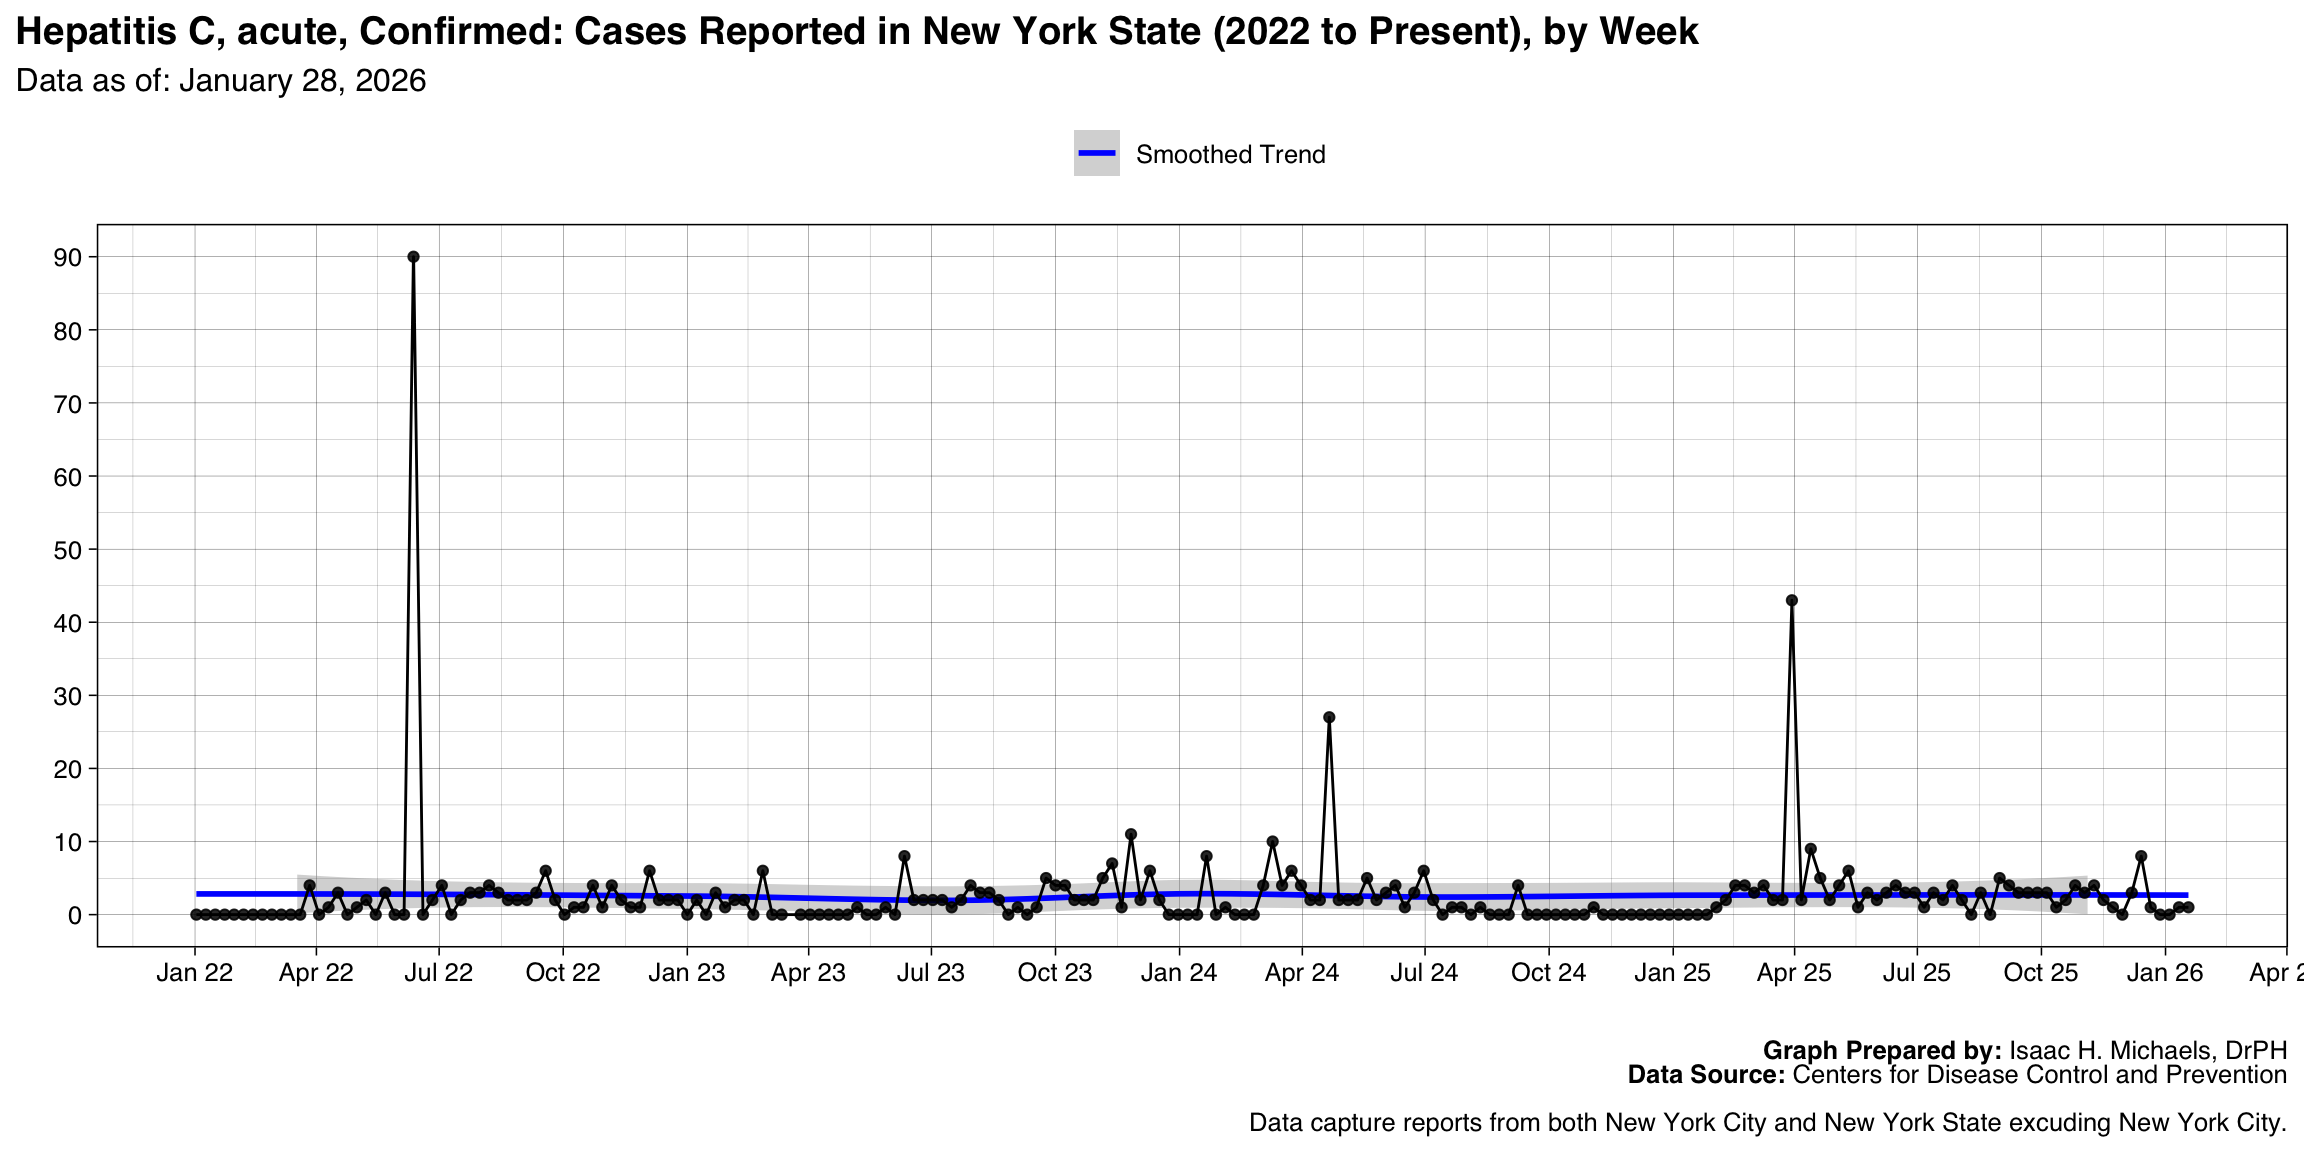
- Hepatitis C, acute, Confirmed
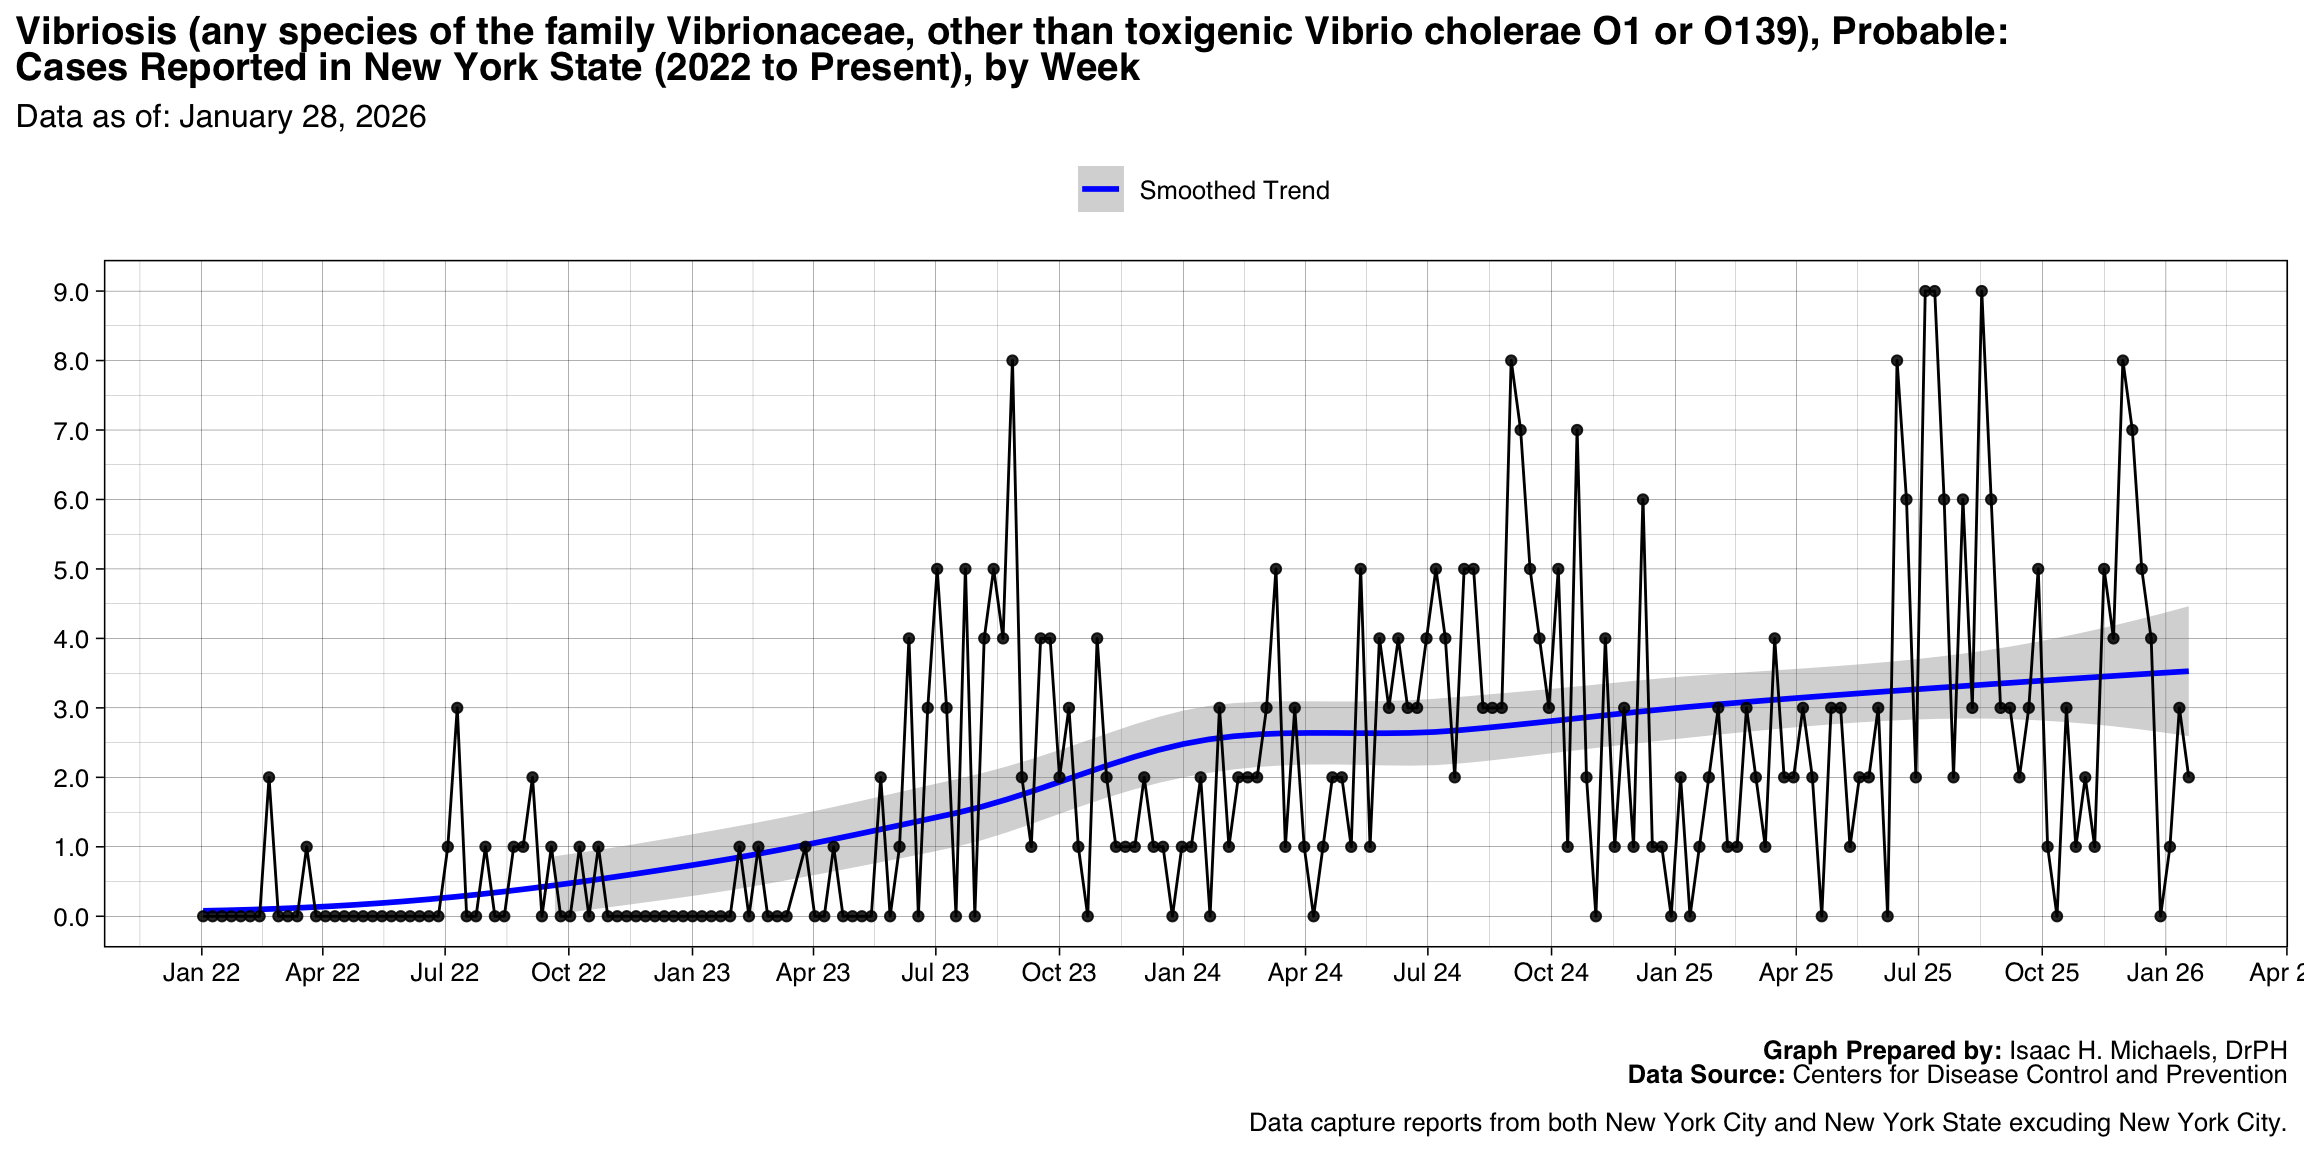
- Vibriosis (any species of the family Vibrionaceae, other than toxigenic Vibrio cholerae O1 or O139), Probable
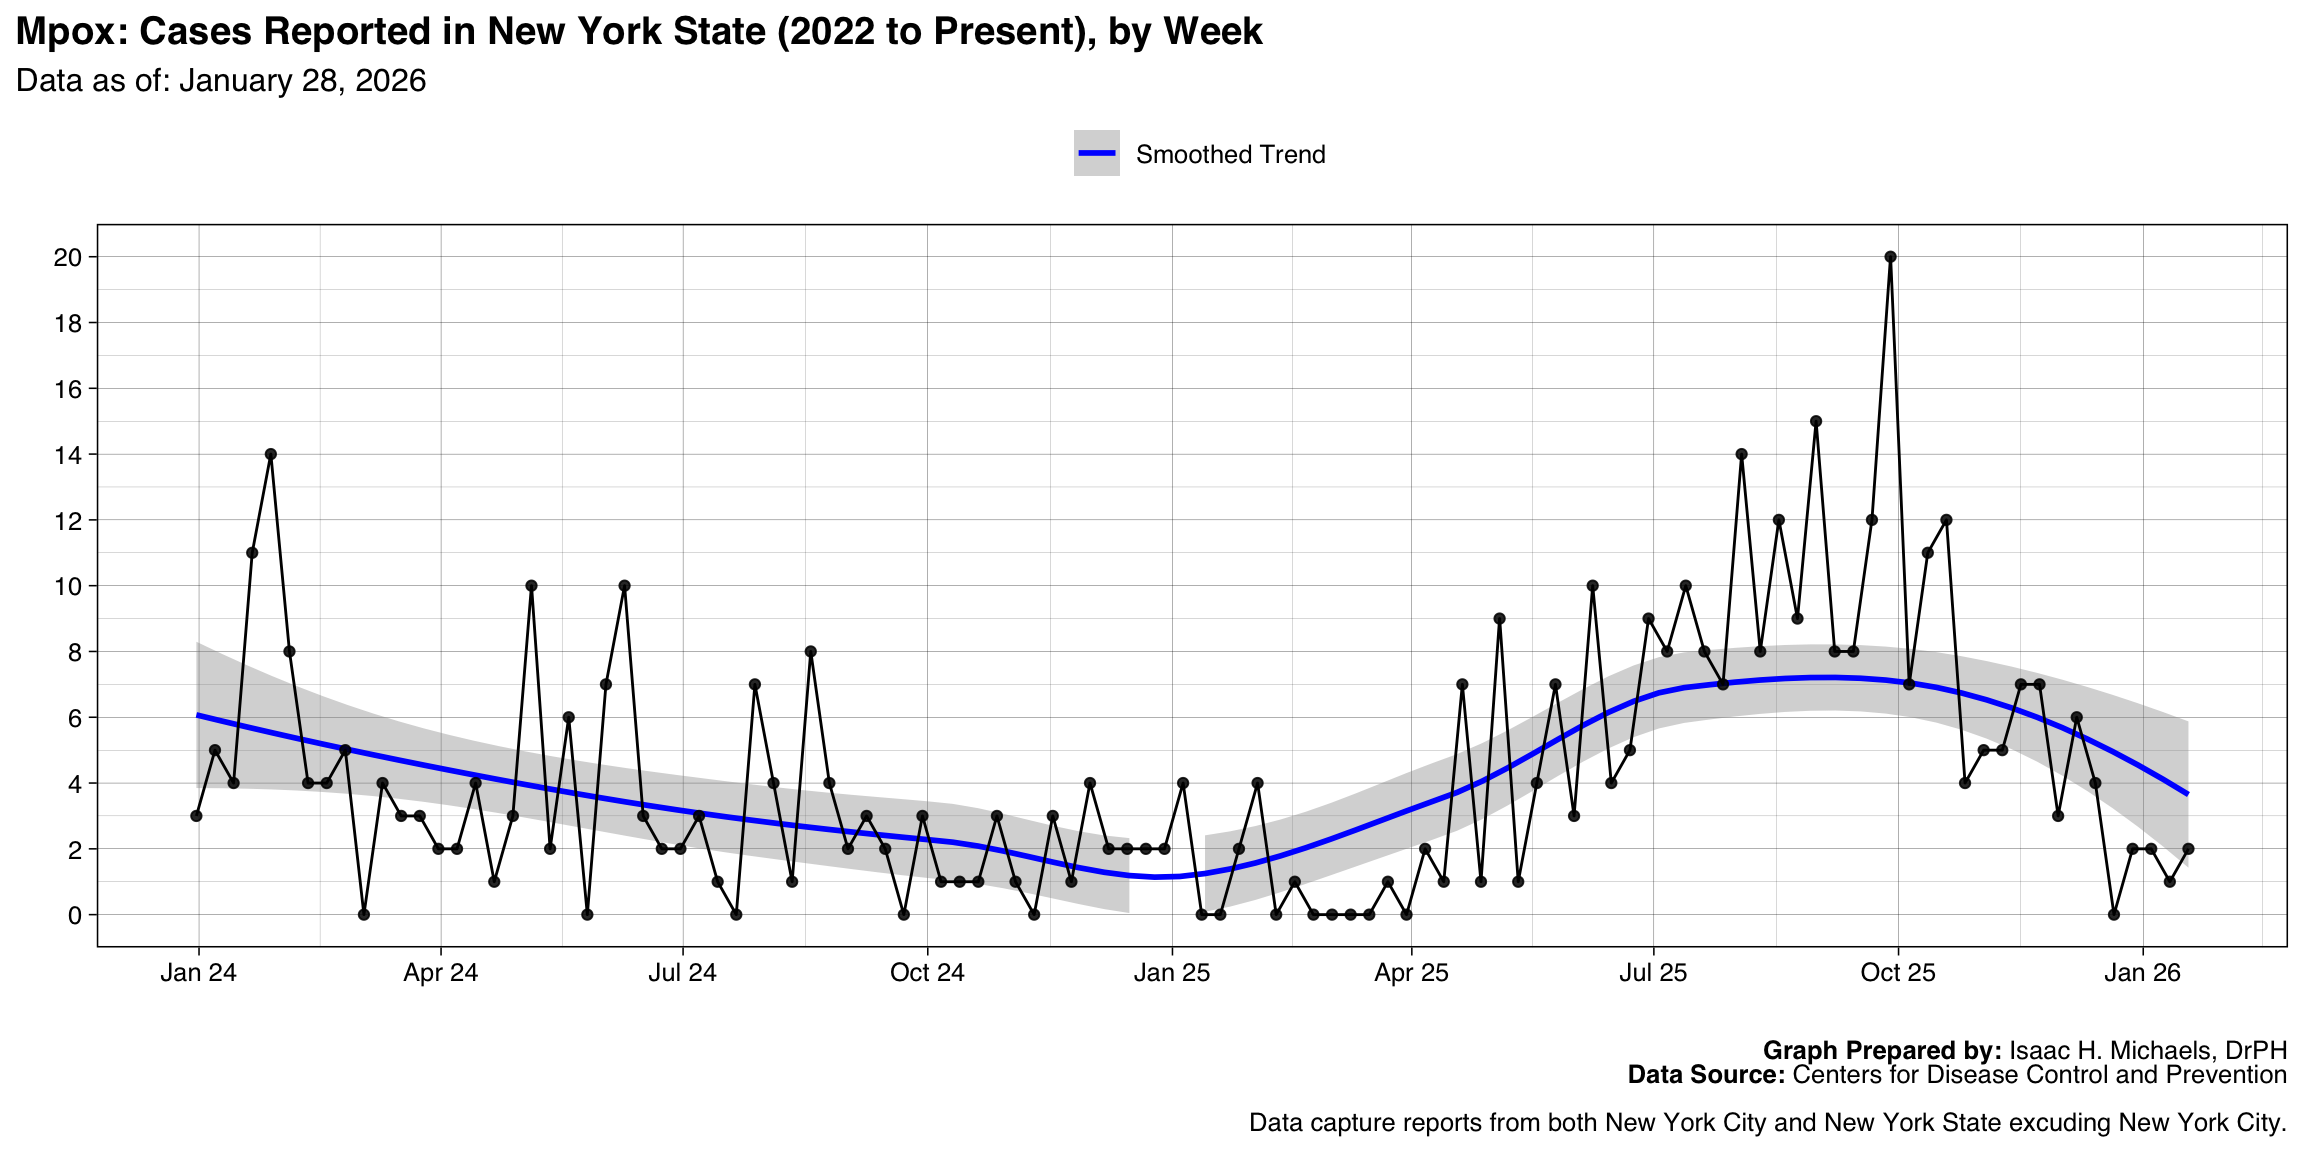
- Mpox
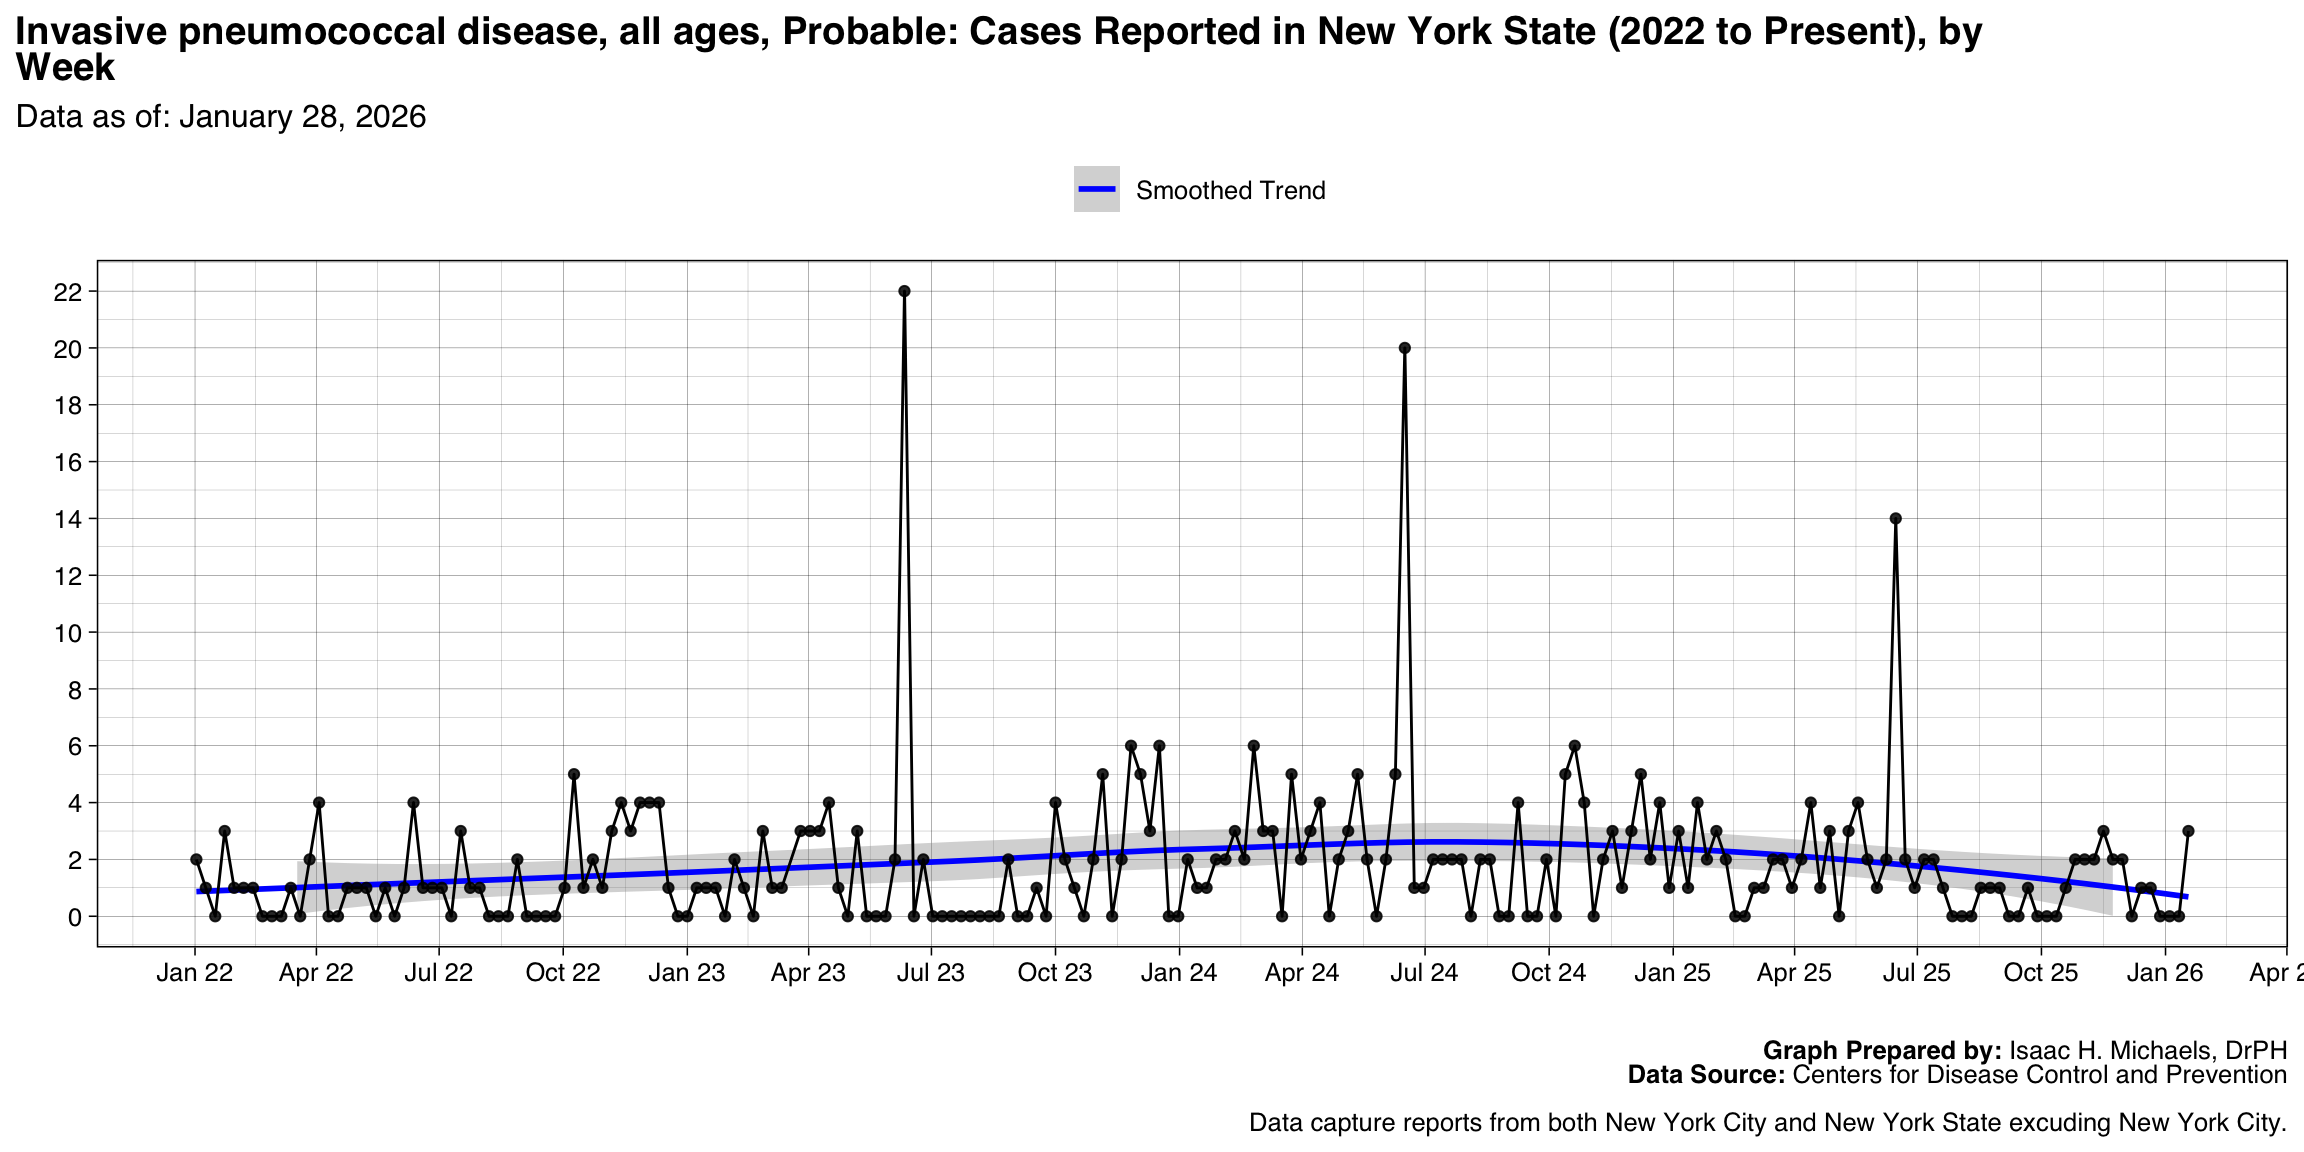
- Invasive pneumococcal disease, all ages, Probable
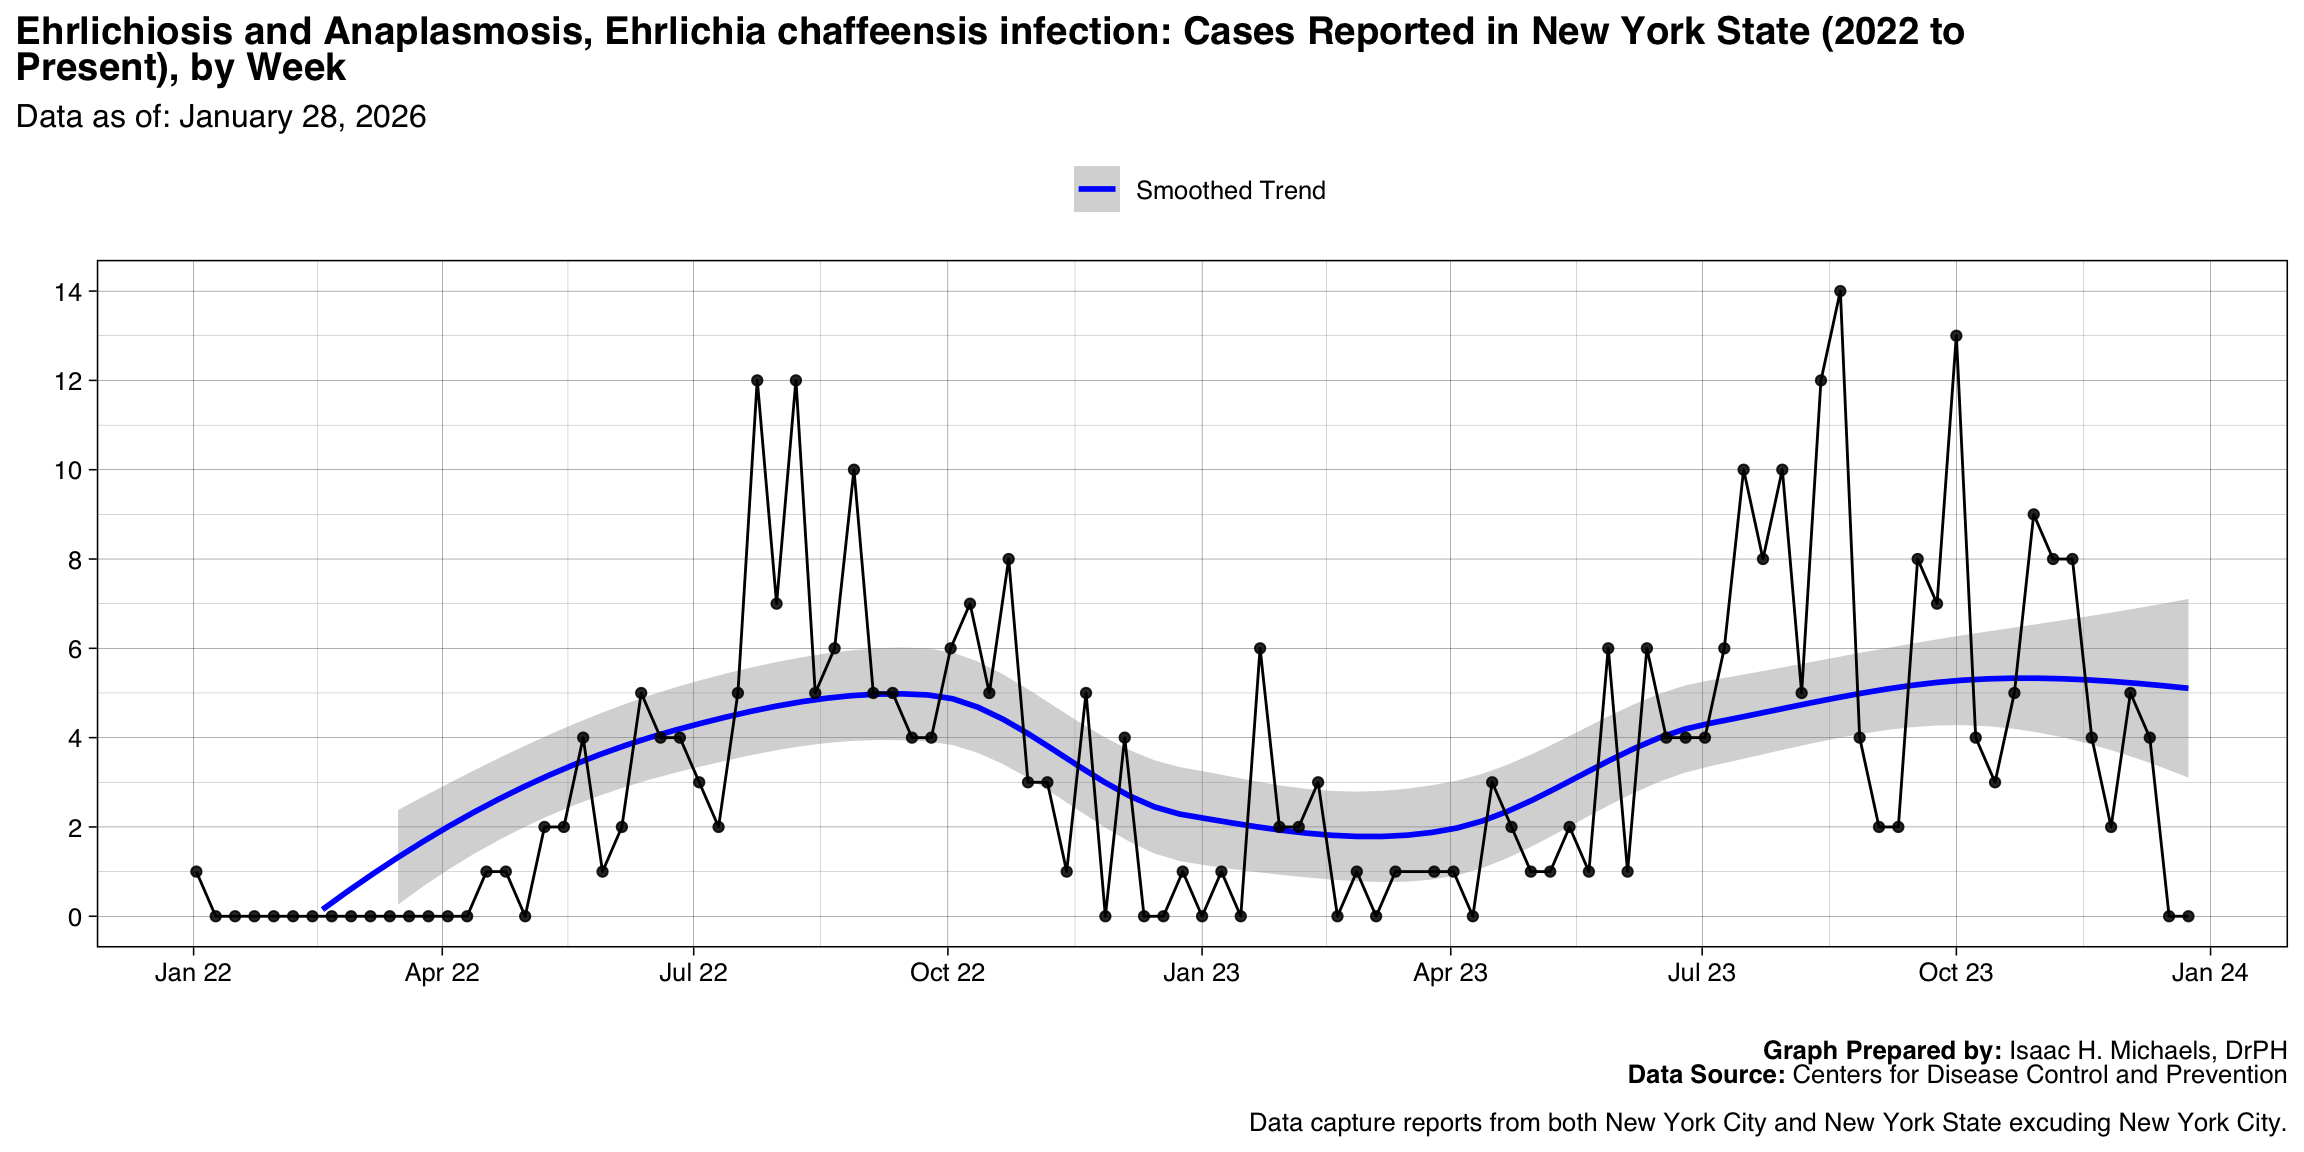
- Ehrlichiosis and Anaplasmosis, Ehrlichia chaffeensis infection
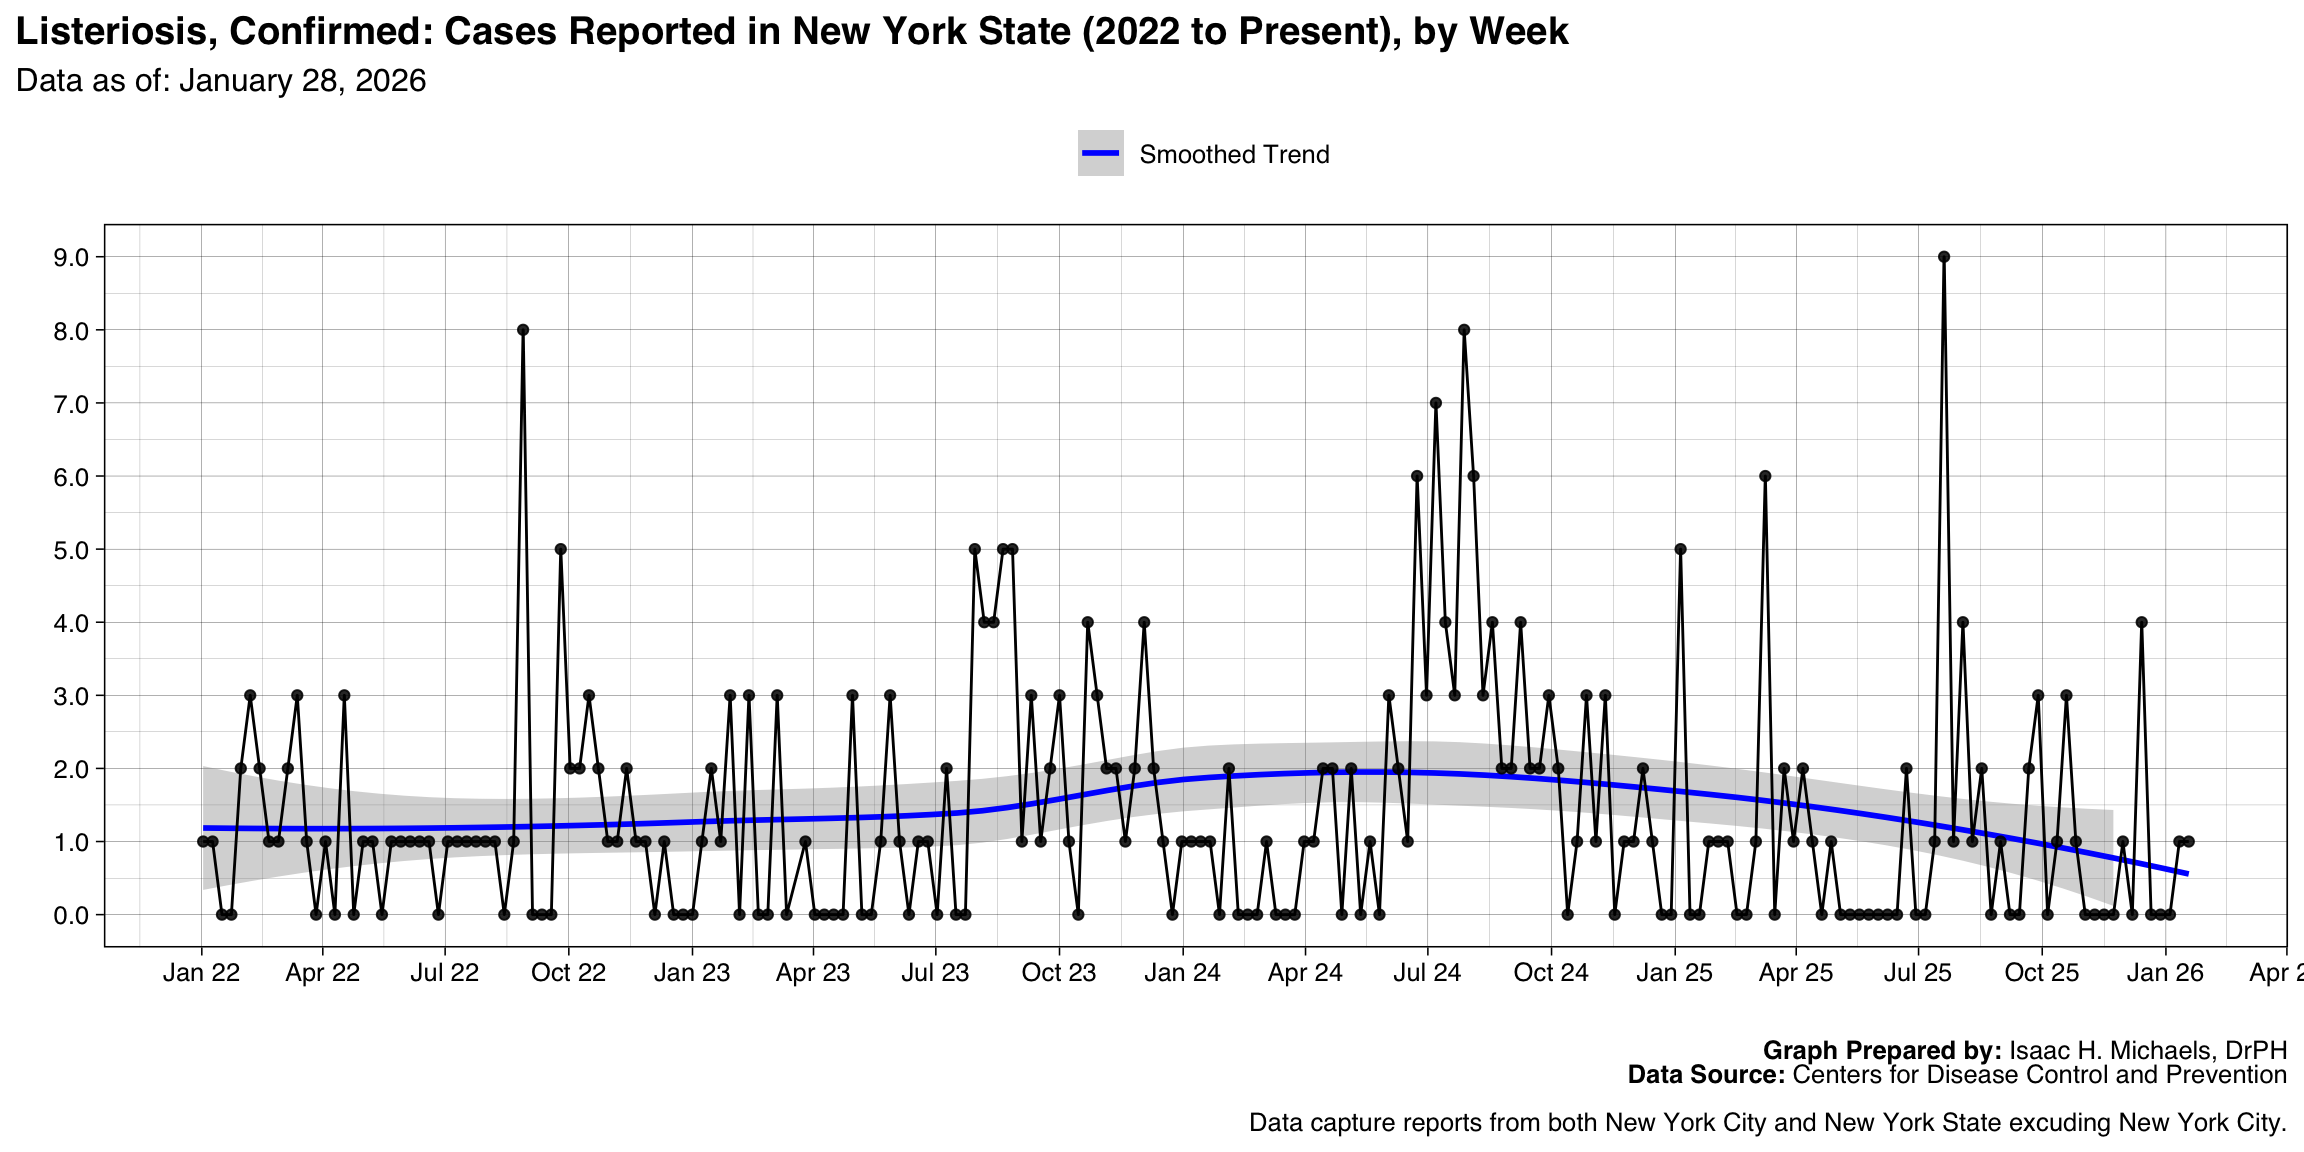
- Listeriosis, Confirmed
- Malaria
- Invasive pneumococcal disease, age <5 years, Confirmed
- Rabies, Animal
- Hepatitis A, Confirmed
- Vibriosis (any species of the family Vibrionaceae, other than toxigenic Vibrio cholerae O1 or O139), Confirmed
- Hepatitis B, acute, Confirmed
- Meningococcal disease, All serogroups
- Meningococcal disease, Unknown serogroup
- Hepatitis, A, acute
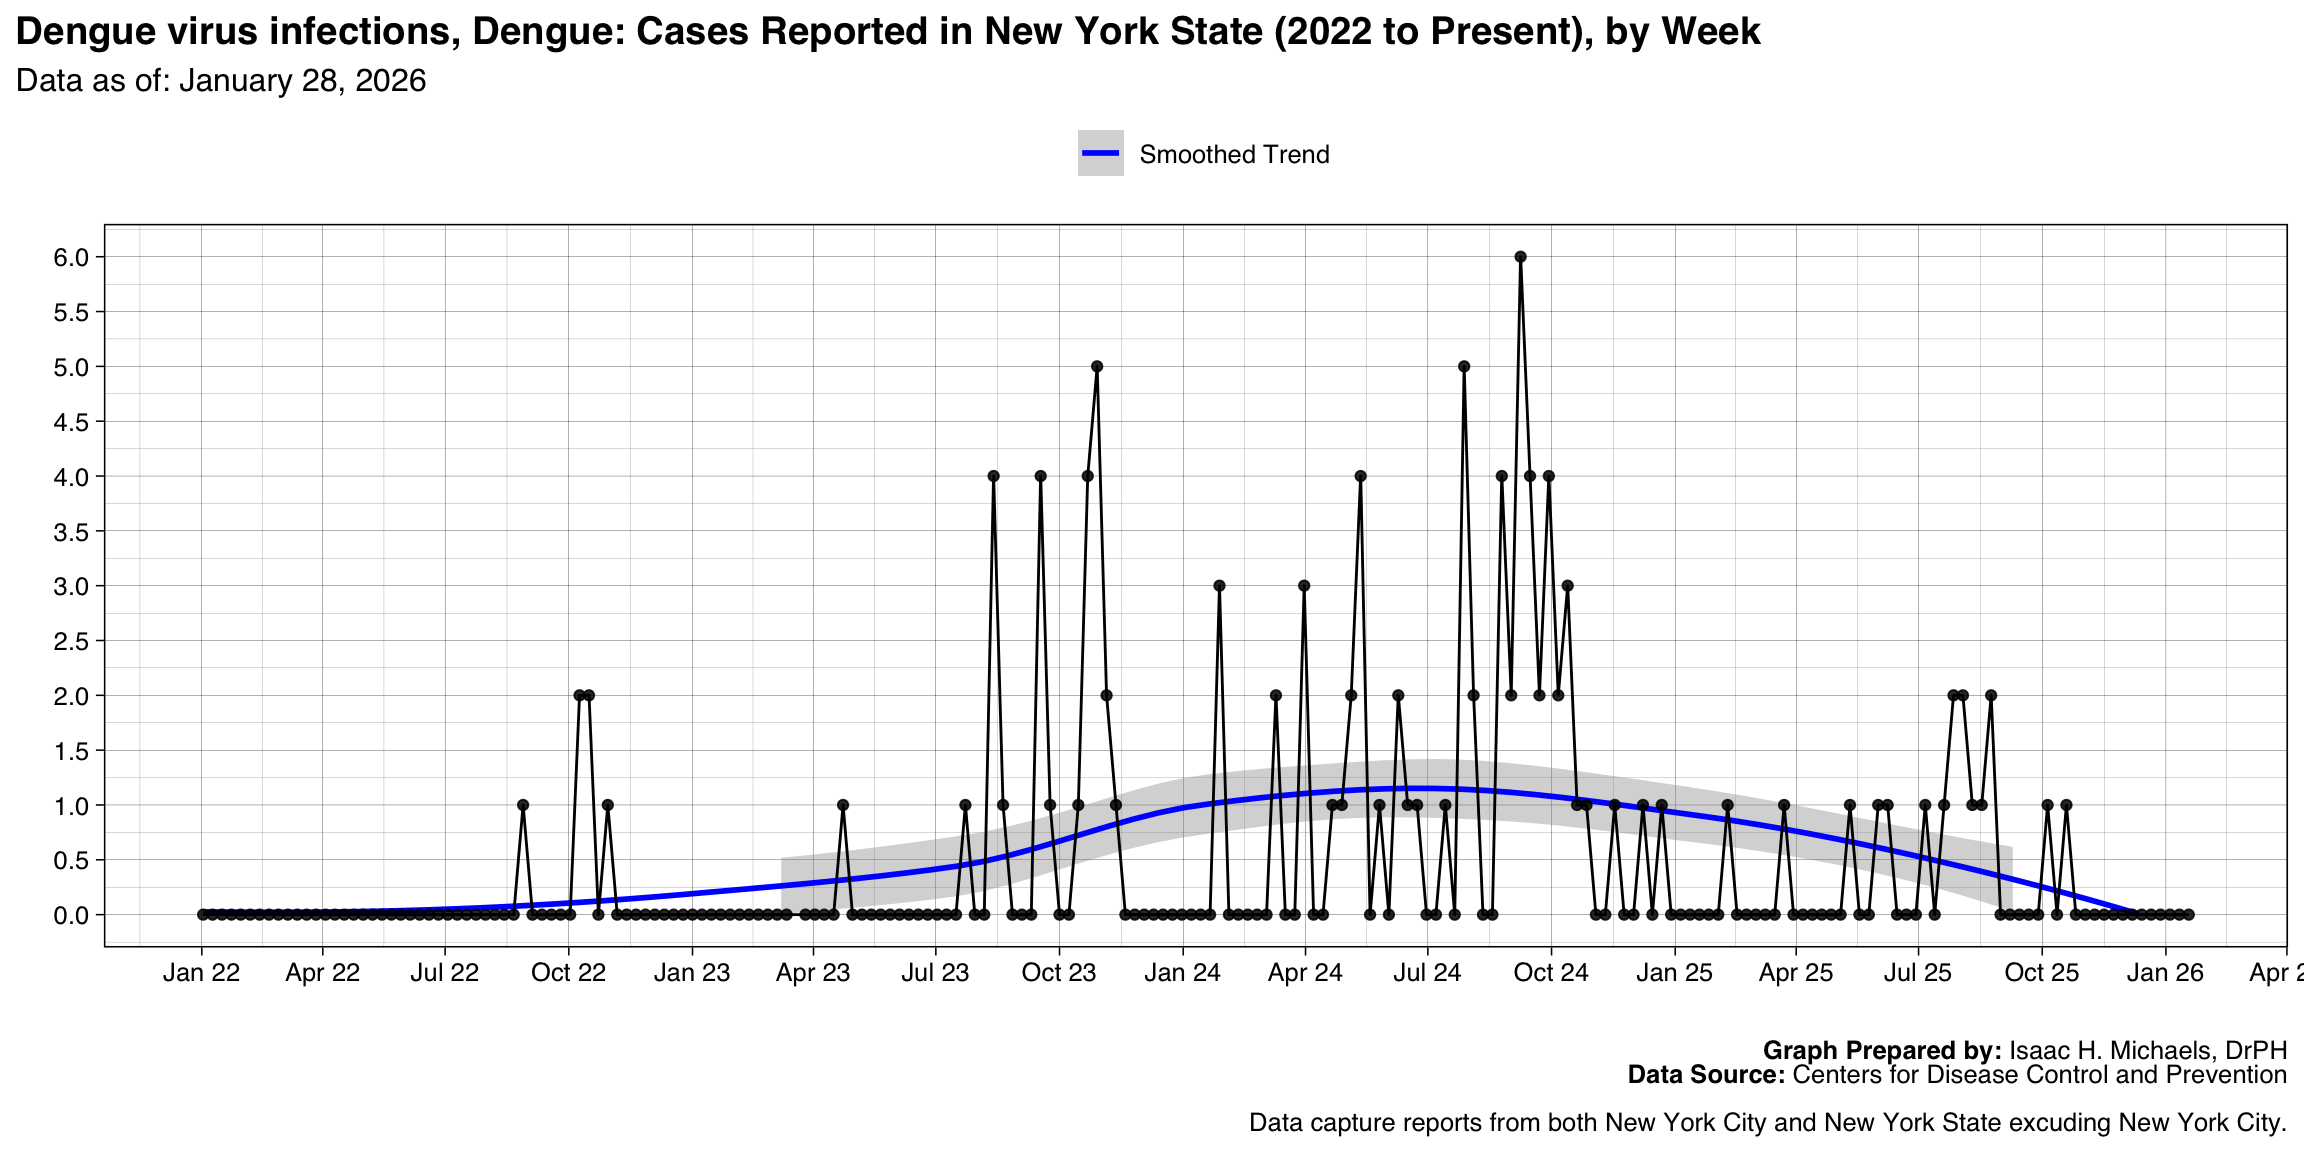
- Dengue virus infections, Dengue
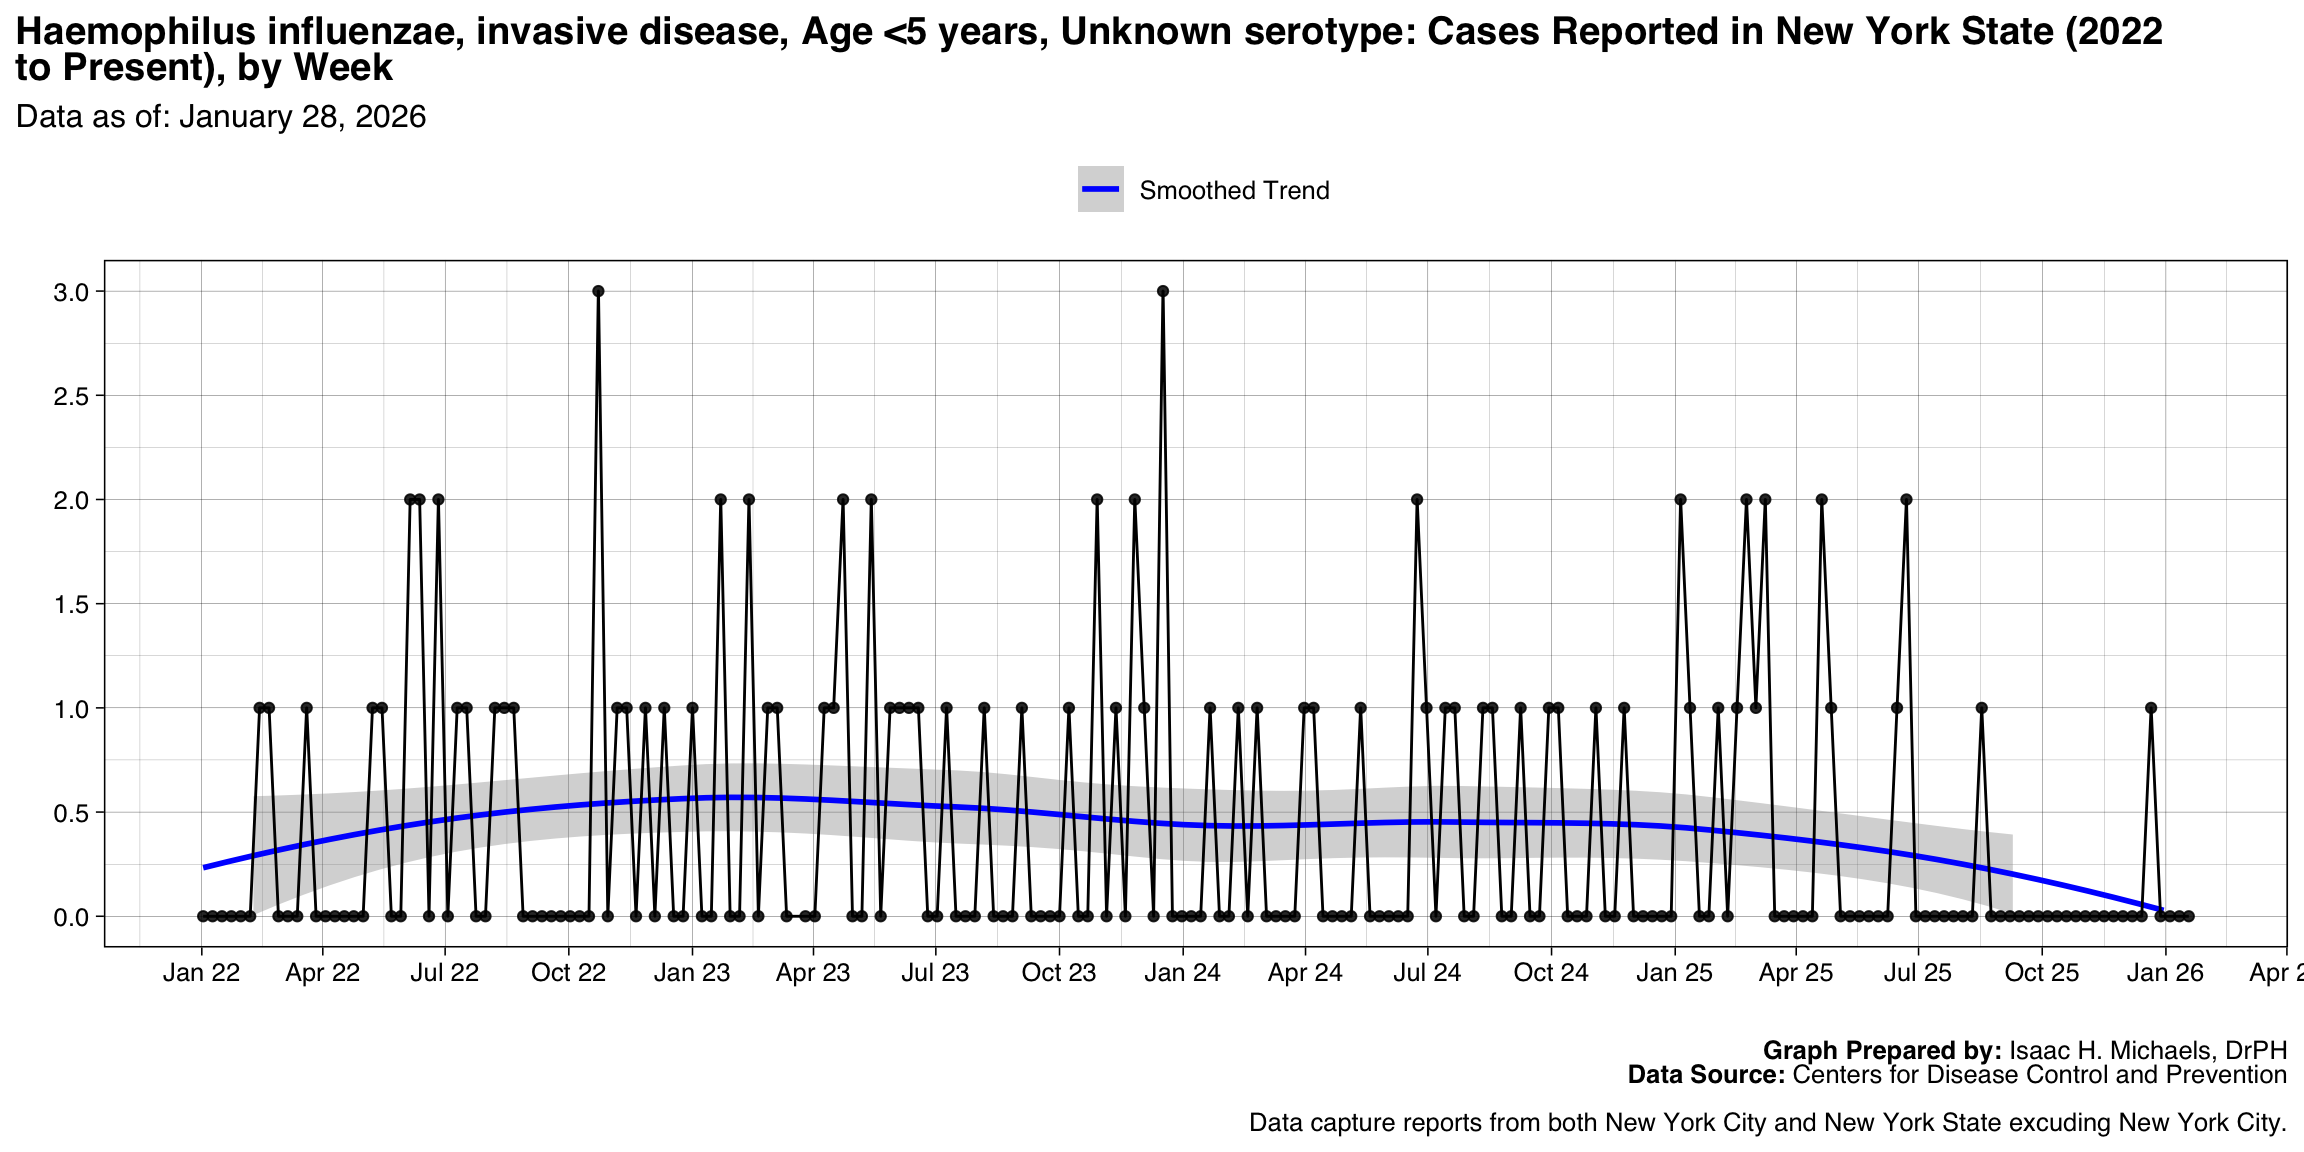
- Haemophilus influenzae, invasive disease, Age <5 years, Unknown serotype
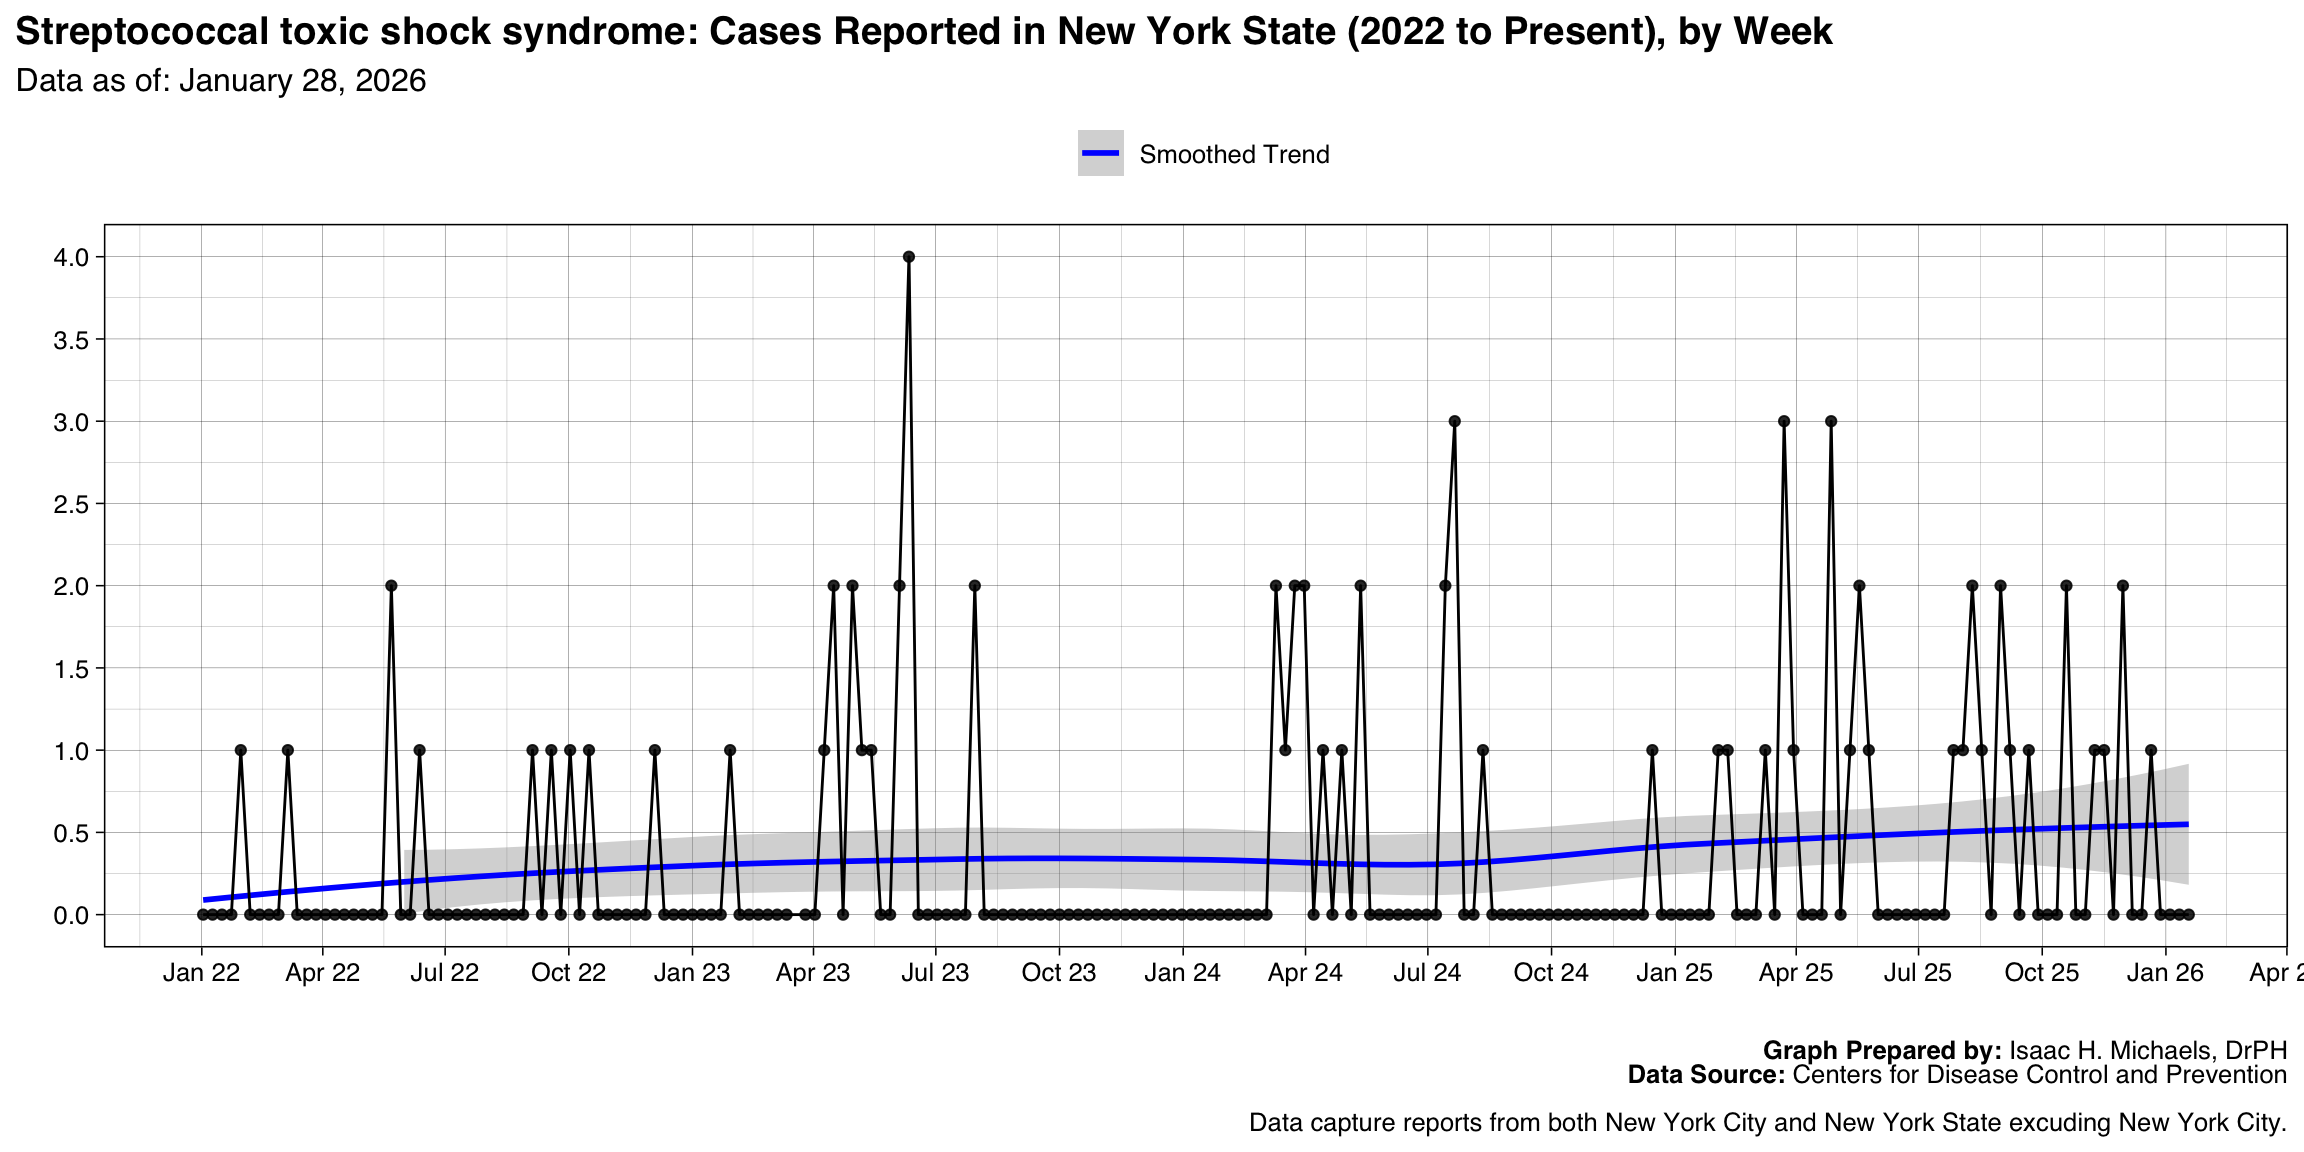
- Streptococcal toxic shock syndrome
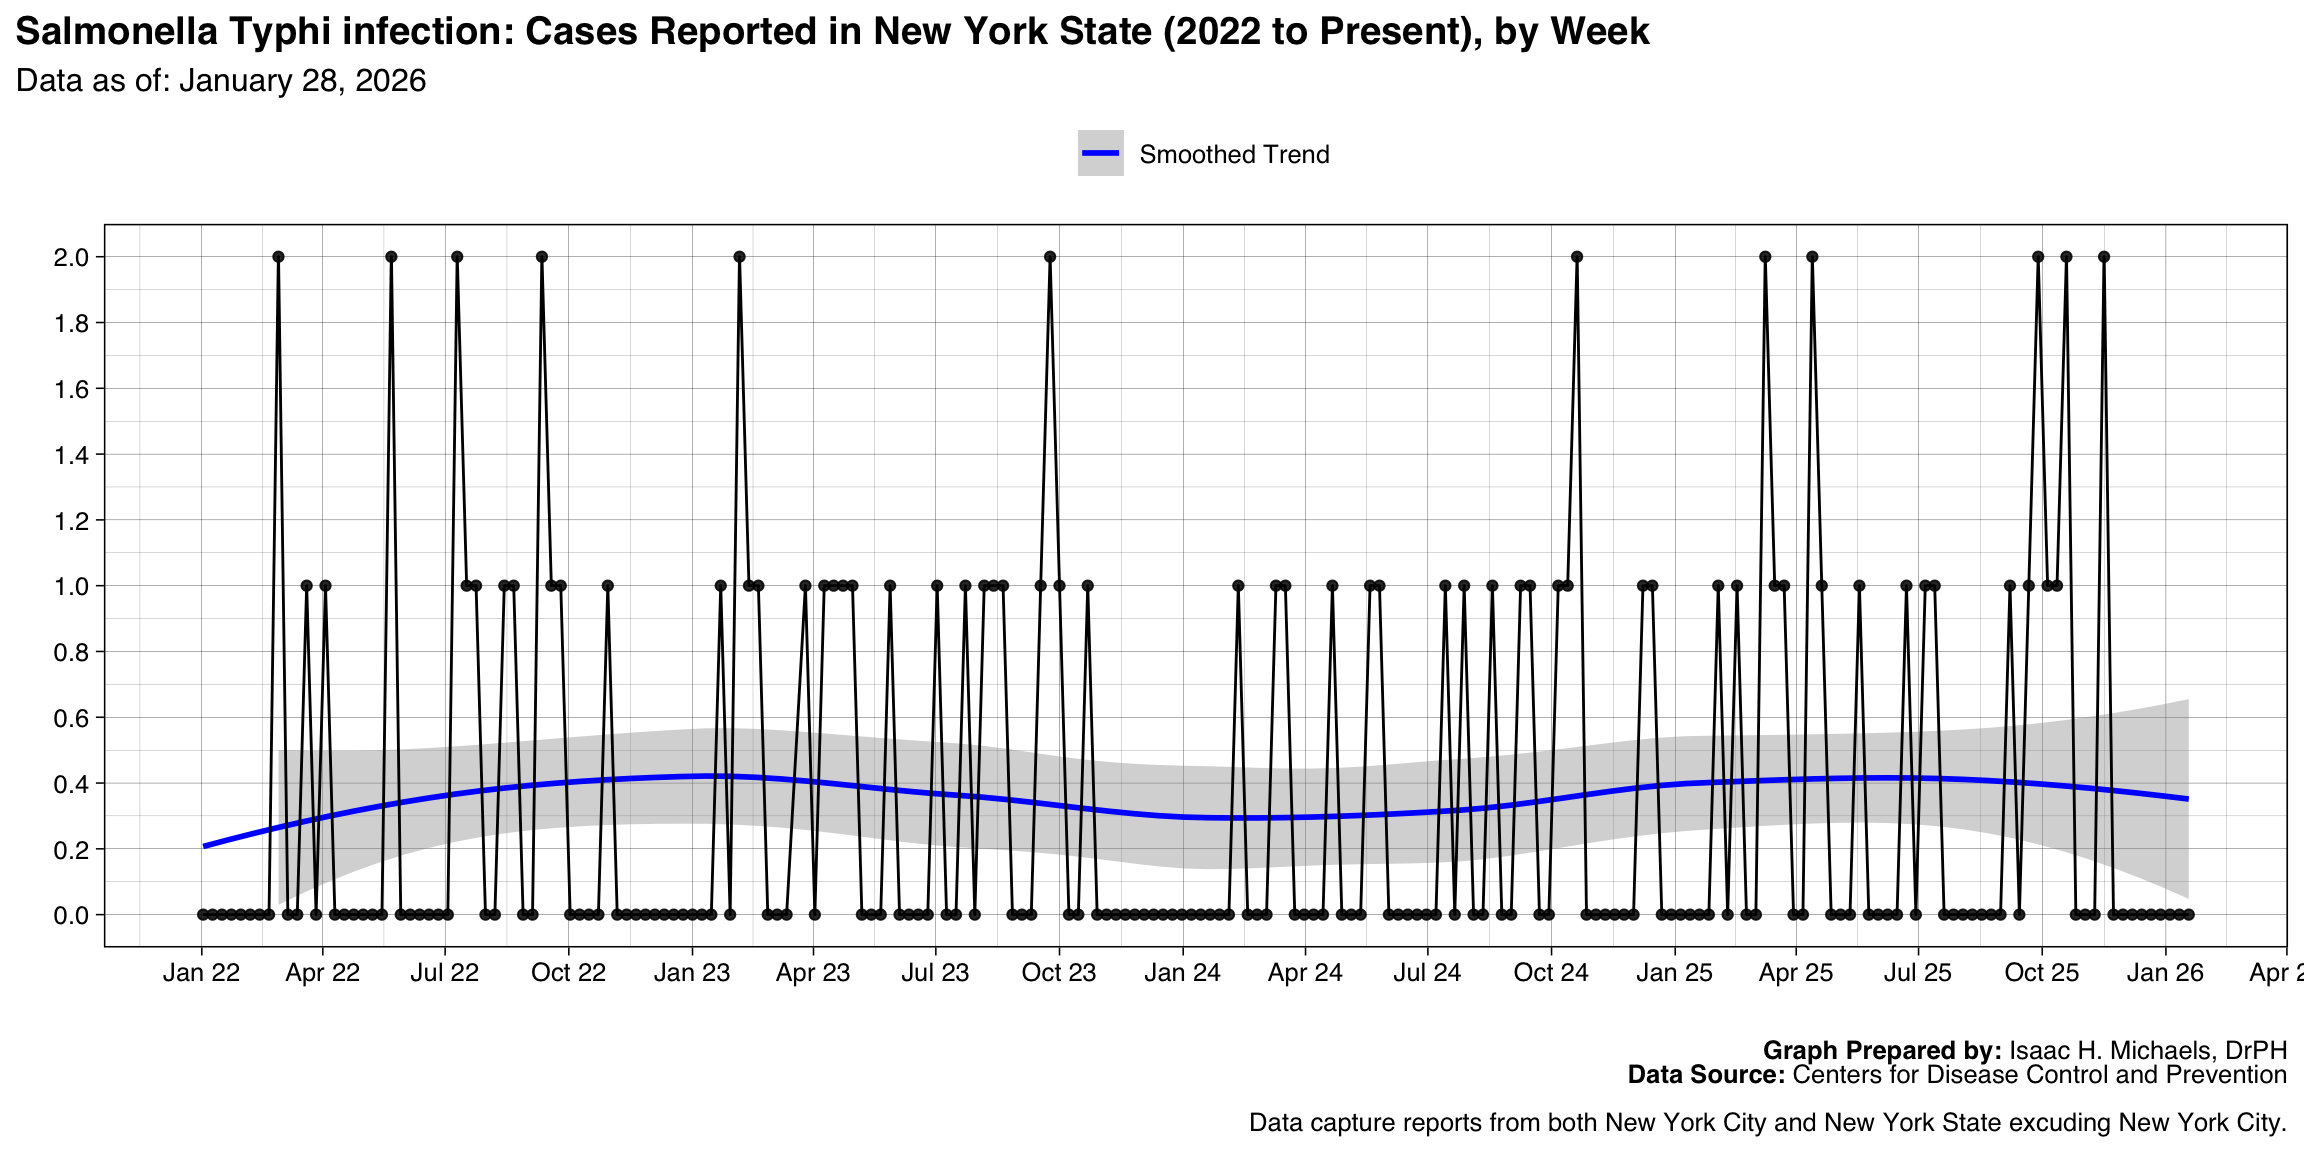
- Salmonella Typhi infection
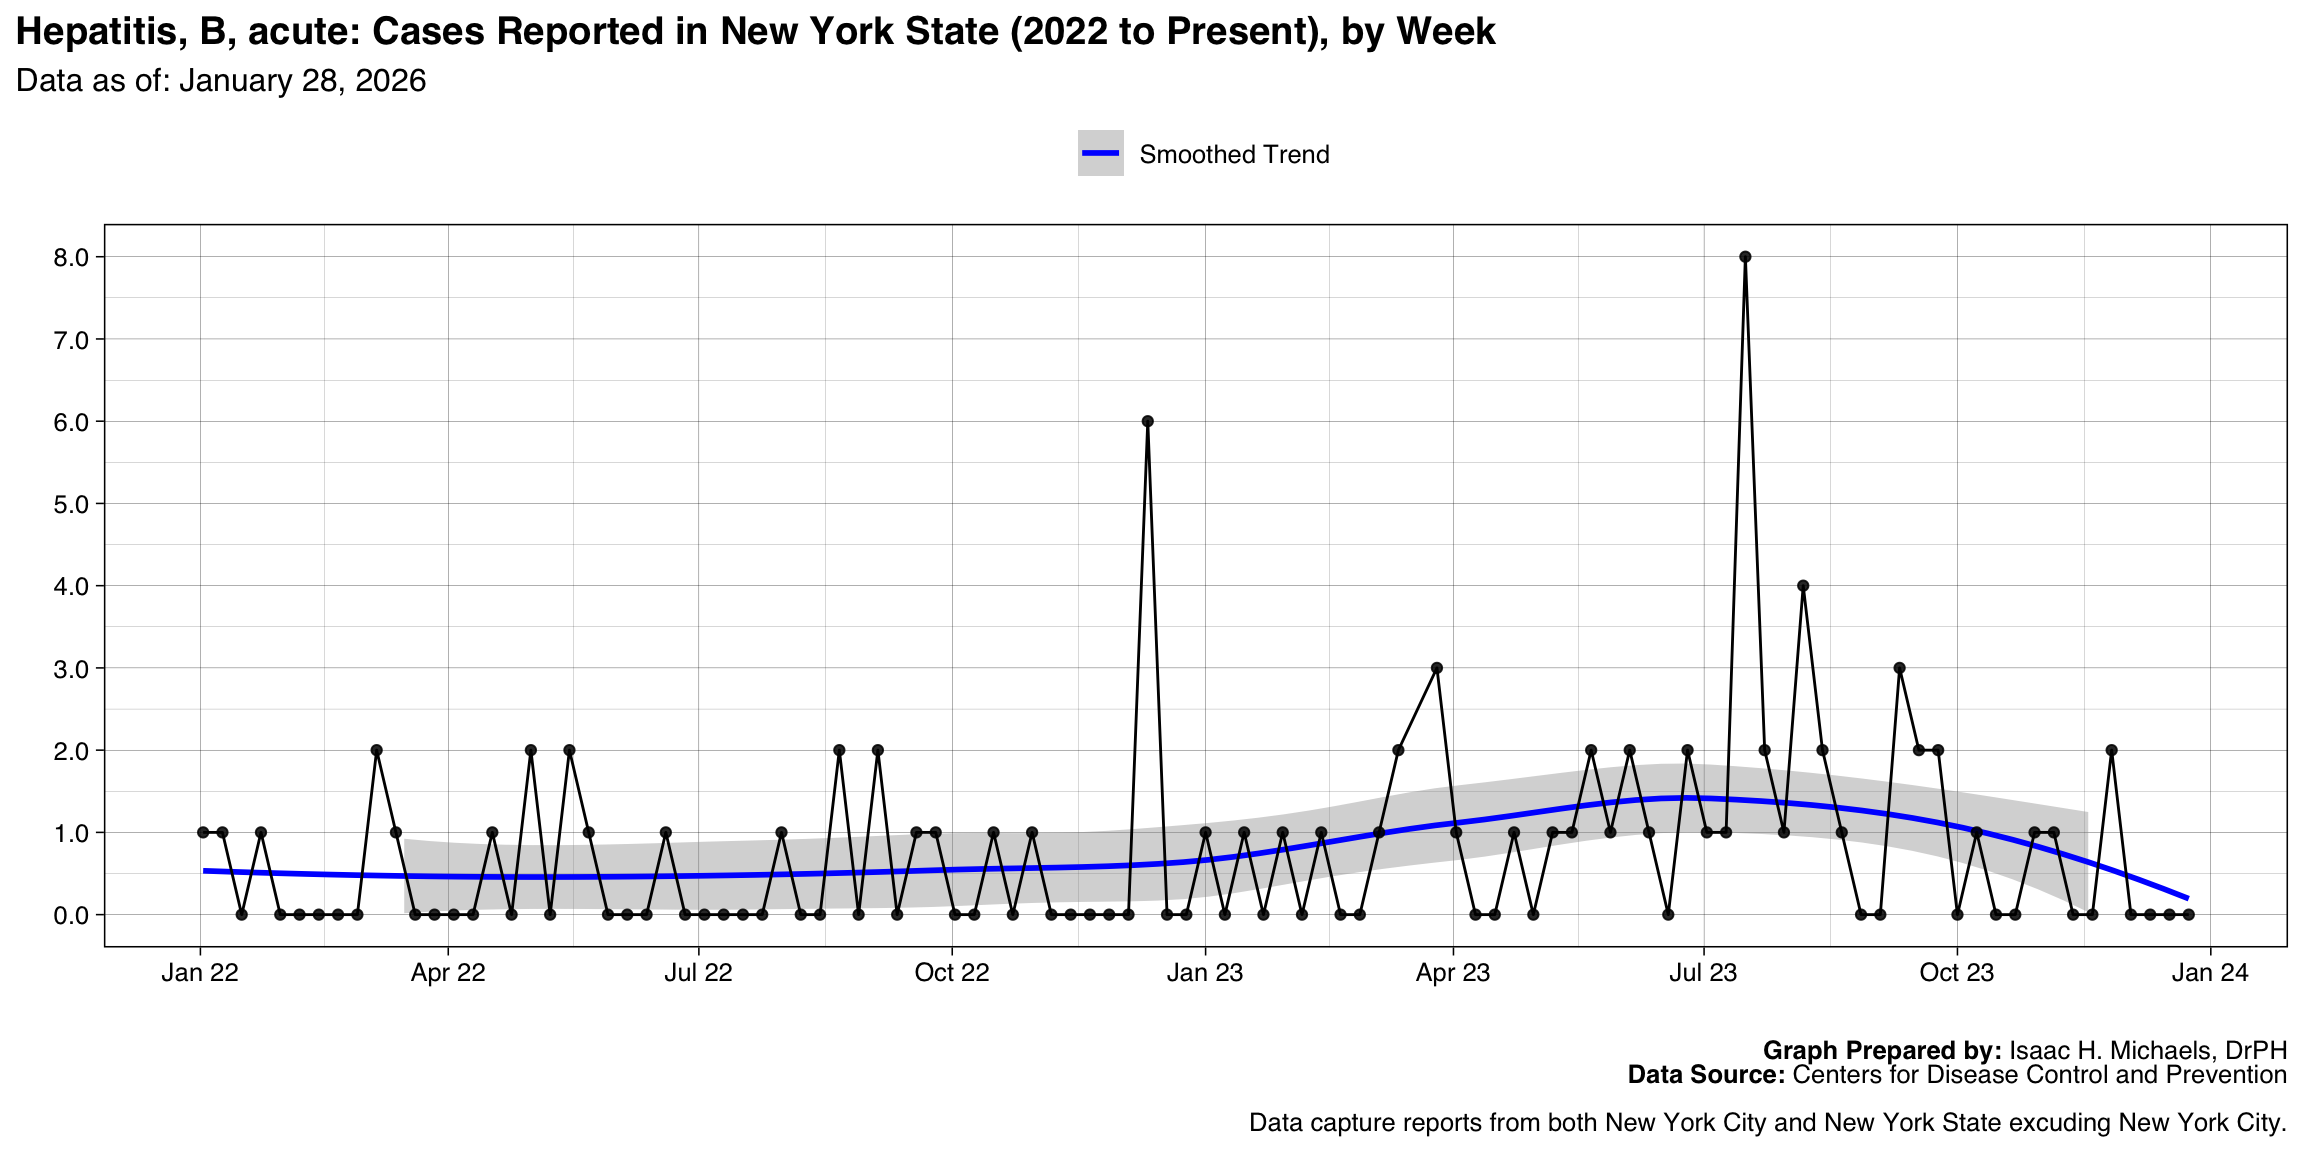
- Hepatitis, B, acute
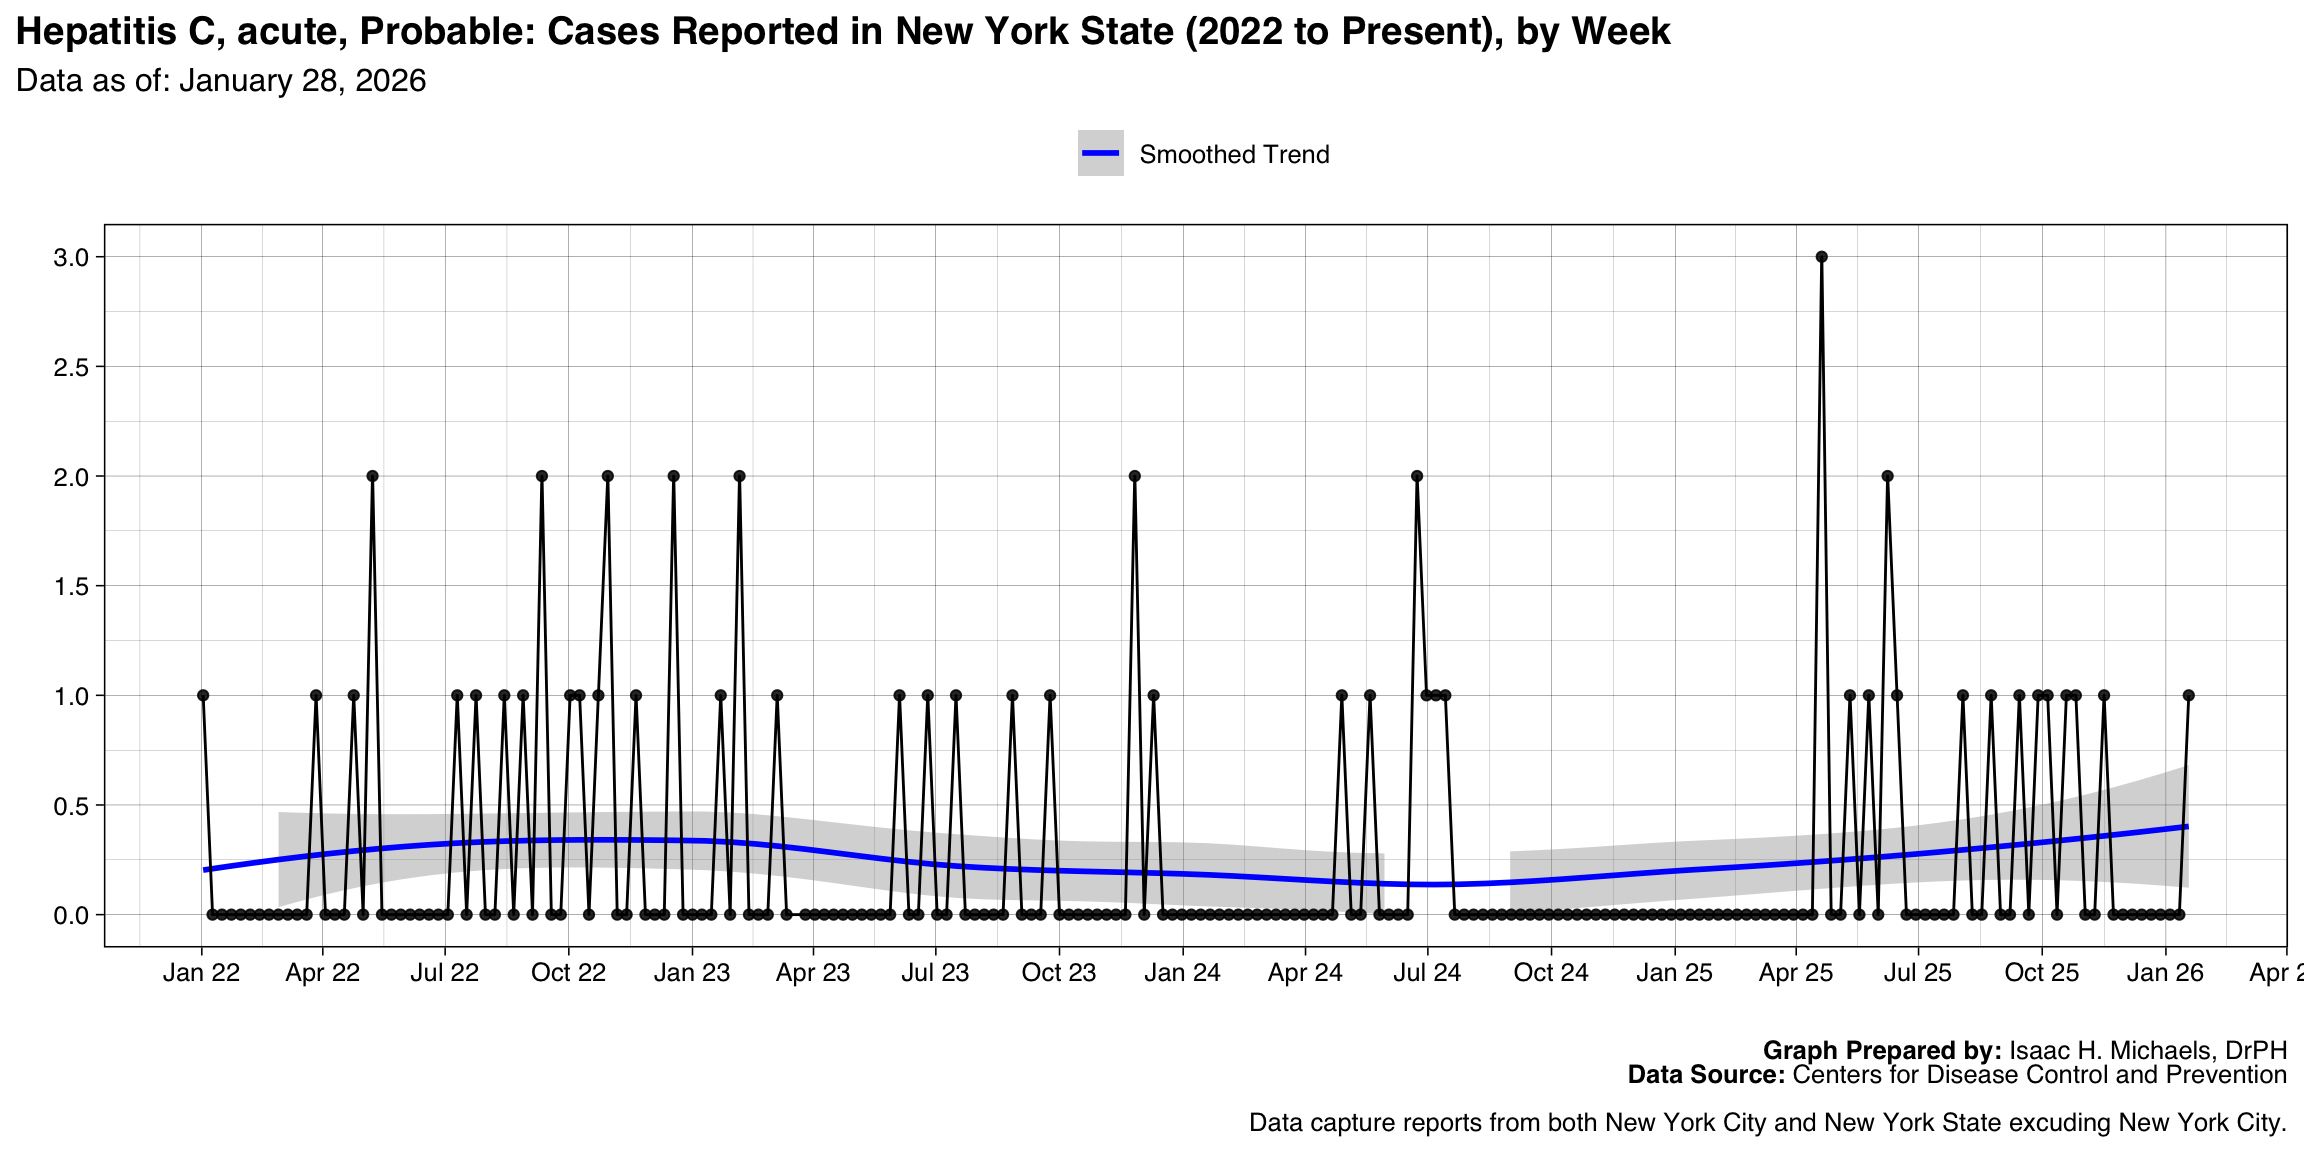
- Hepatitis C, acute, Probable
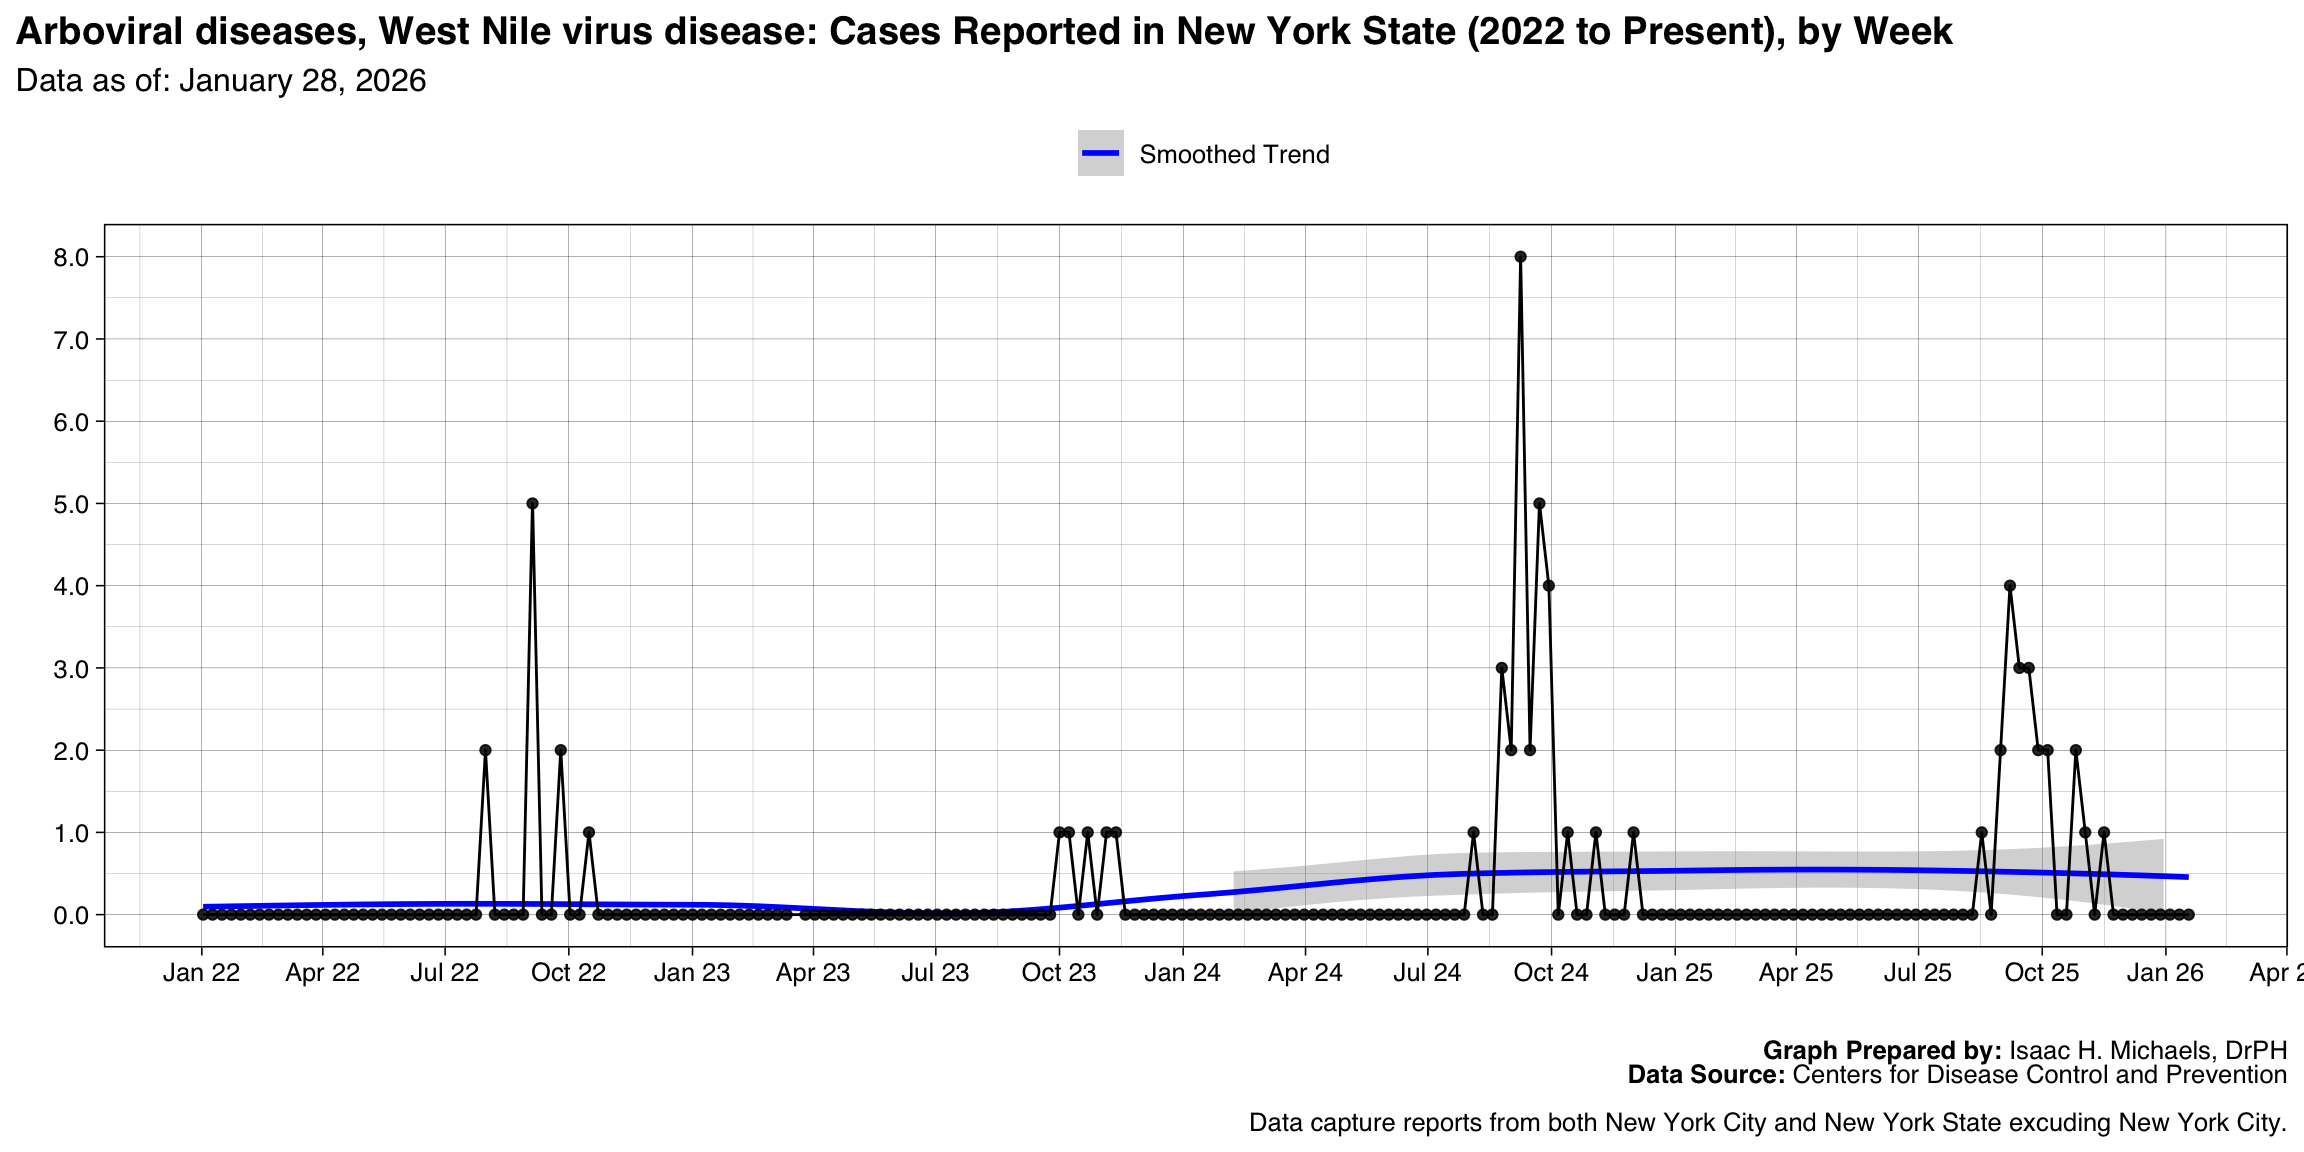
- Arboviral diseases, West Nile virus disease
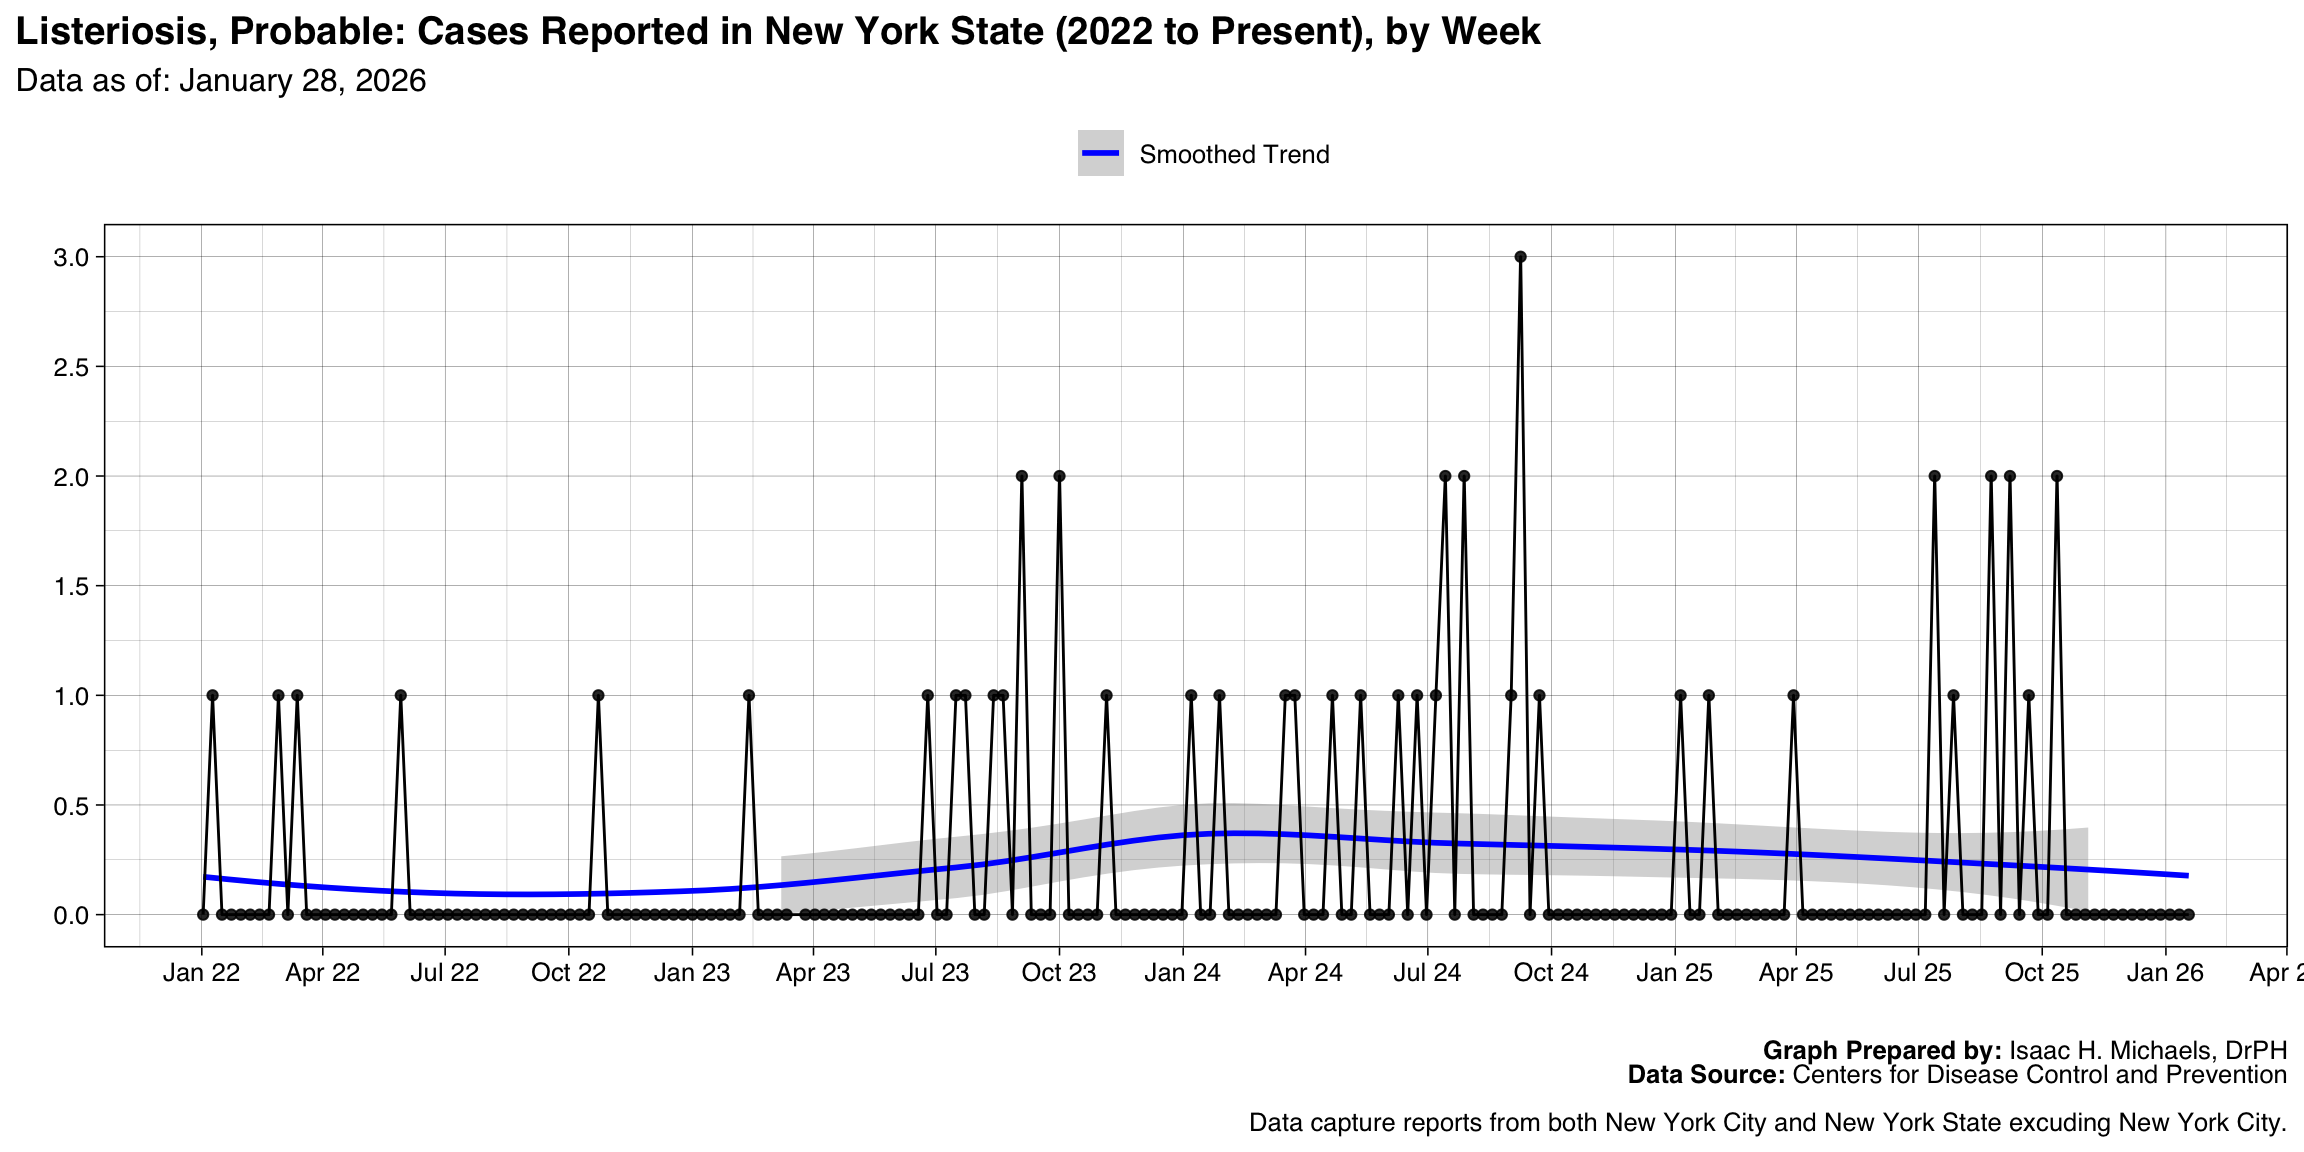
- Listeriosis, Probable
- Mumps
- Influenza-associated pediatric mortality
- Hepatitis B, acute, Probable
- Leptospirosis
- Measles, Indigenous
- Q fever, Total
- Vancomycin-intermediate Staphylococcus aureus
- Brucellosis
- Tularemia
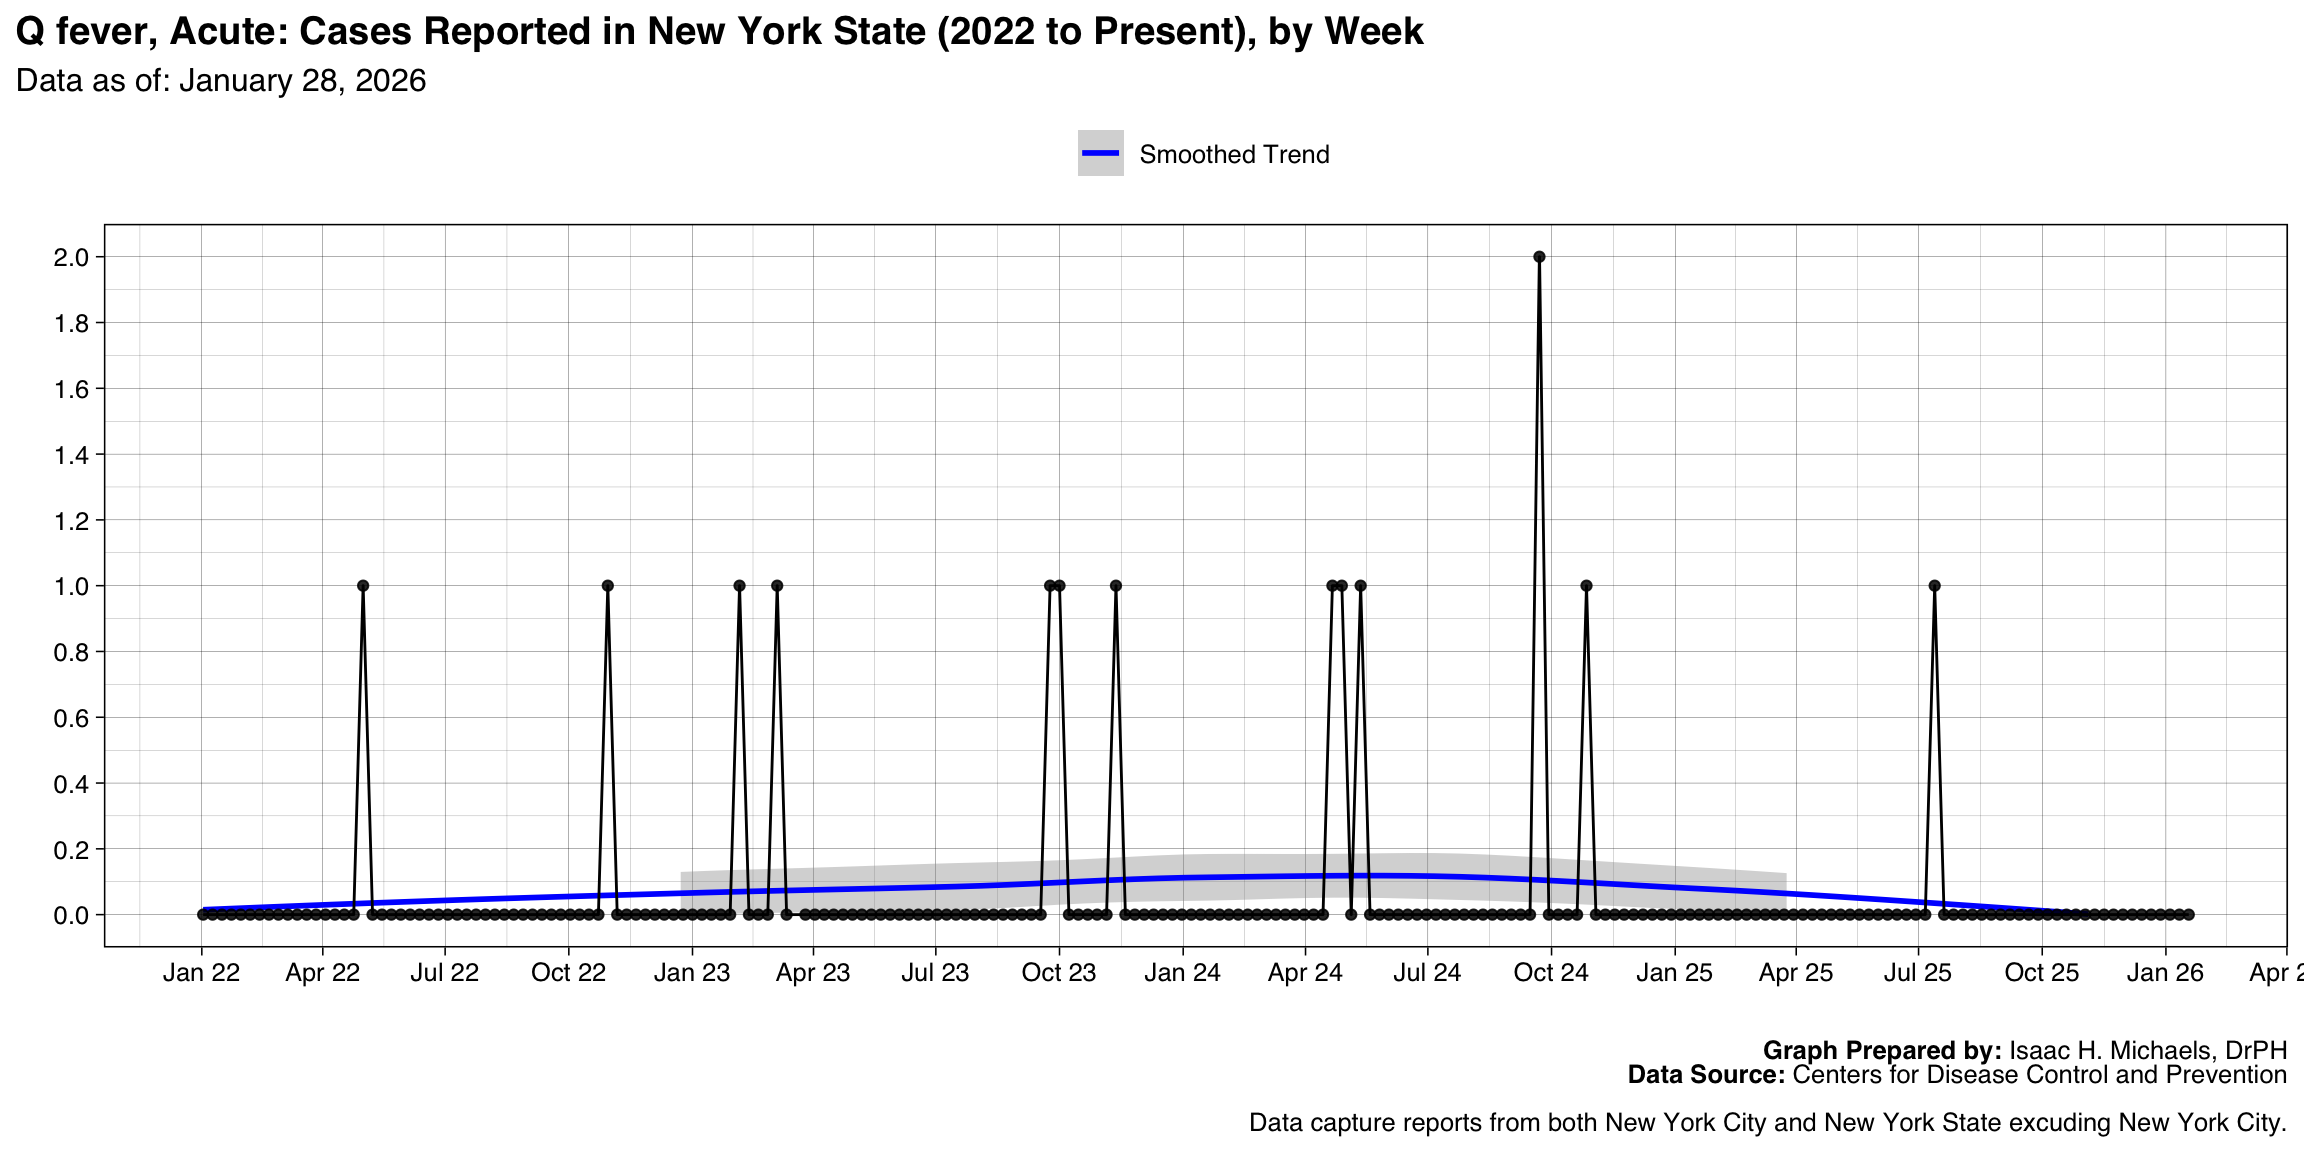
- Q fever, Acute
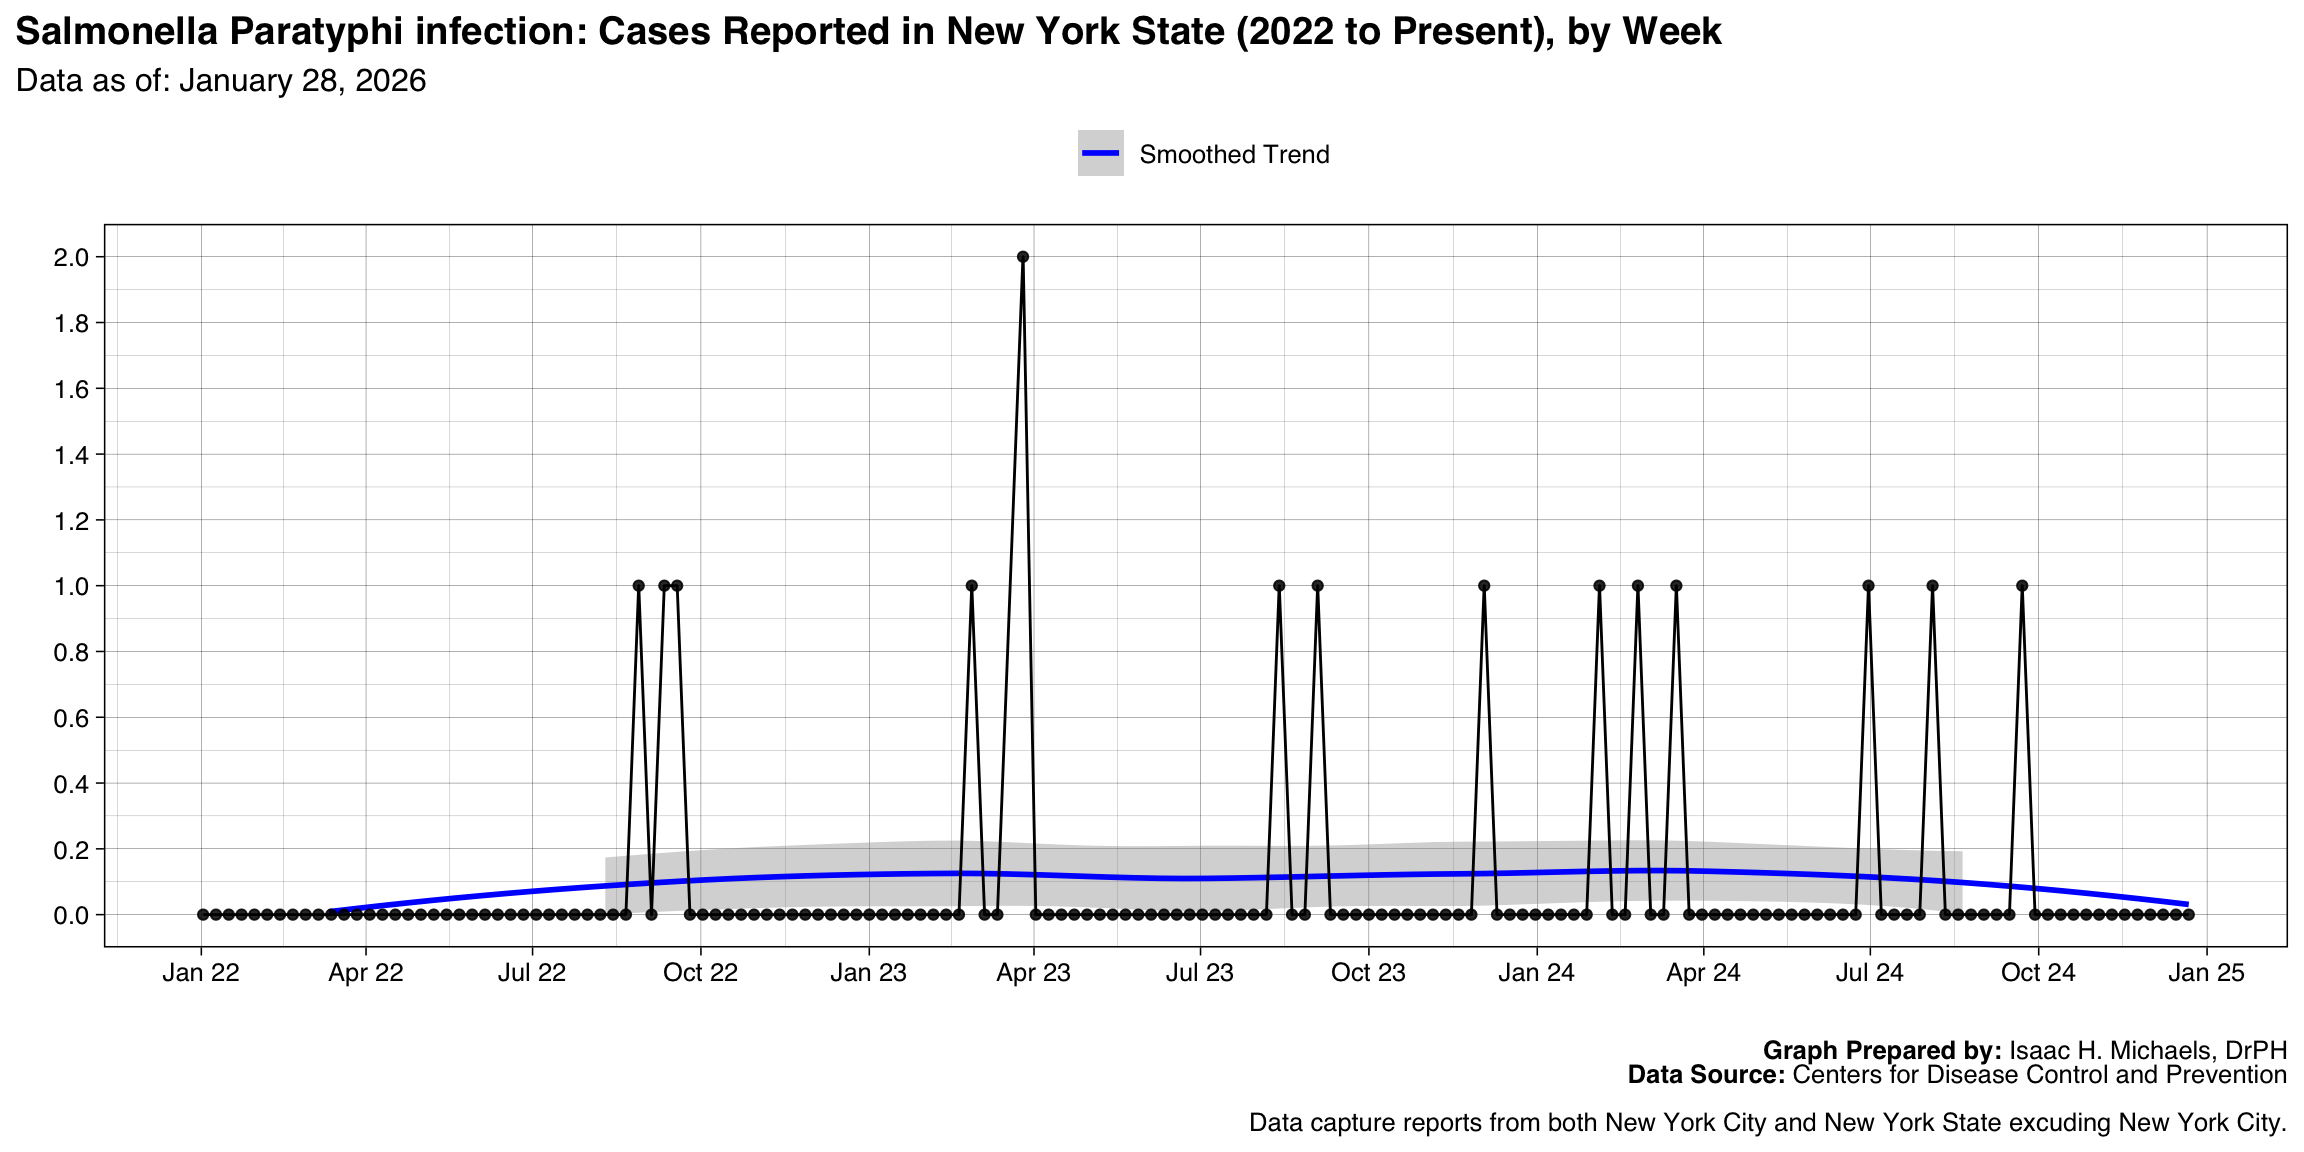
- Salmonella Paratyphi infection
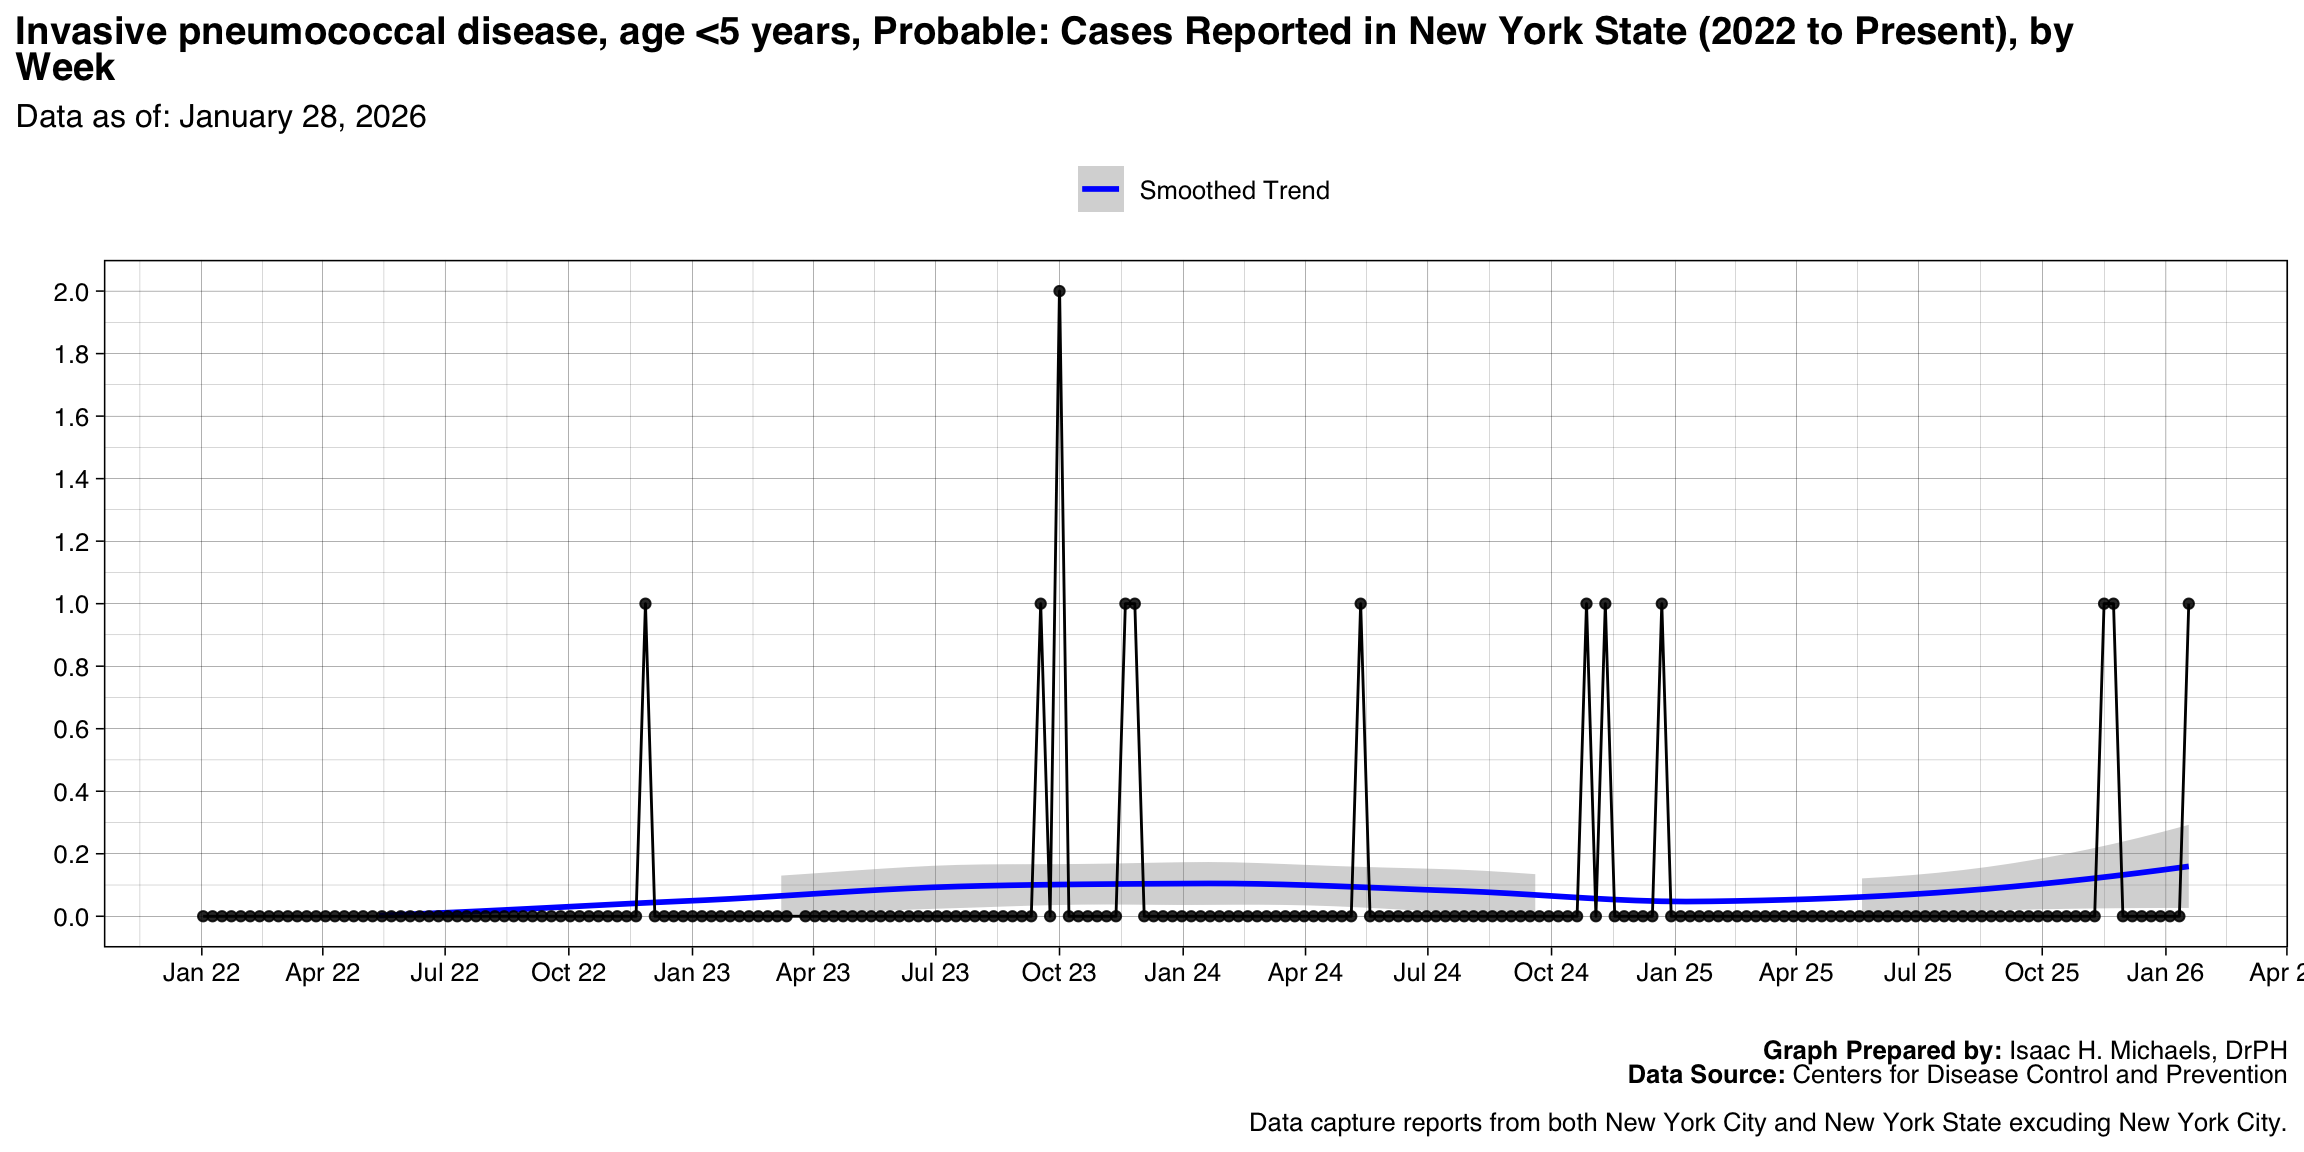
- Invasive pneumococcal disease, age <5 years, Probable
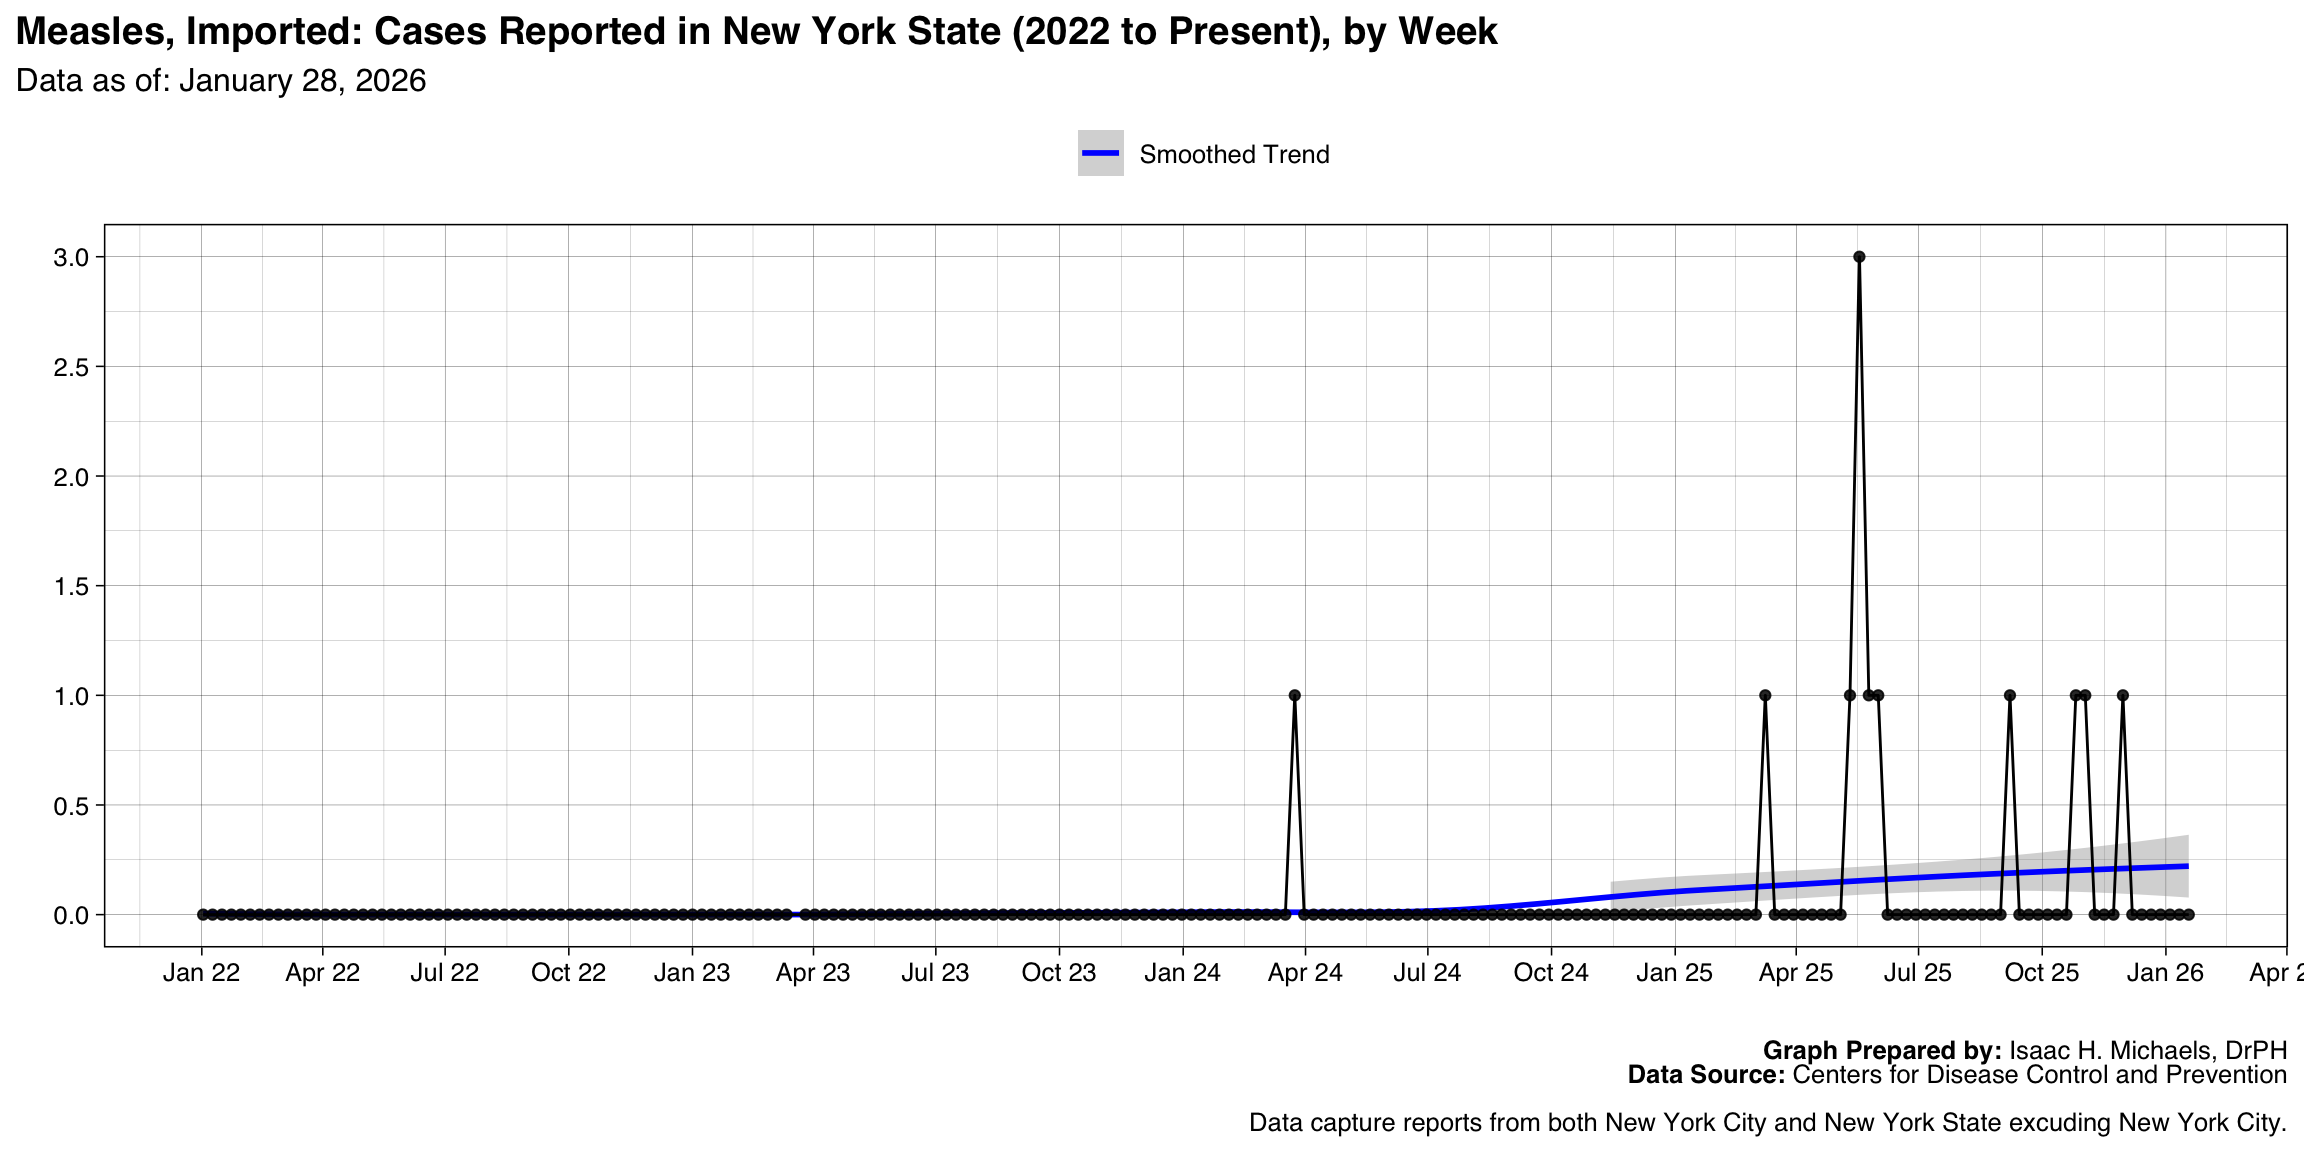
- Measles, Imported
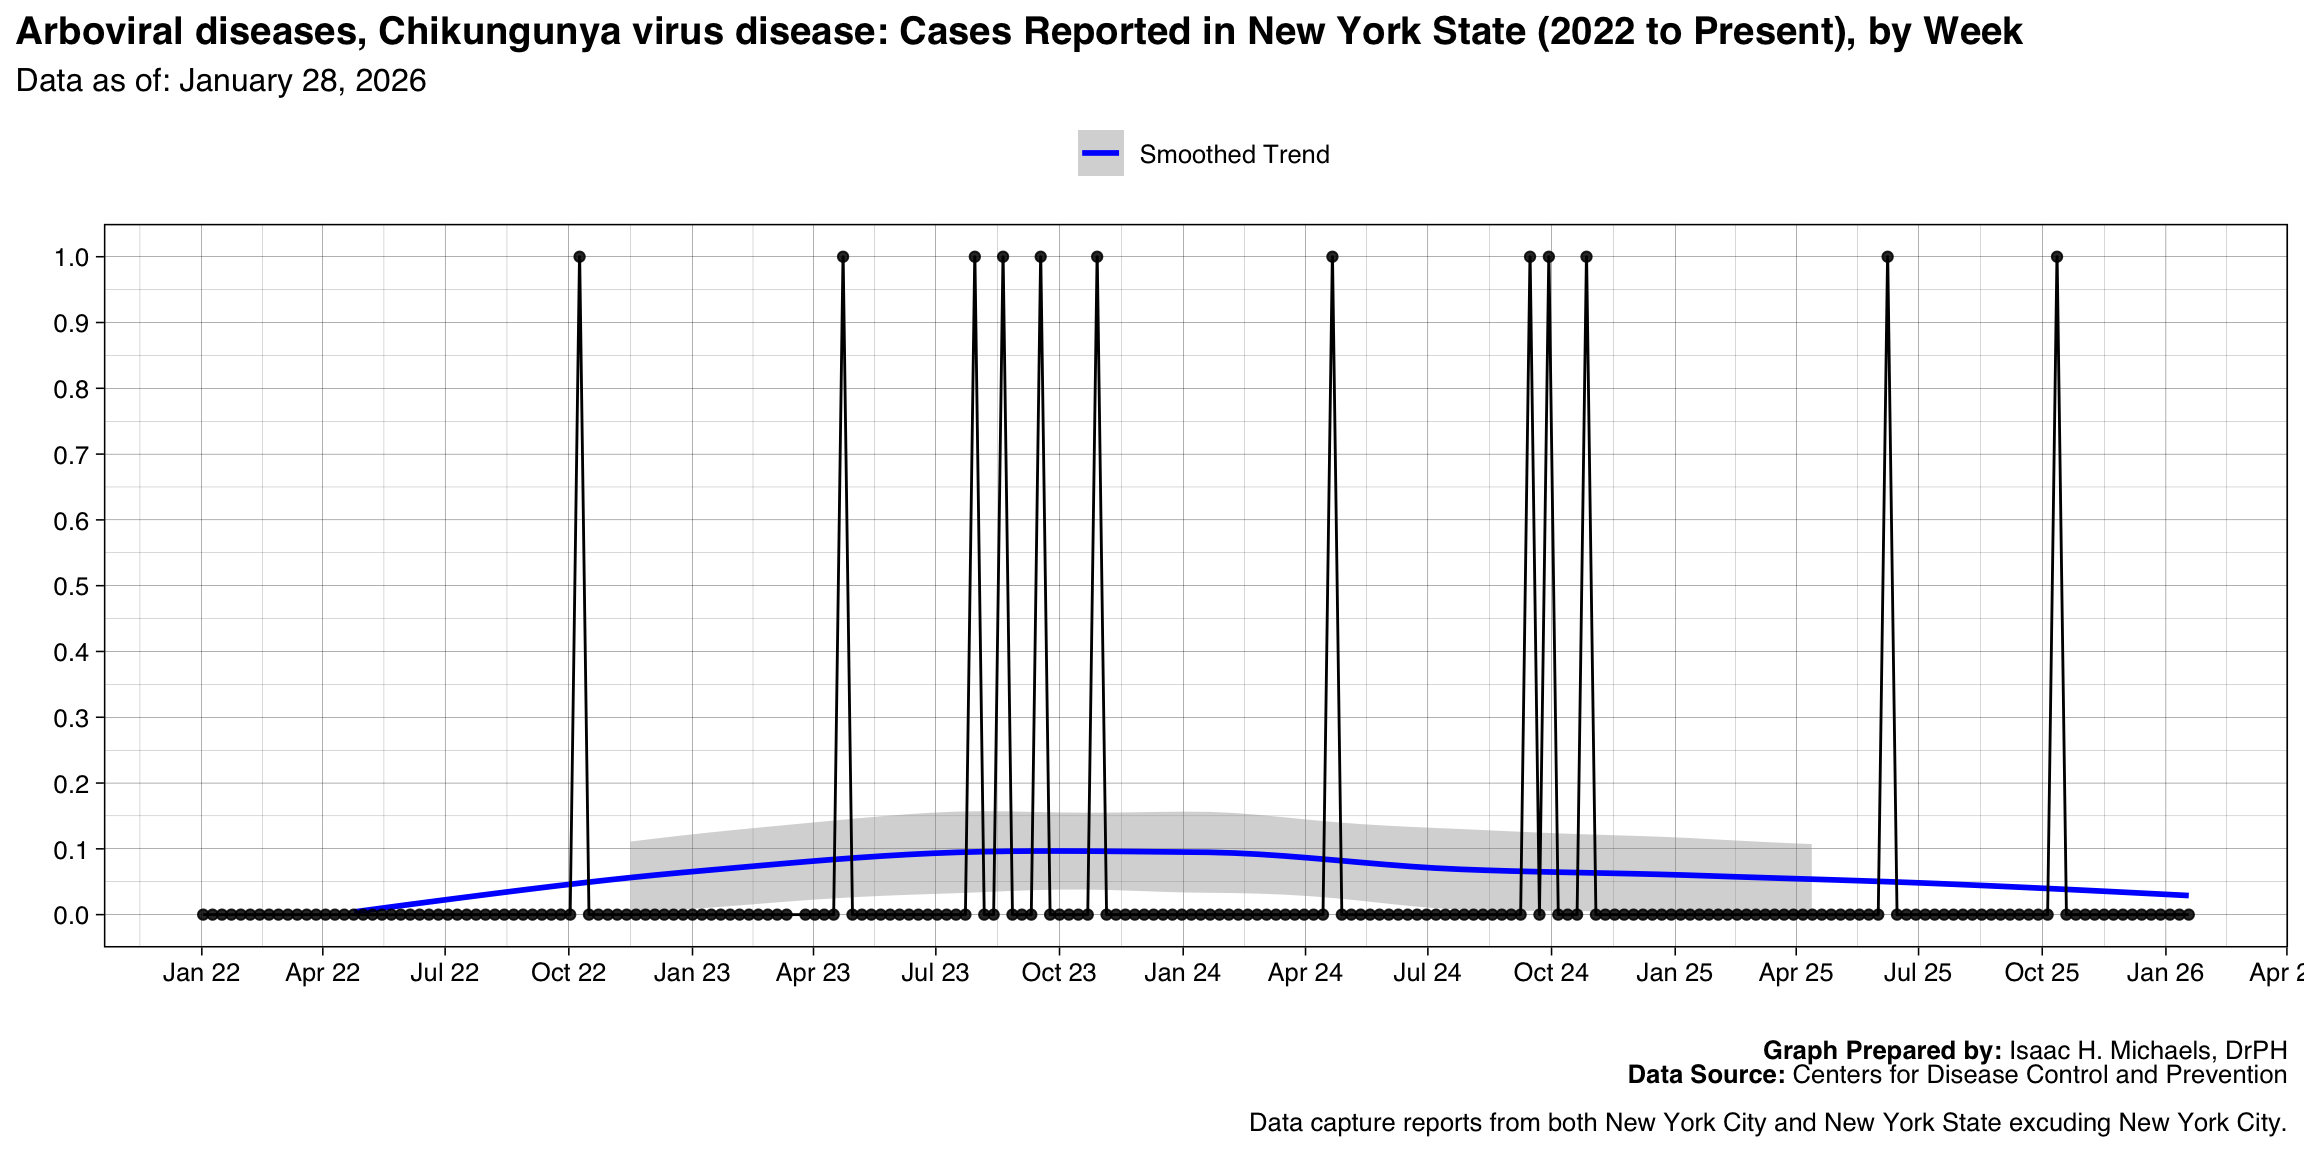
- Arboviral diseases, Chikungunya virus disease
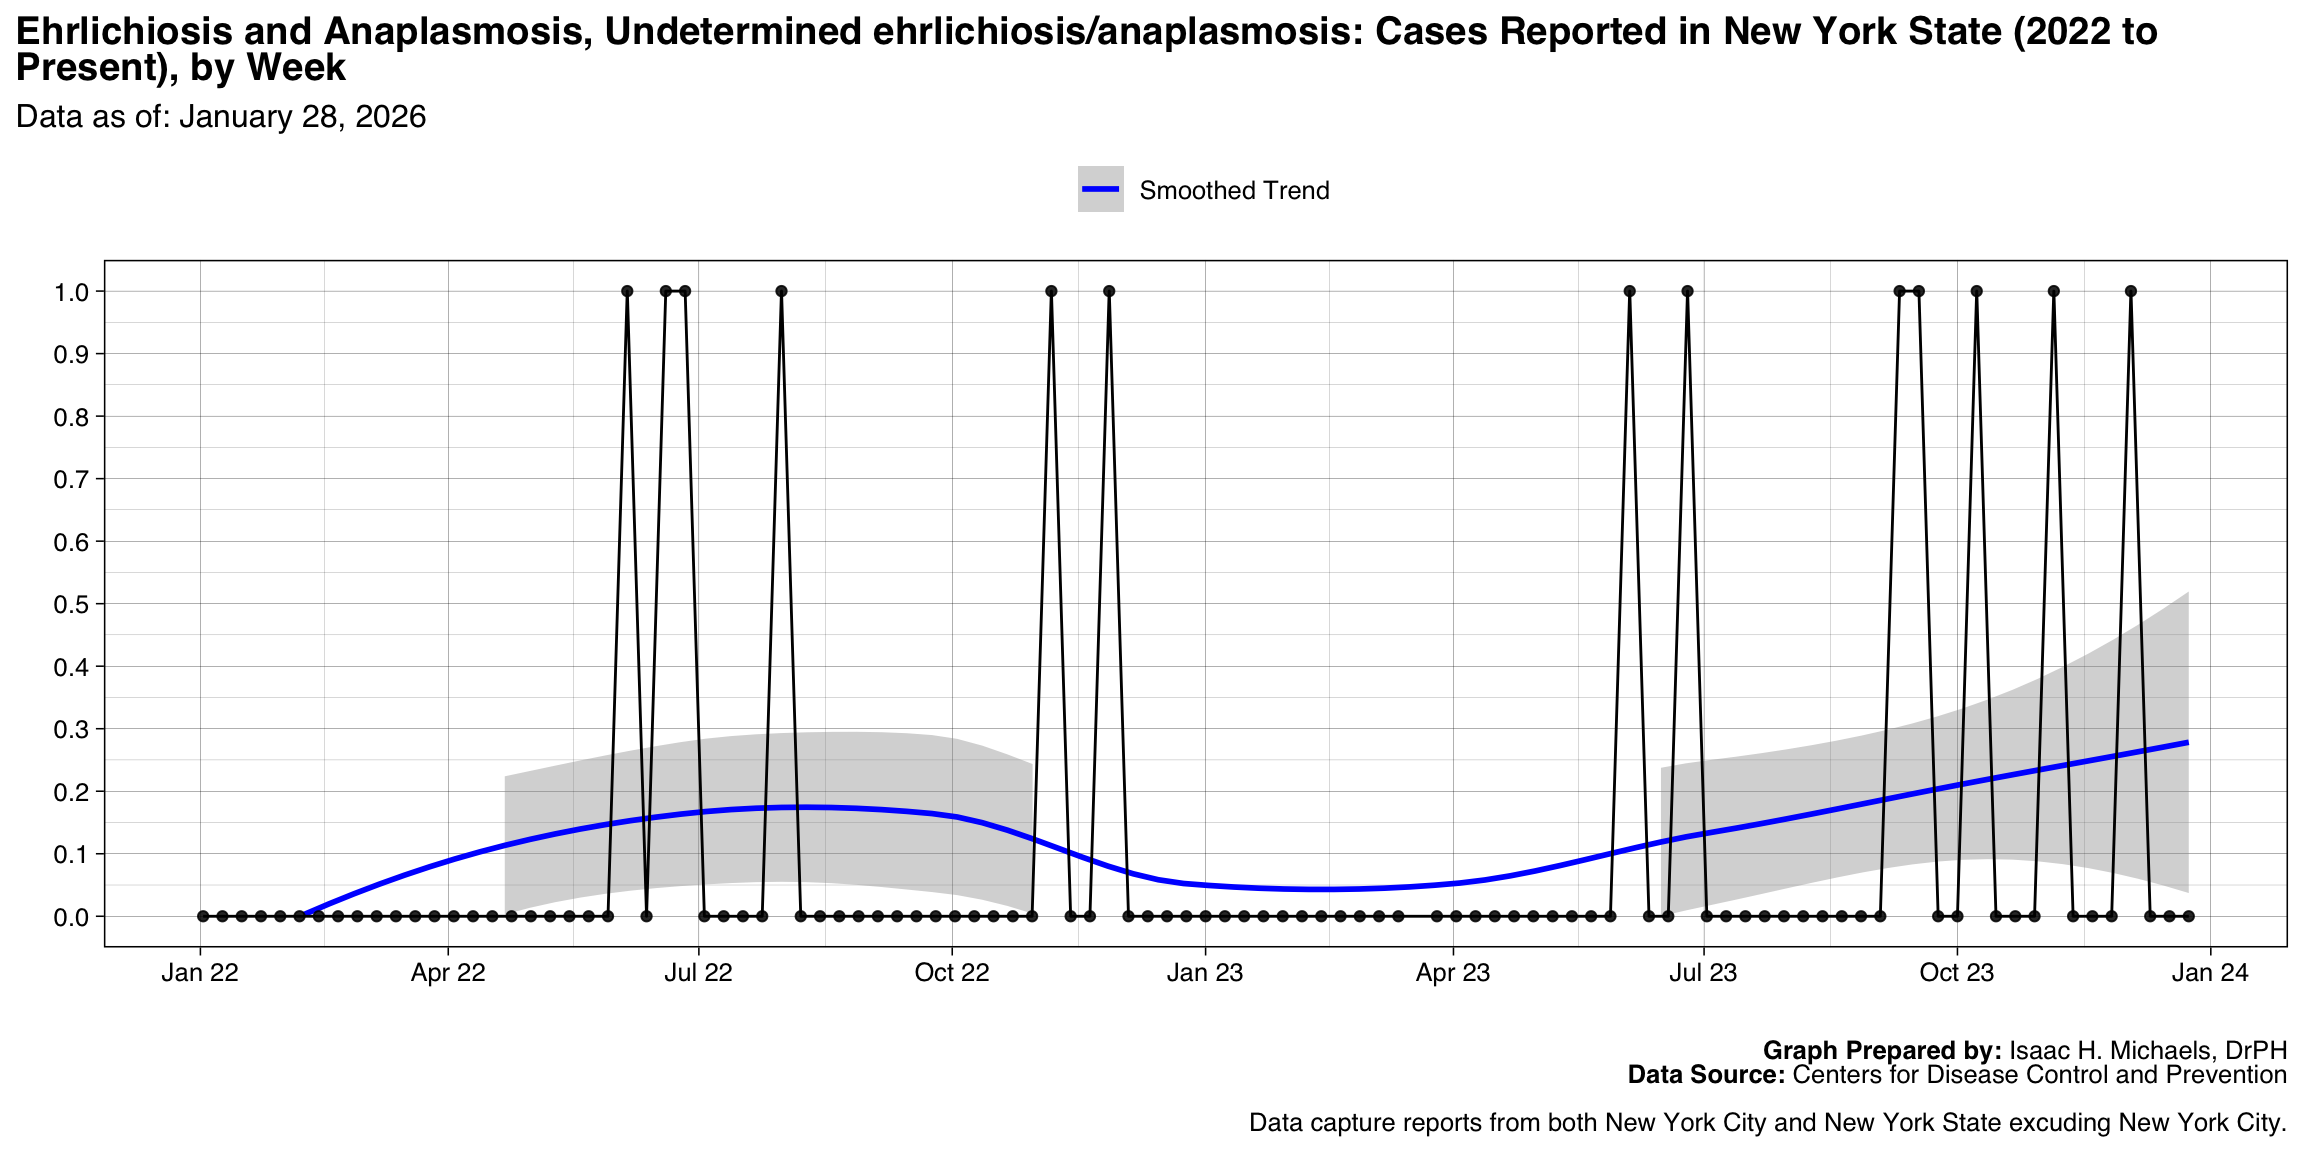
- Ehrlichiosis and Anaplasmosis, Undetermined ehrlichiosis/anaplasmosis
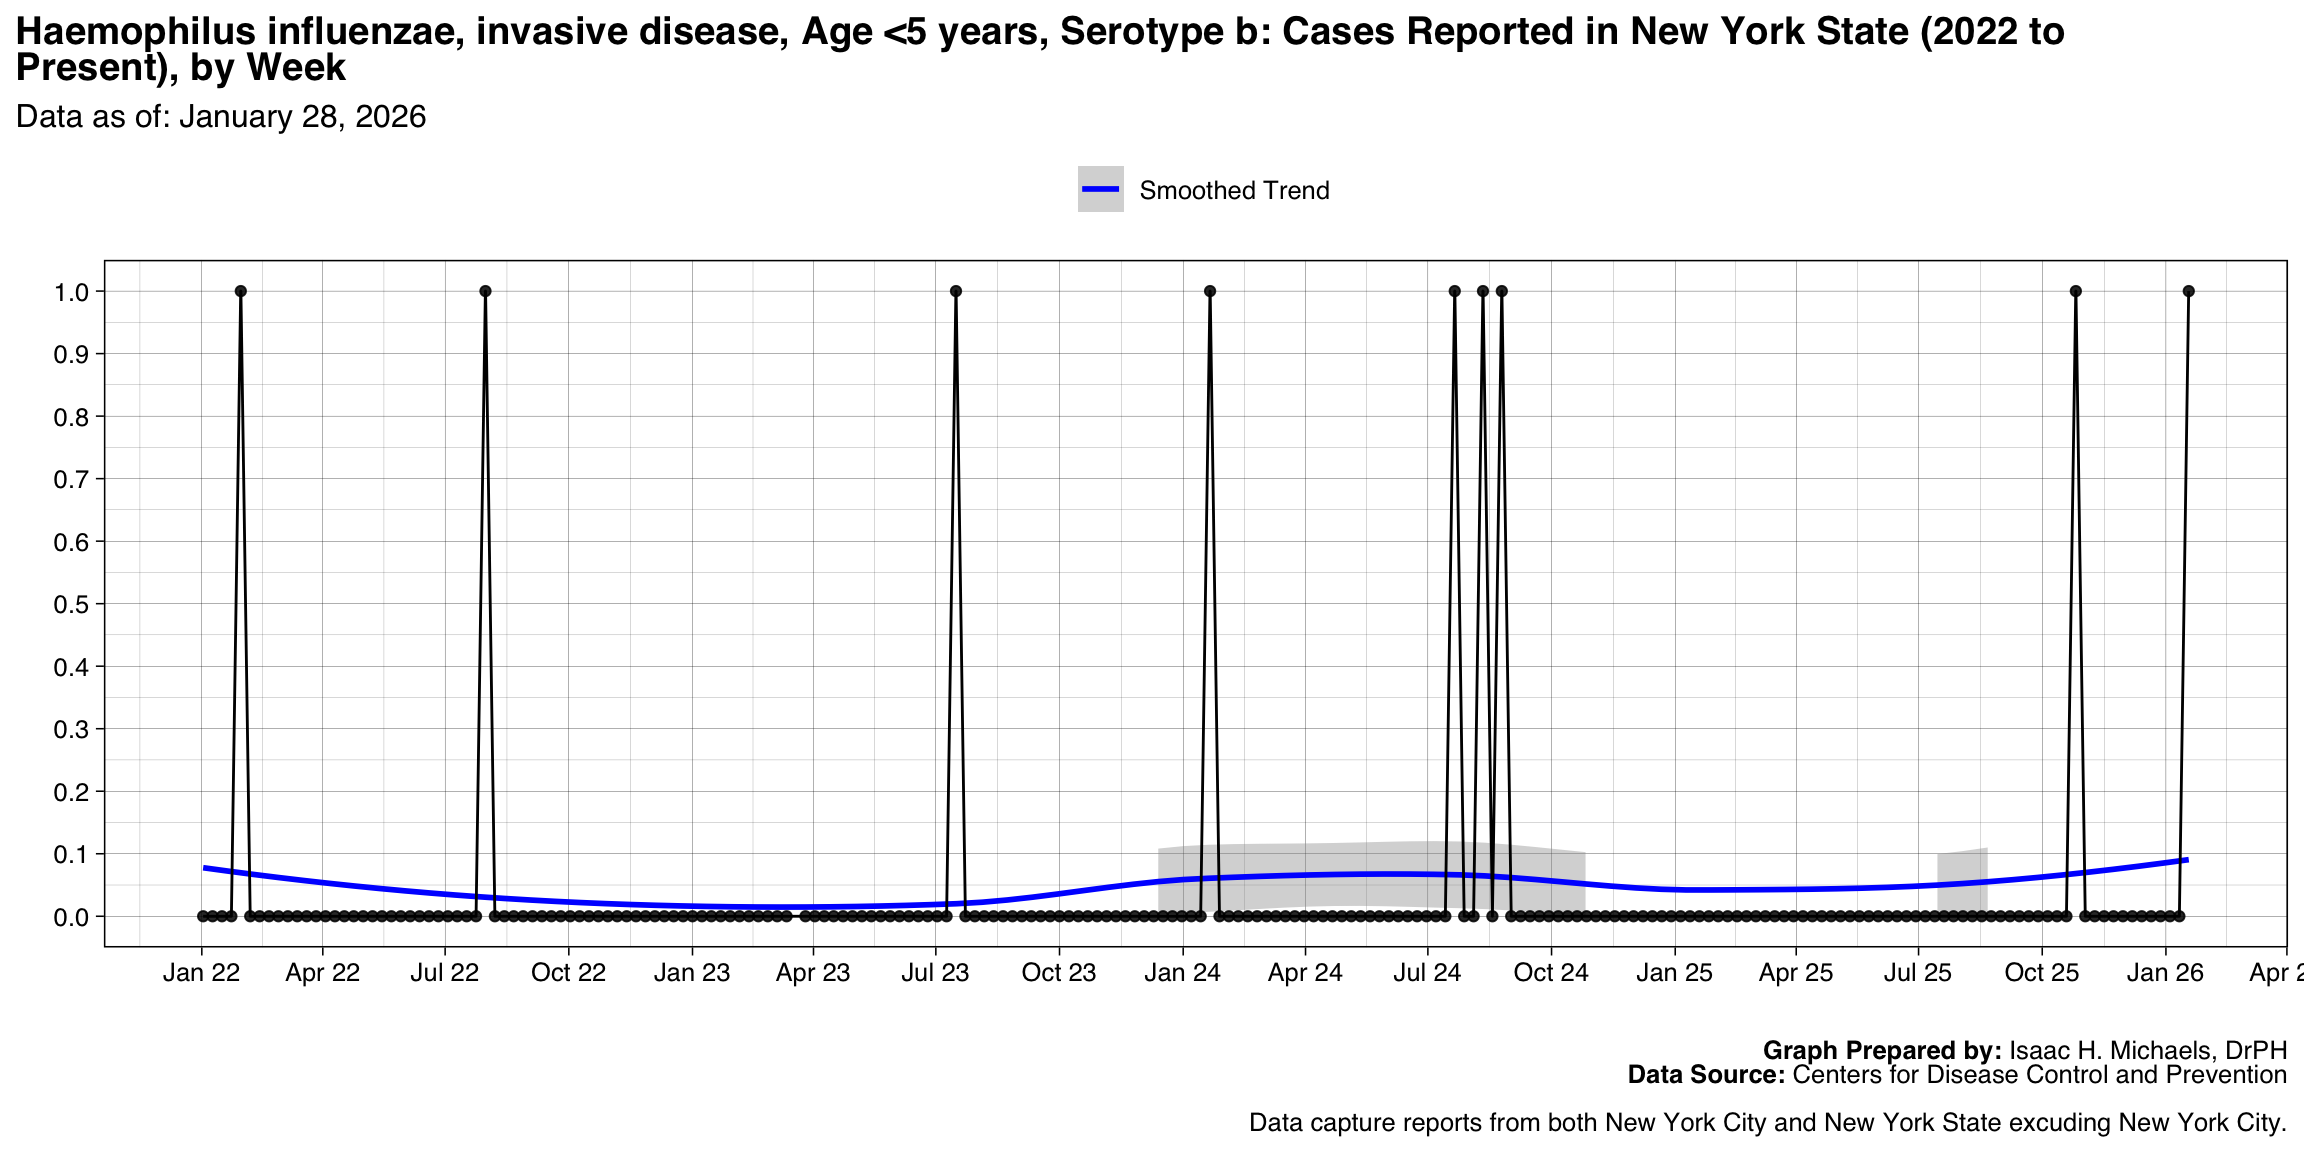
- Haemophilus influenzae, invasive disease, Age <5 years, Serotype b
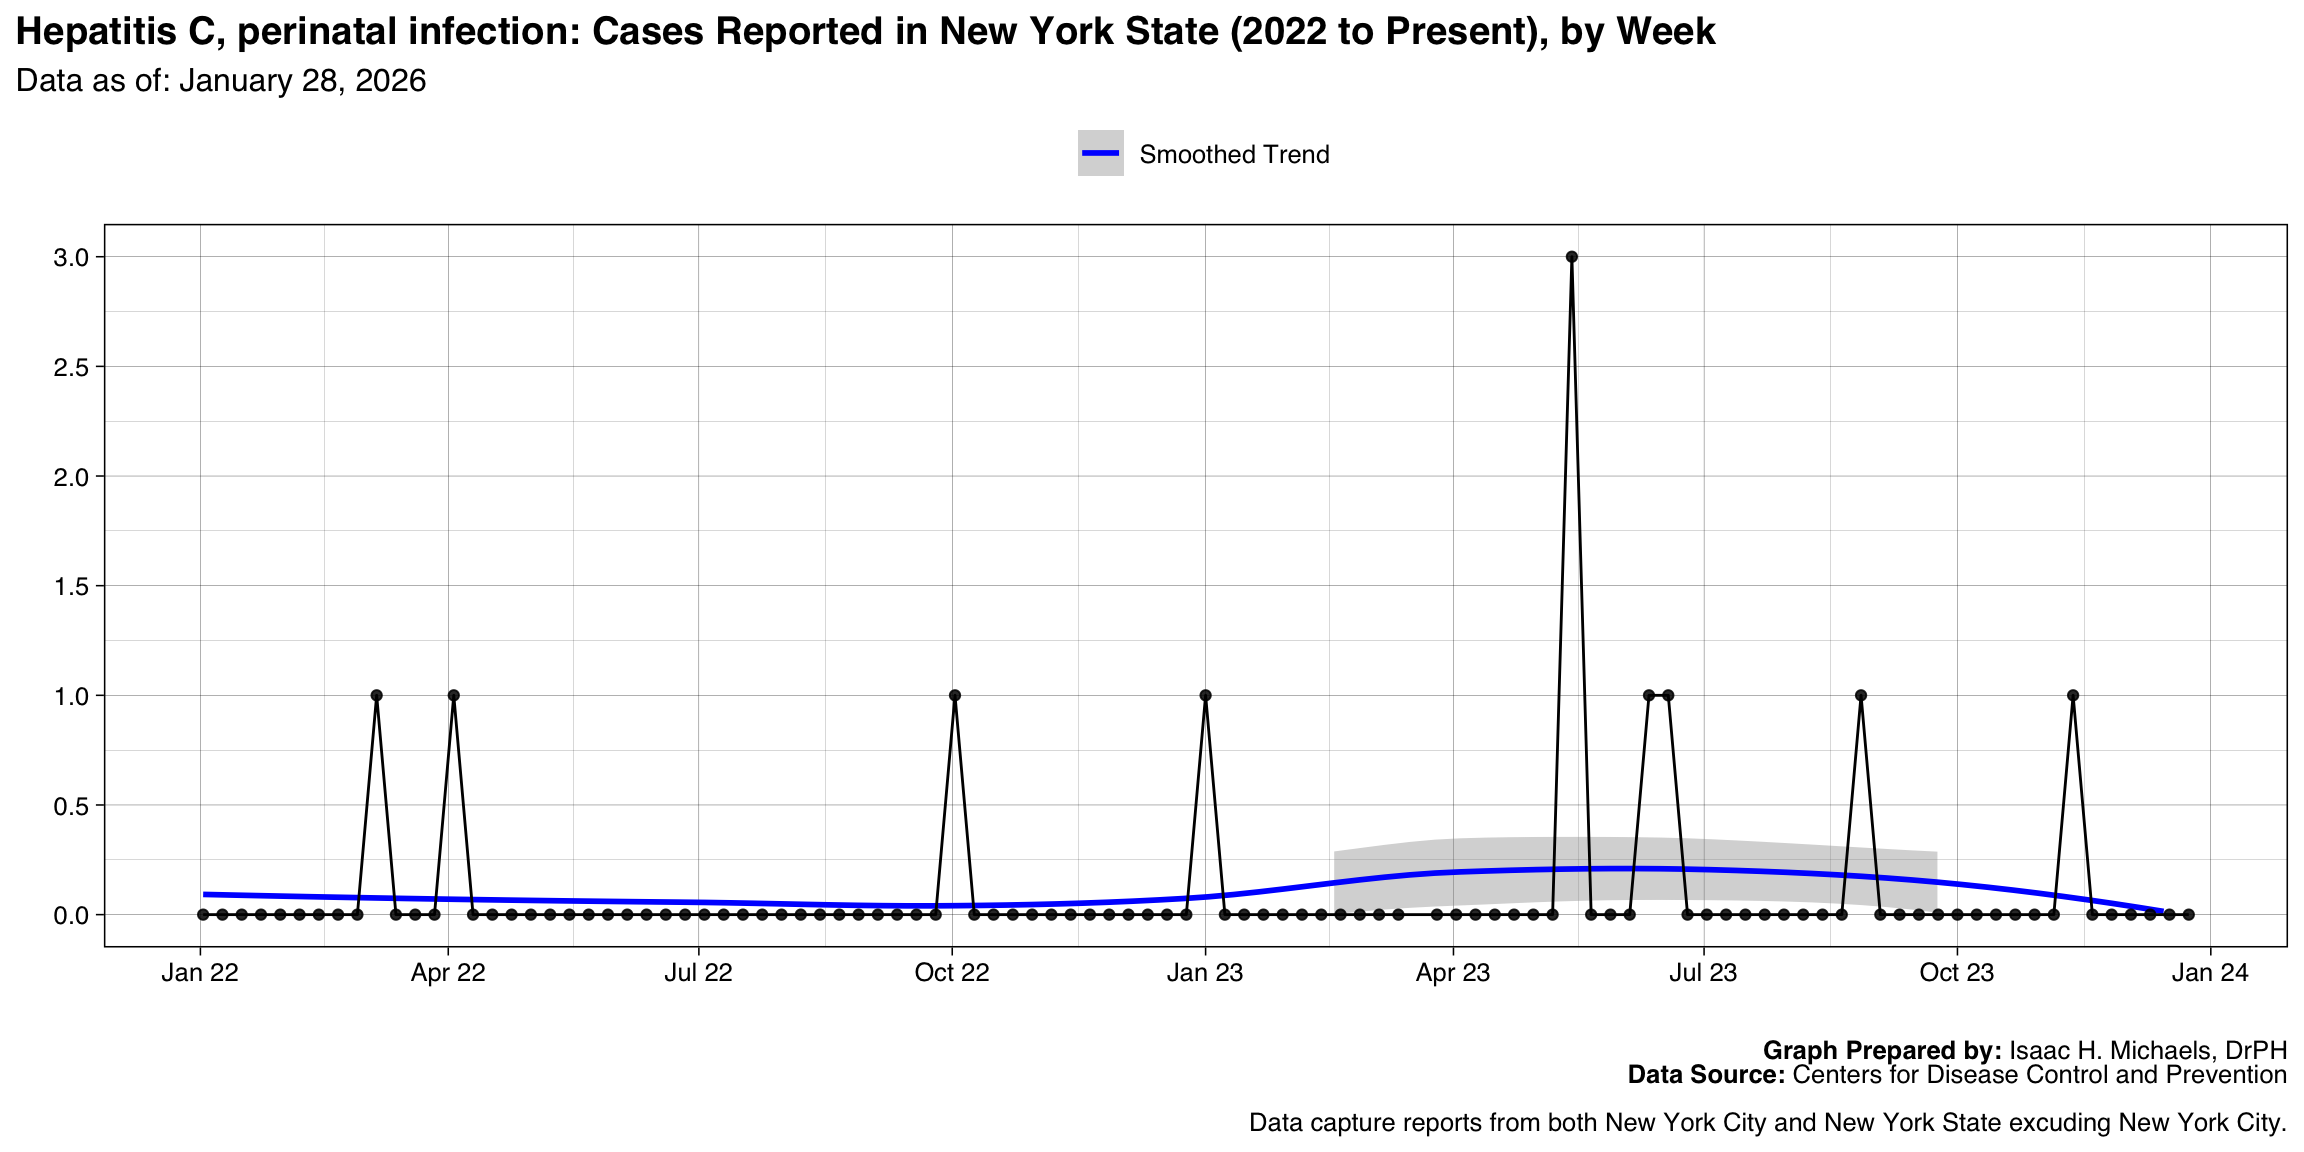
- Hepatitis C, perinatal infection
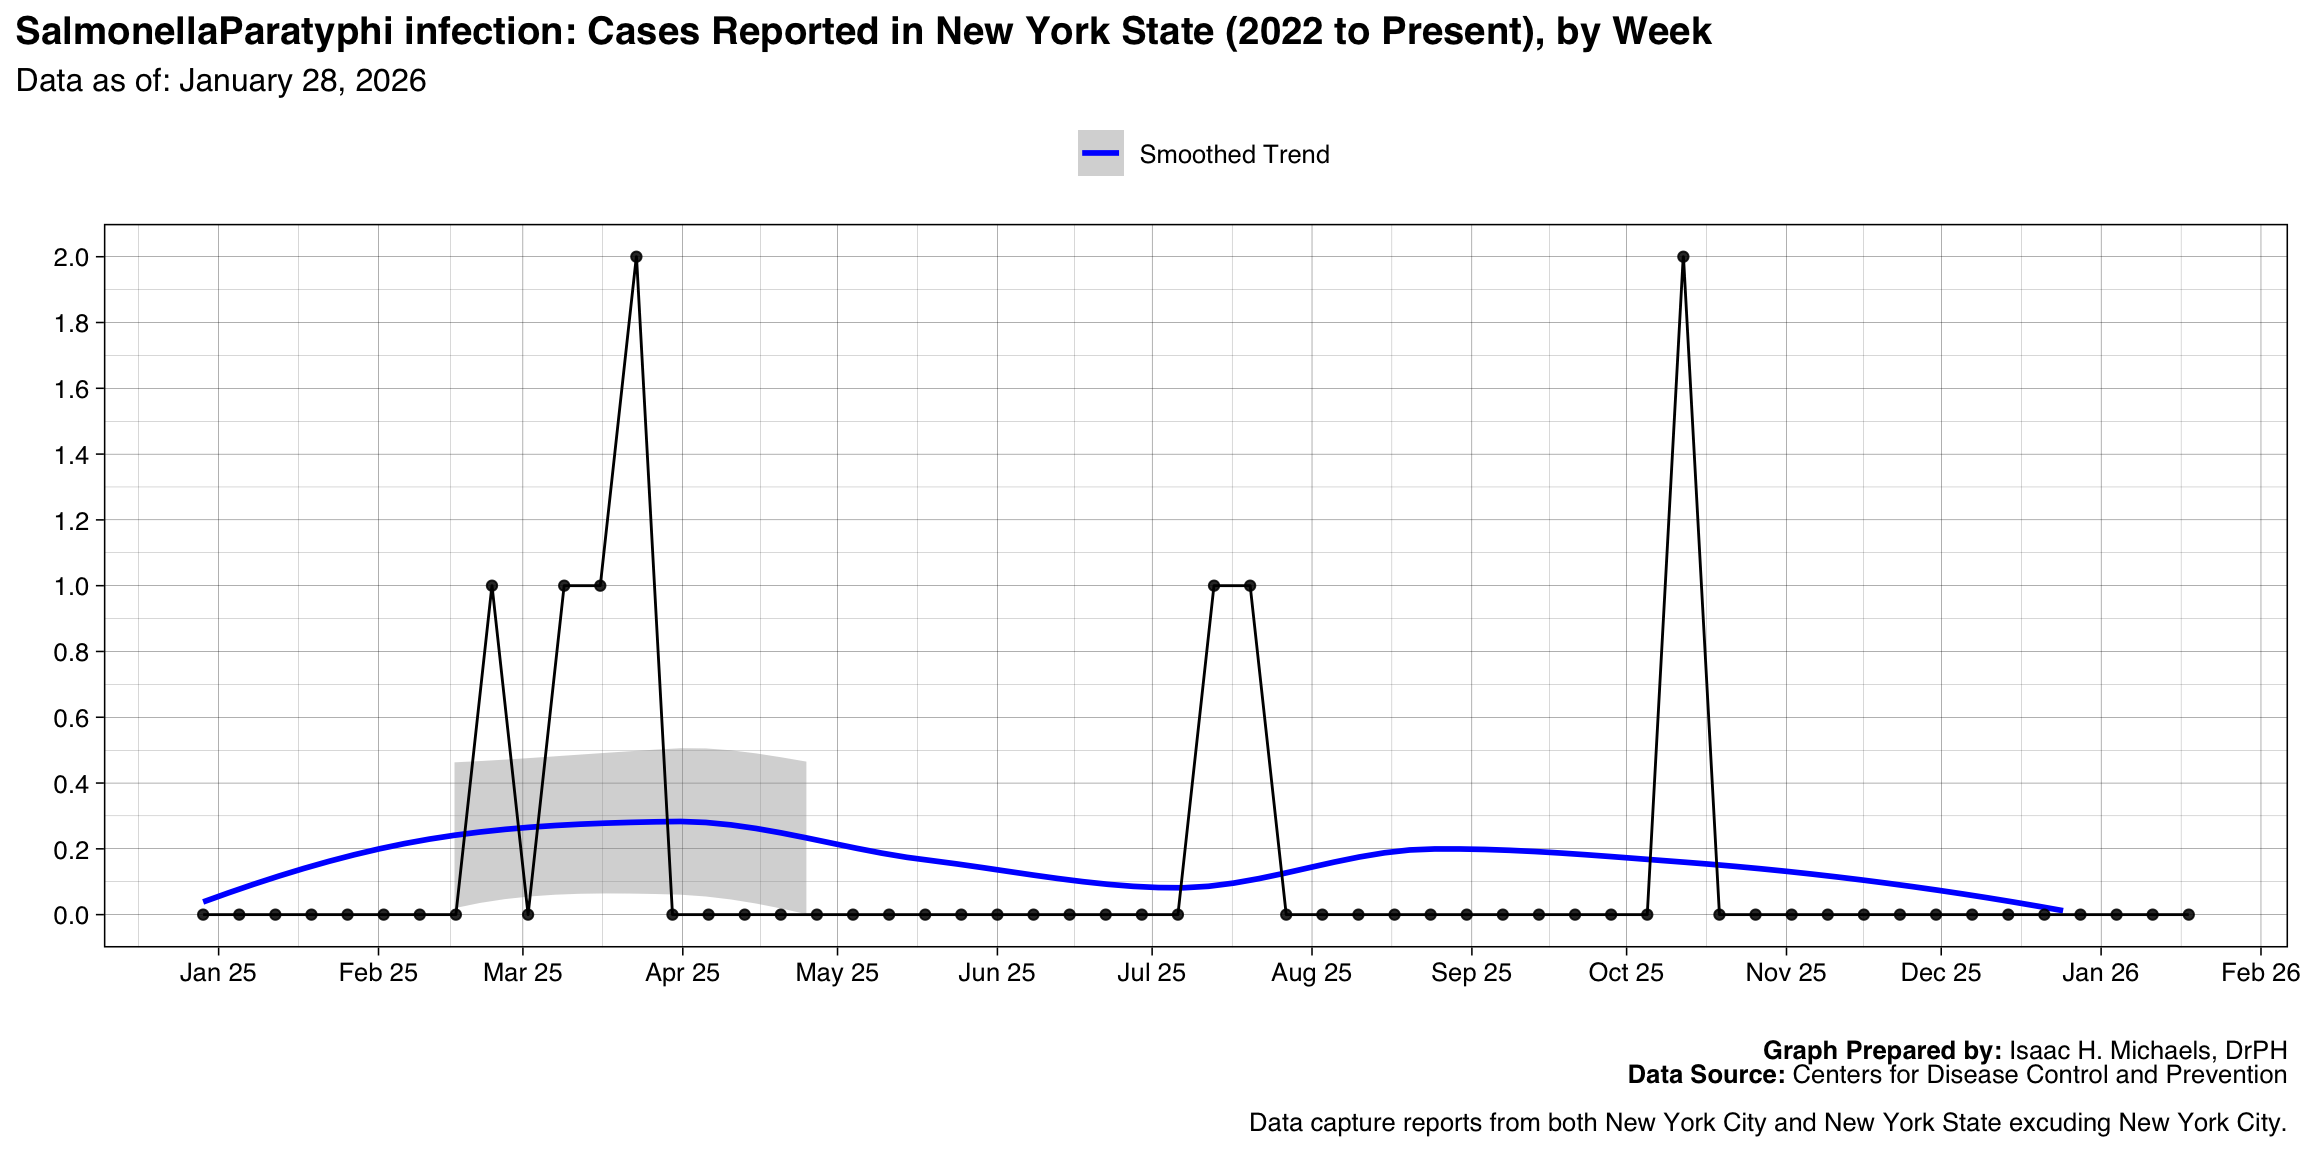
- SalmonellaParatyphi infection
- Toxic shock syndrome (other than Streptococcal)
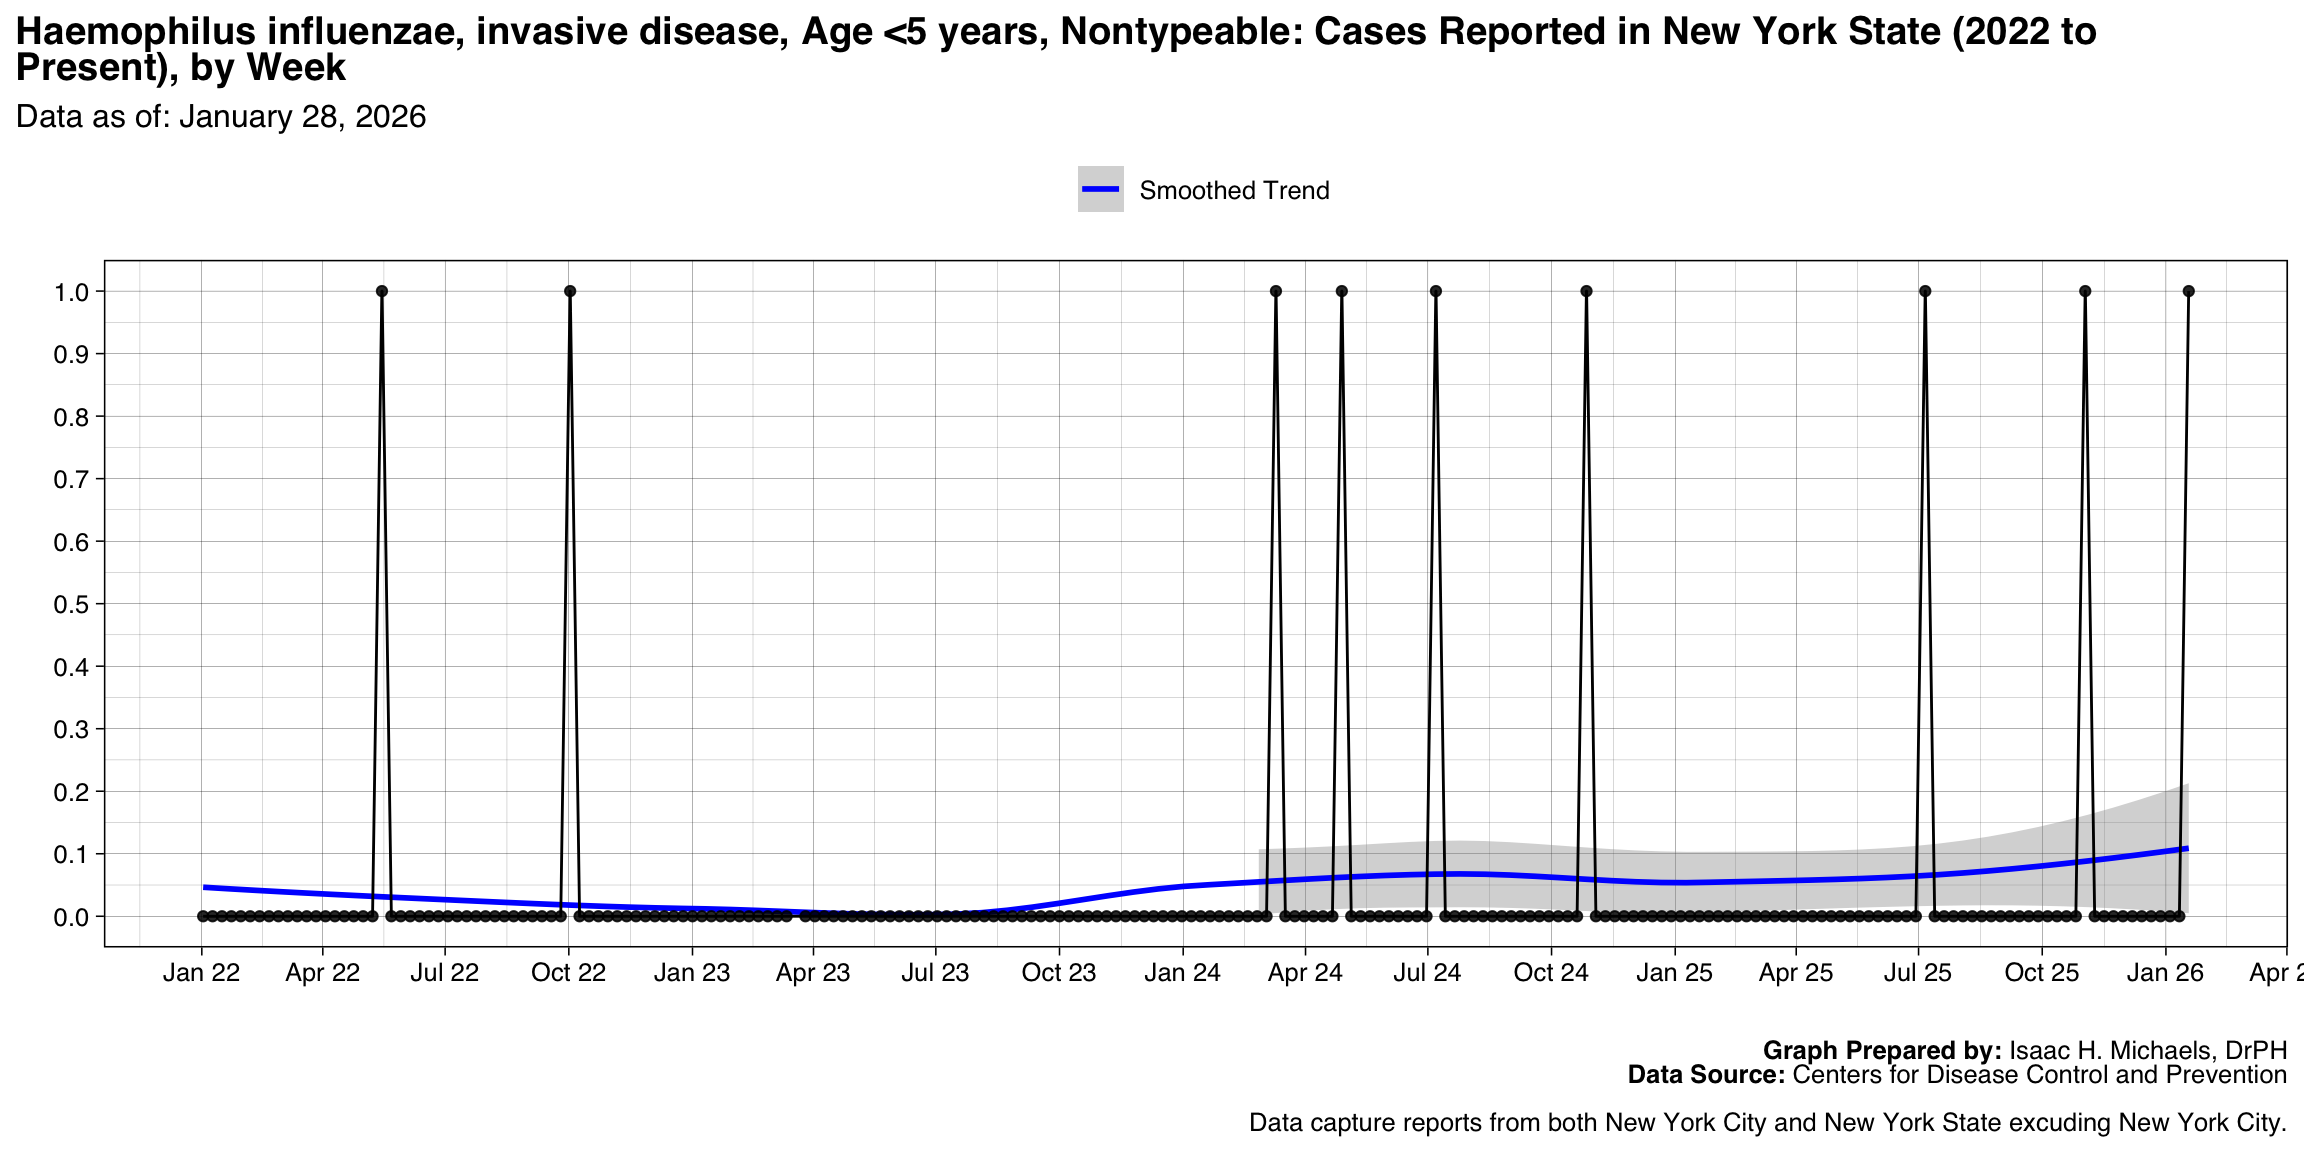
- Haemophilus influenzae, invasive disease, Age <5 years, Nontypeable
- Haemophilus influenzae, invasive disease, Age <5 years, Non-b serotype
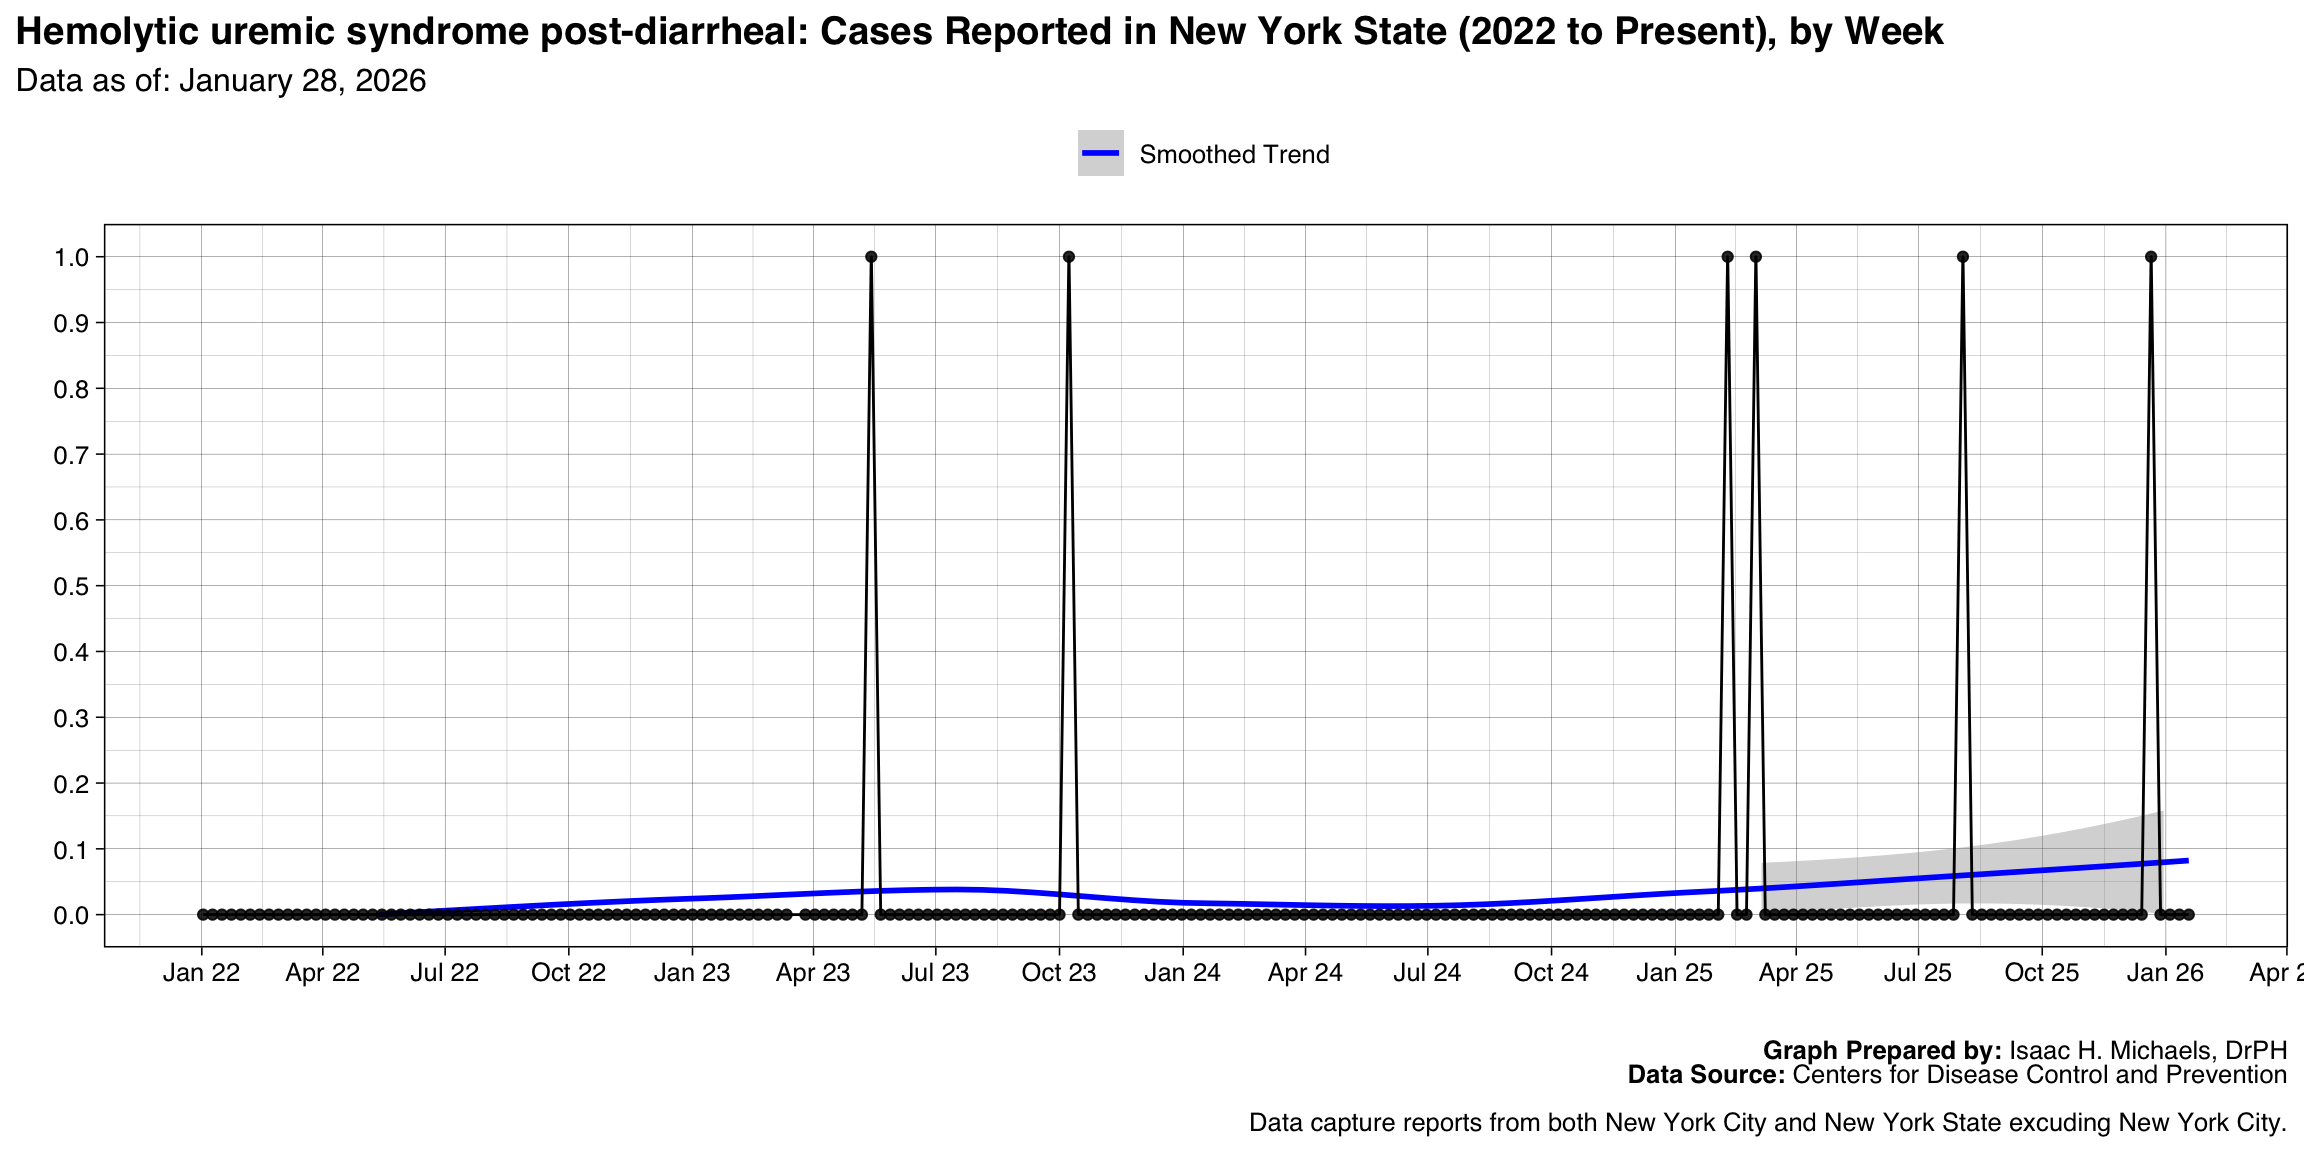
- Hemolytic uremic syndrome post-diarrheal
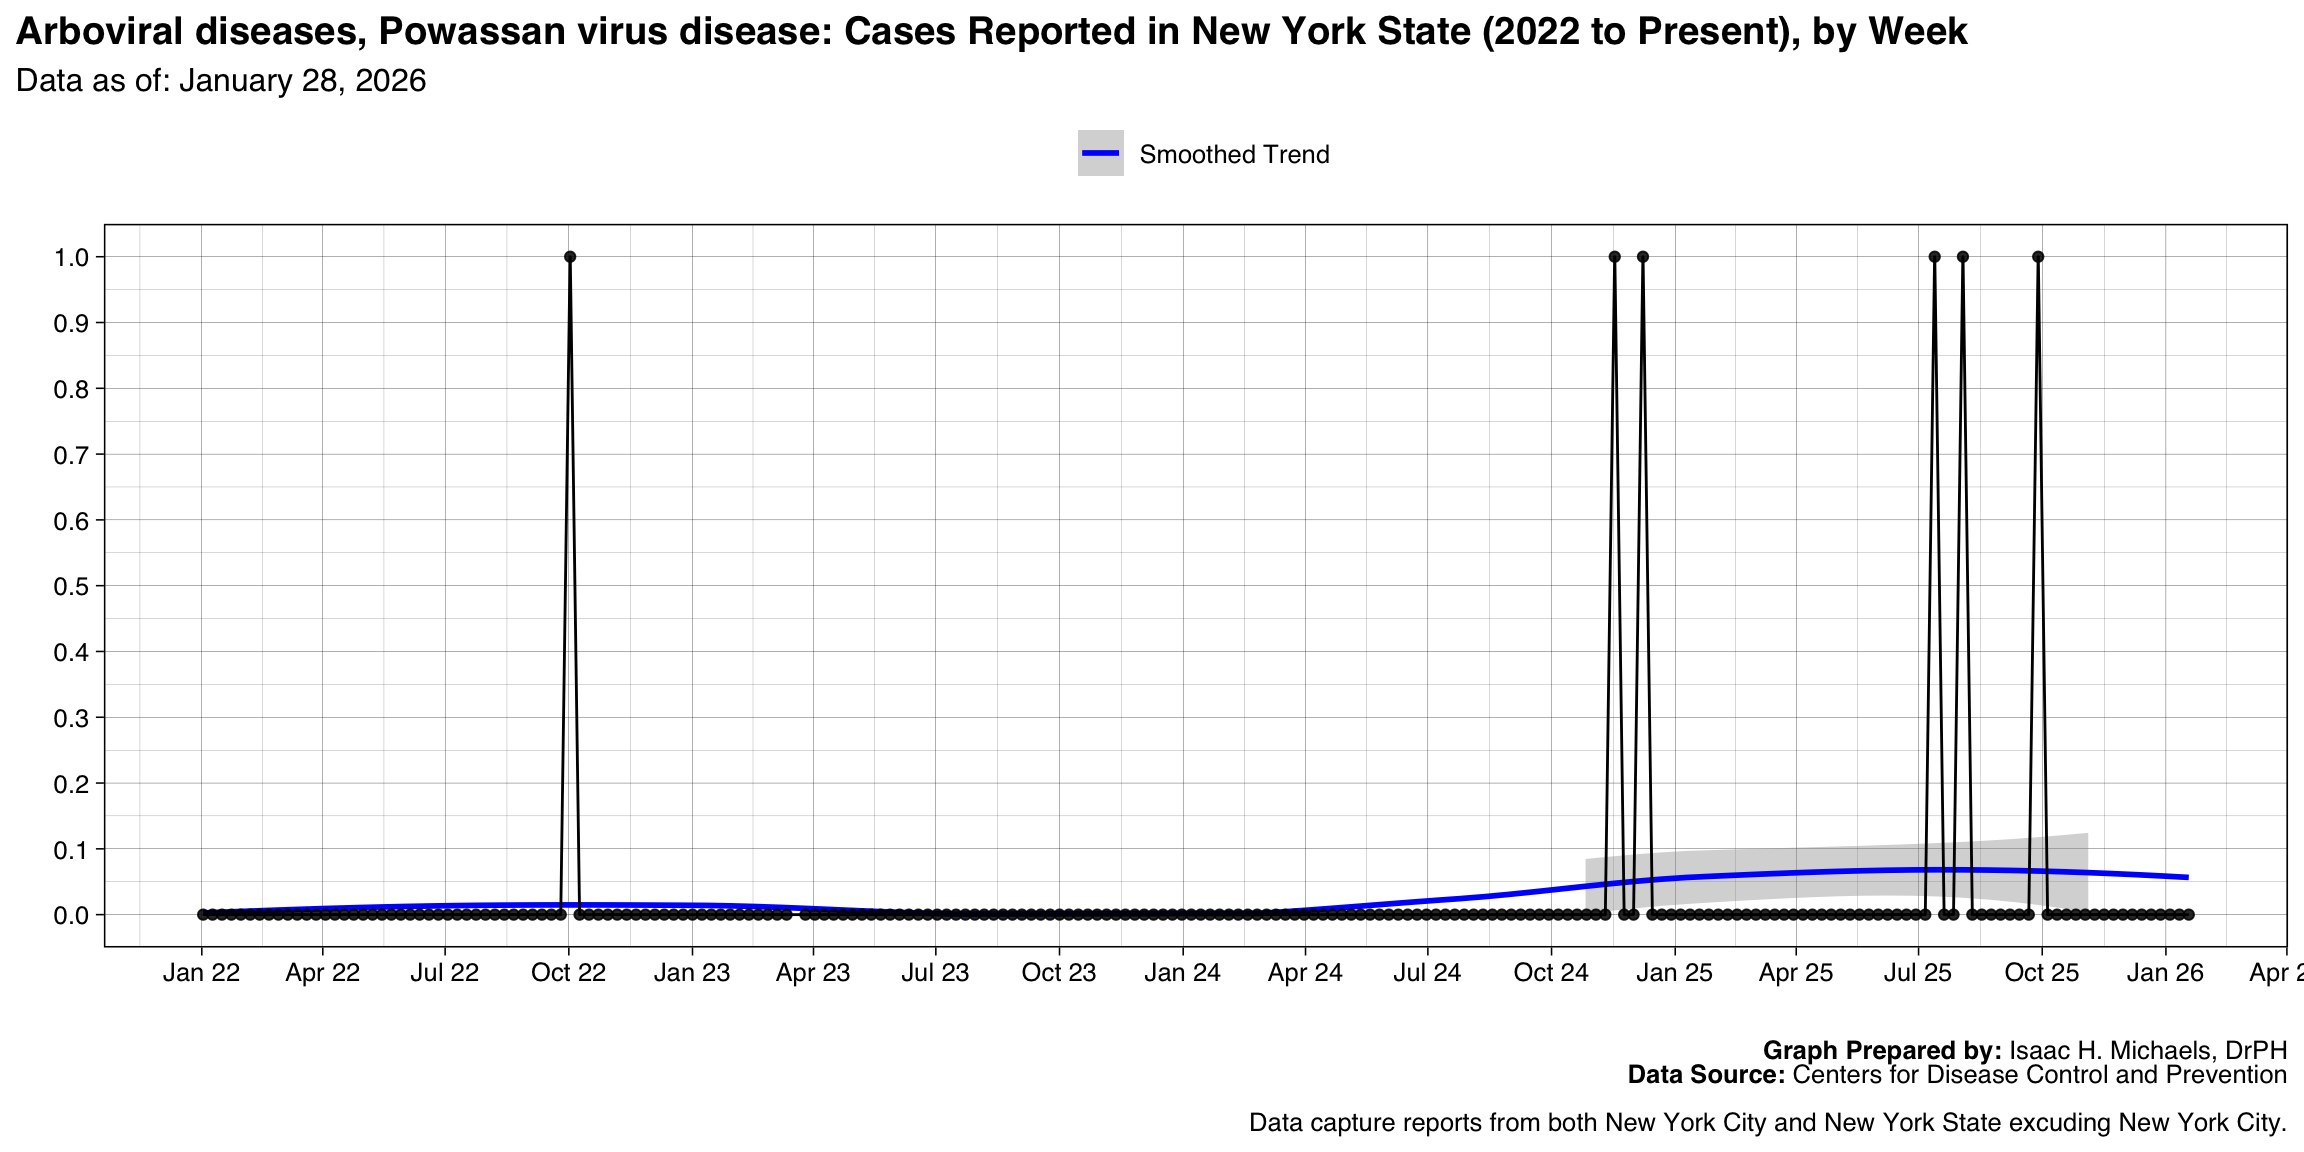
- Arboviral diseases, Powassan virus disease
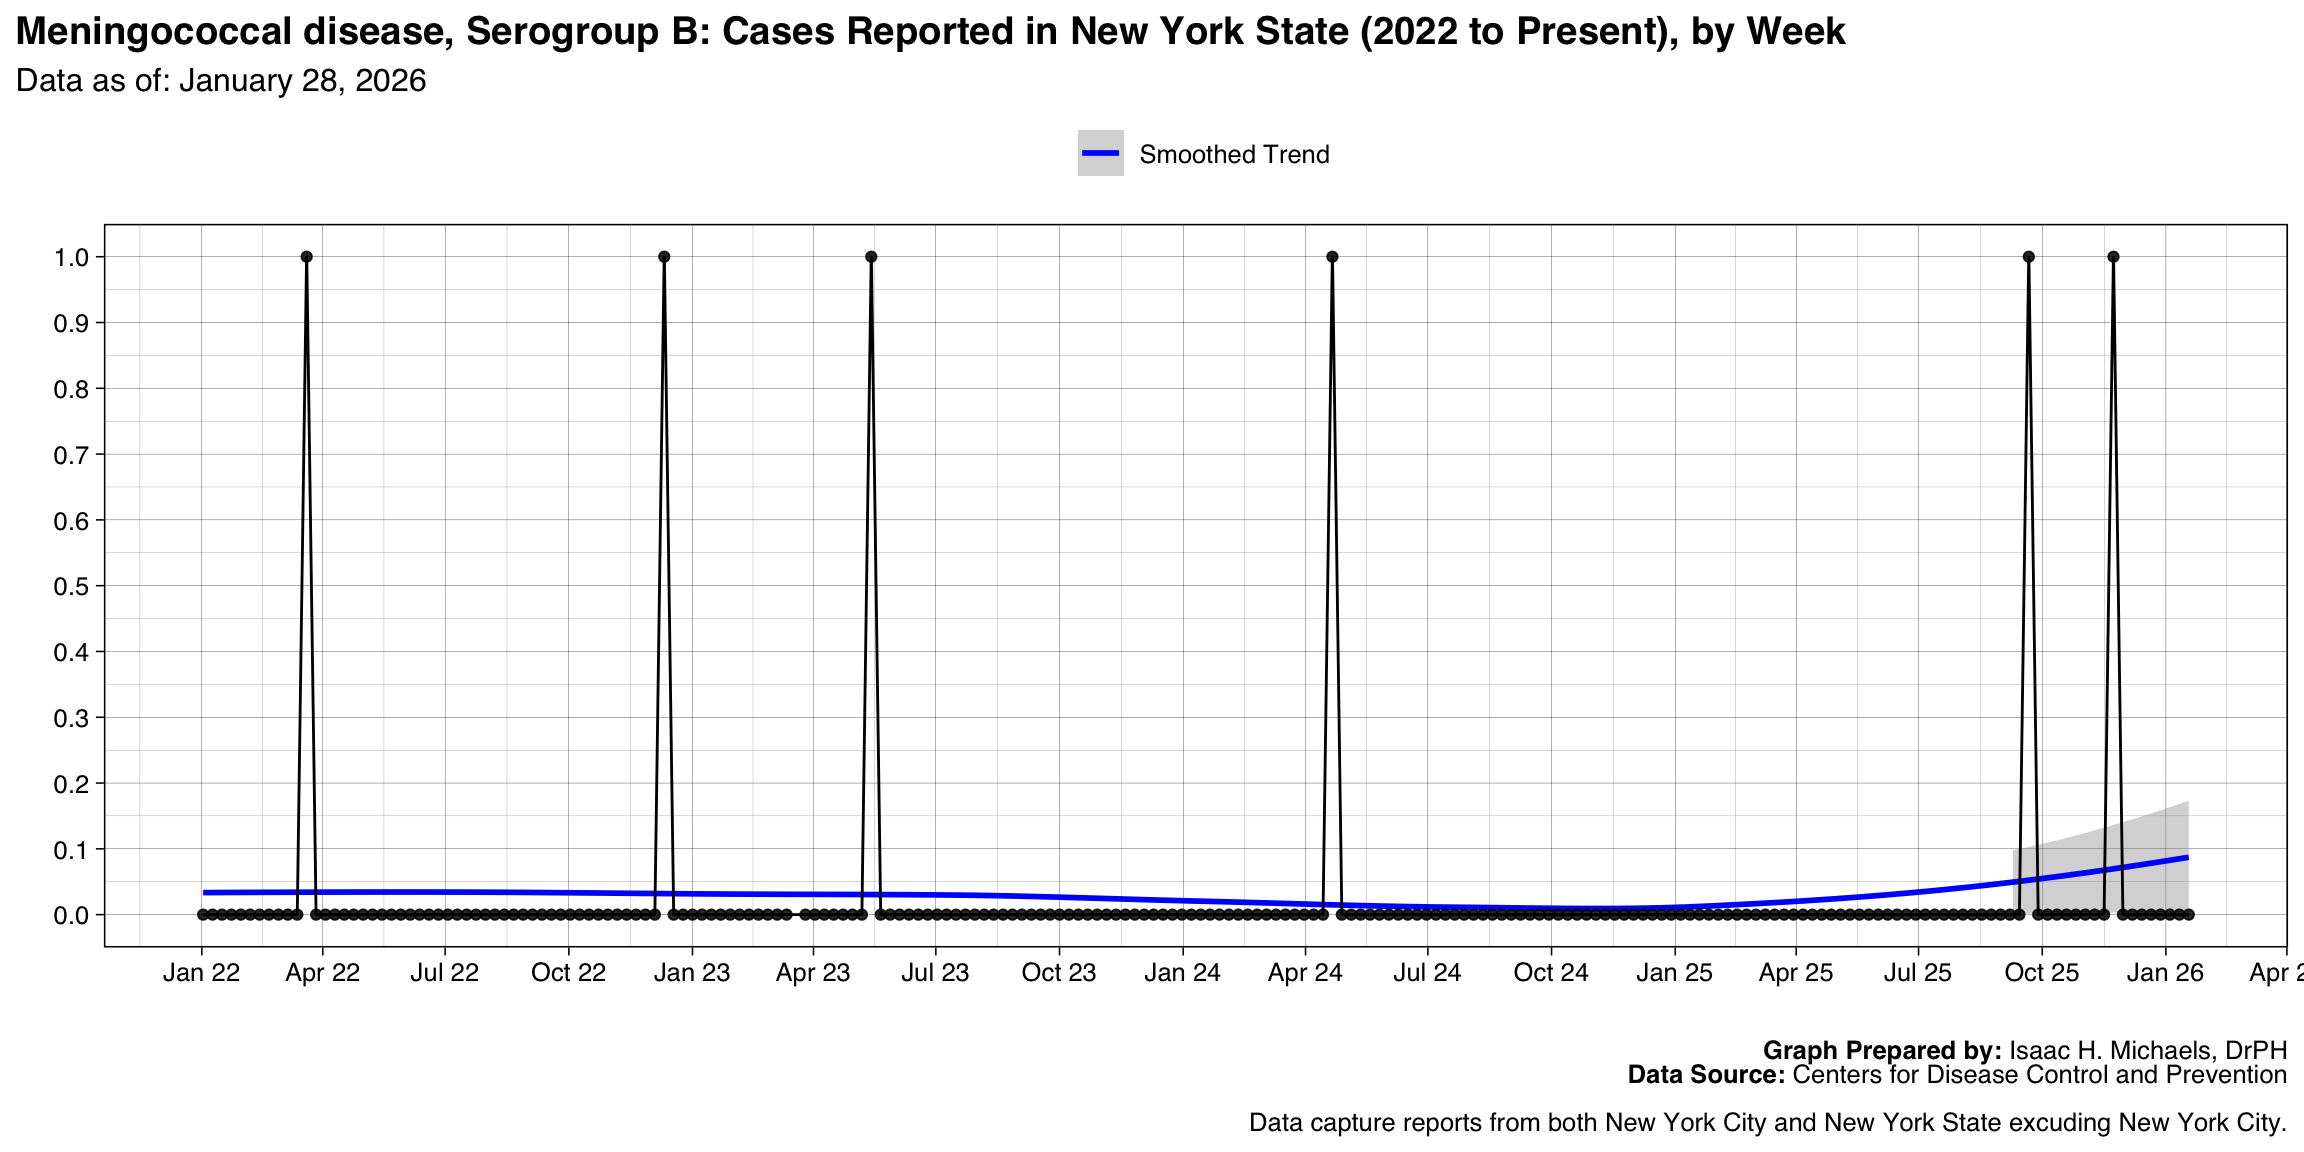
- Meningococcal disease, Serogroup B
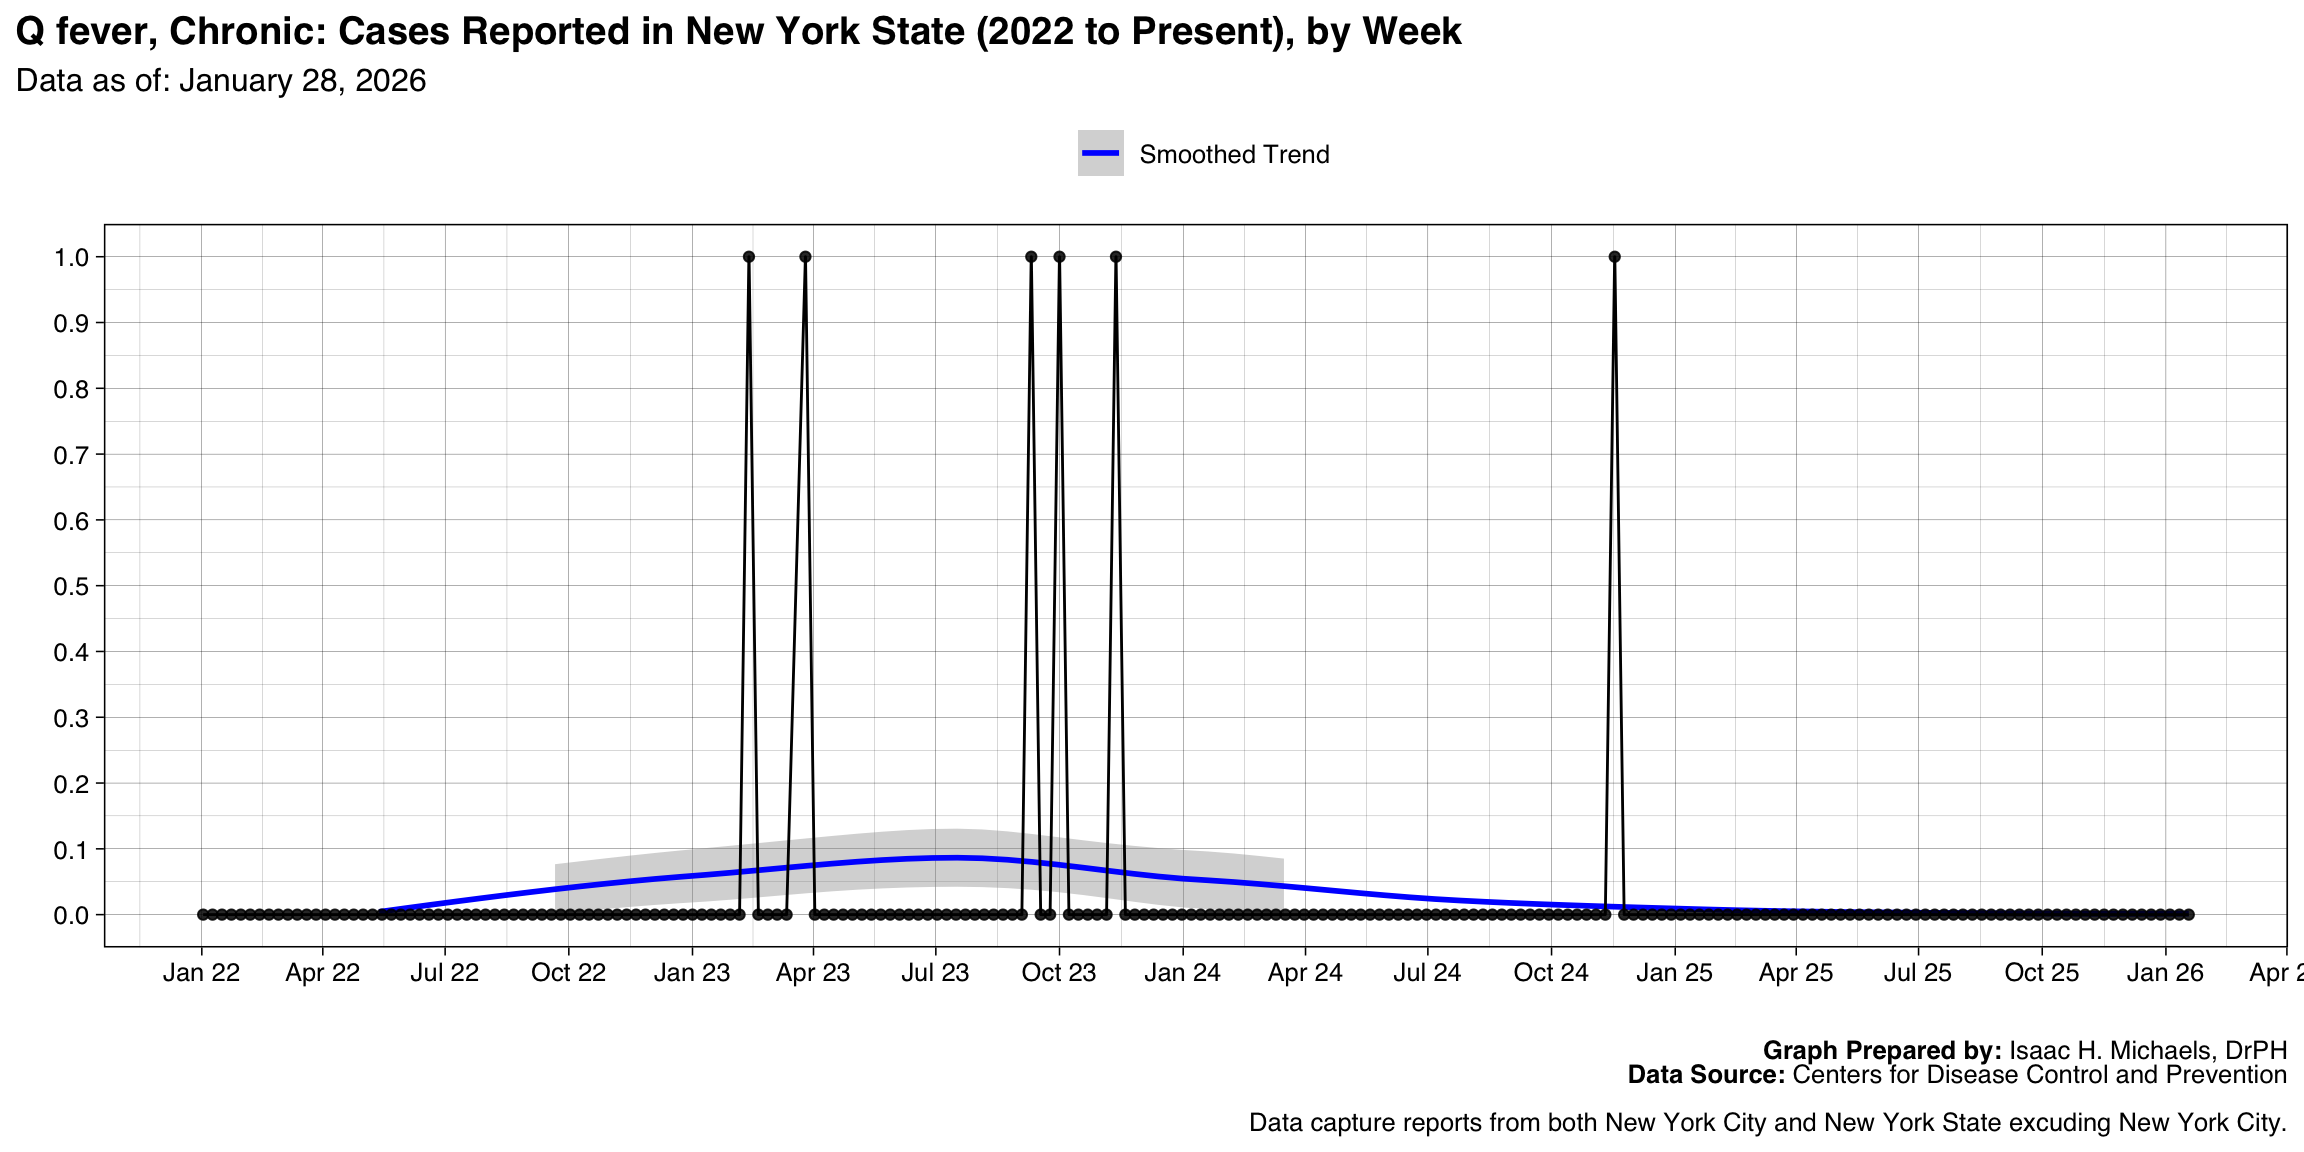
- Q fever, Chronic
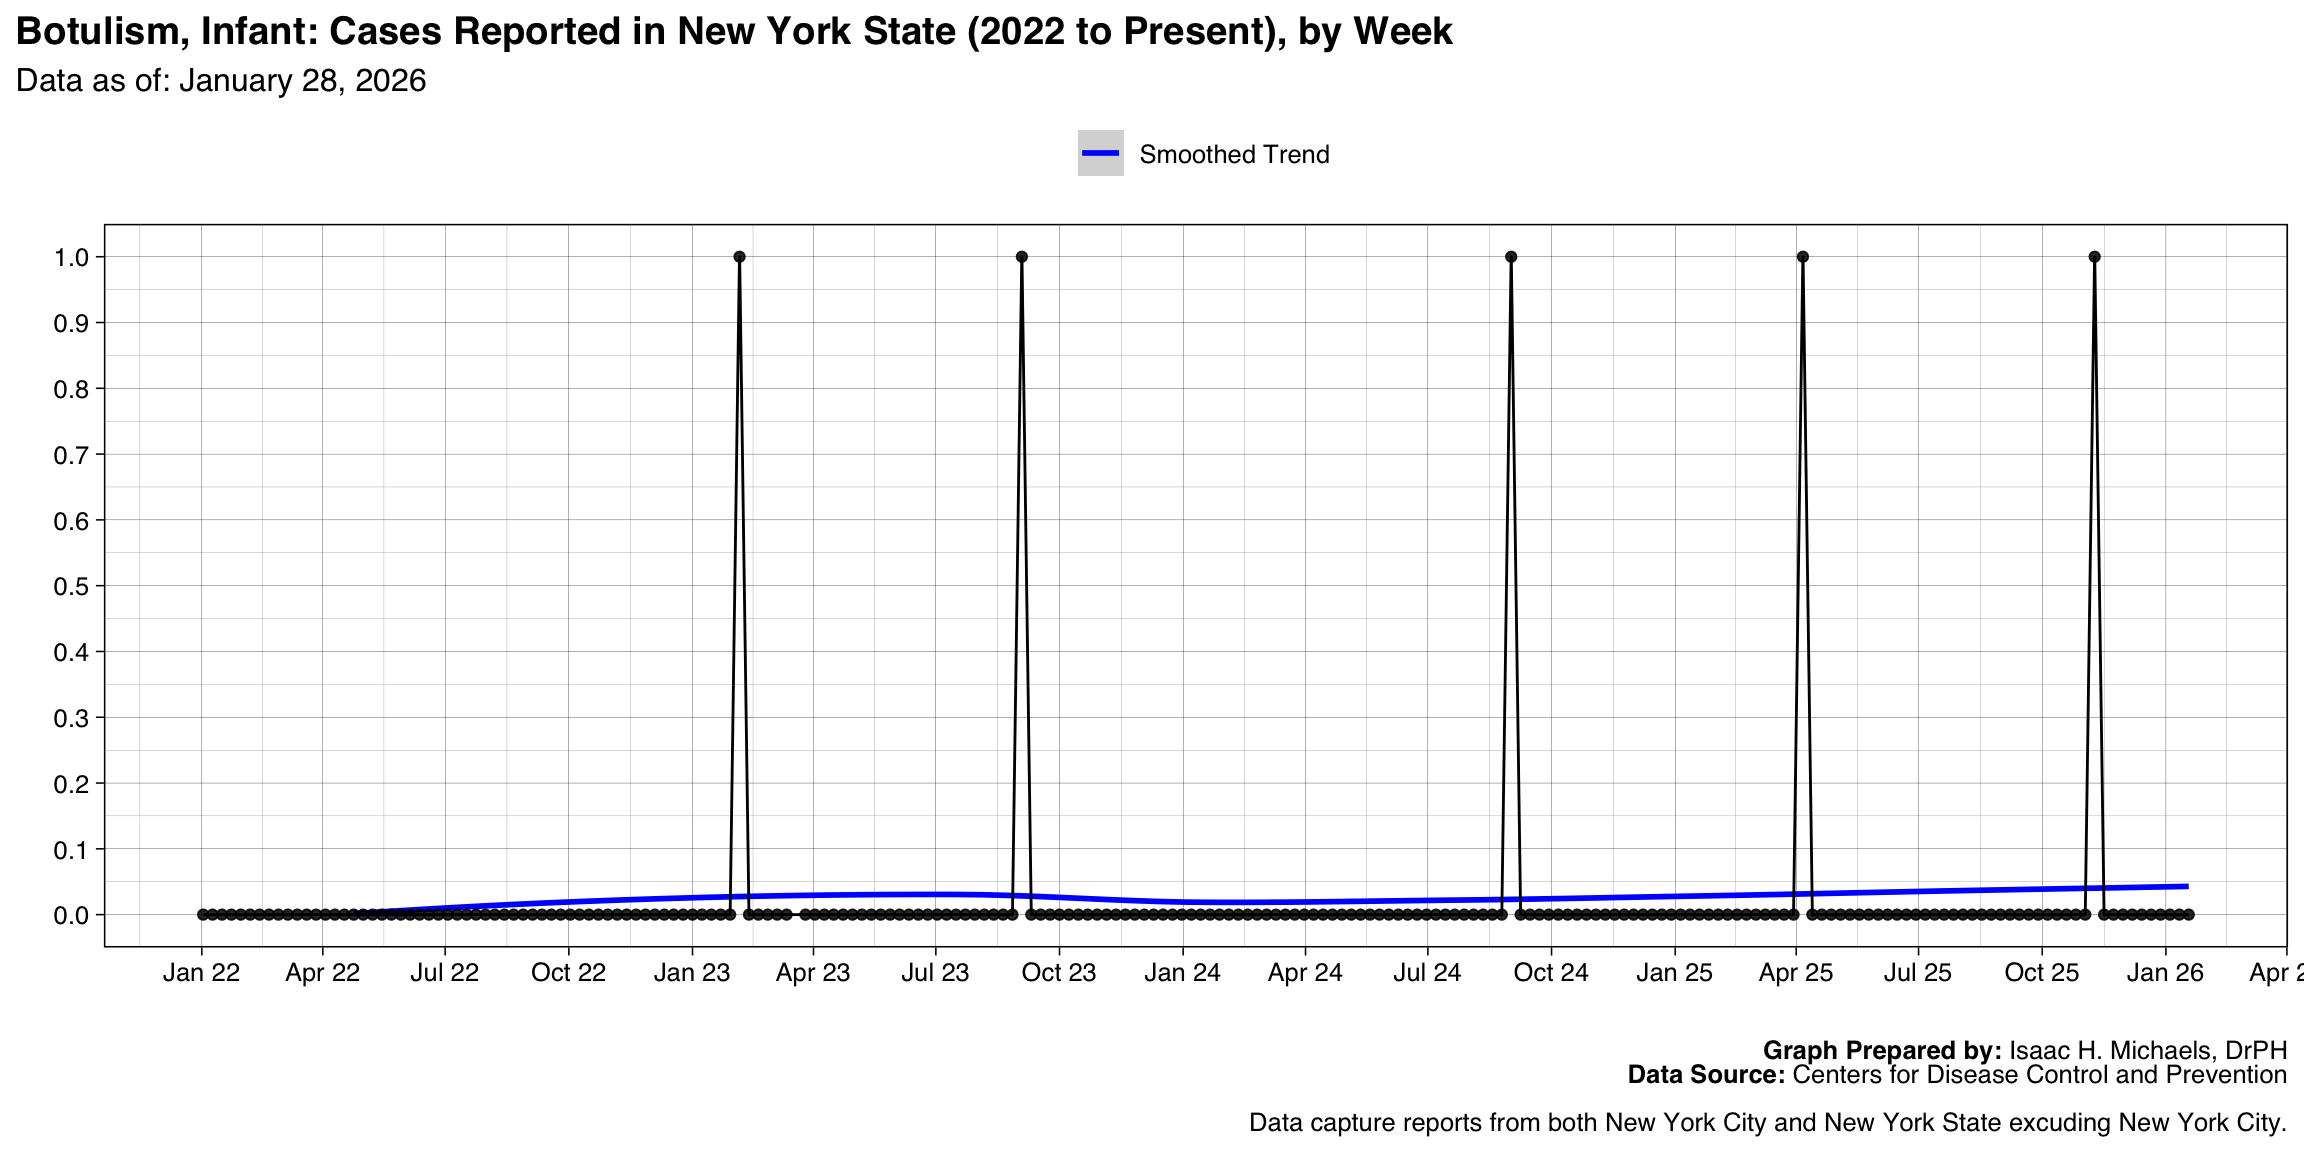
- Botulism, Infant
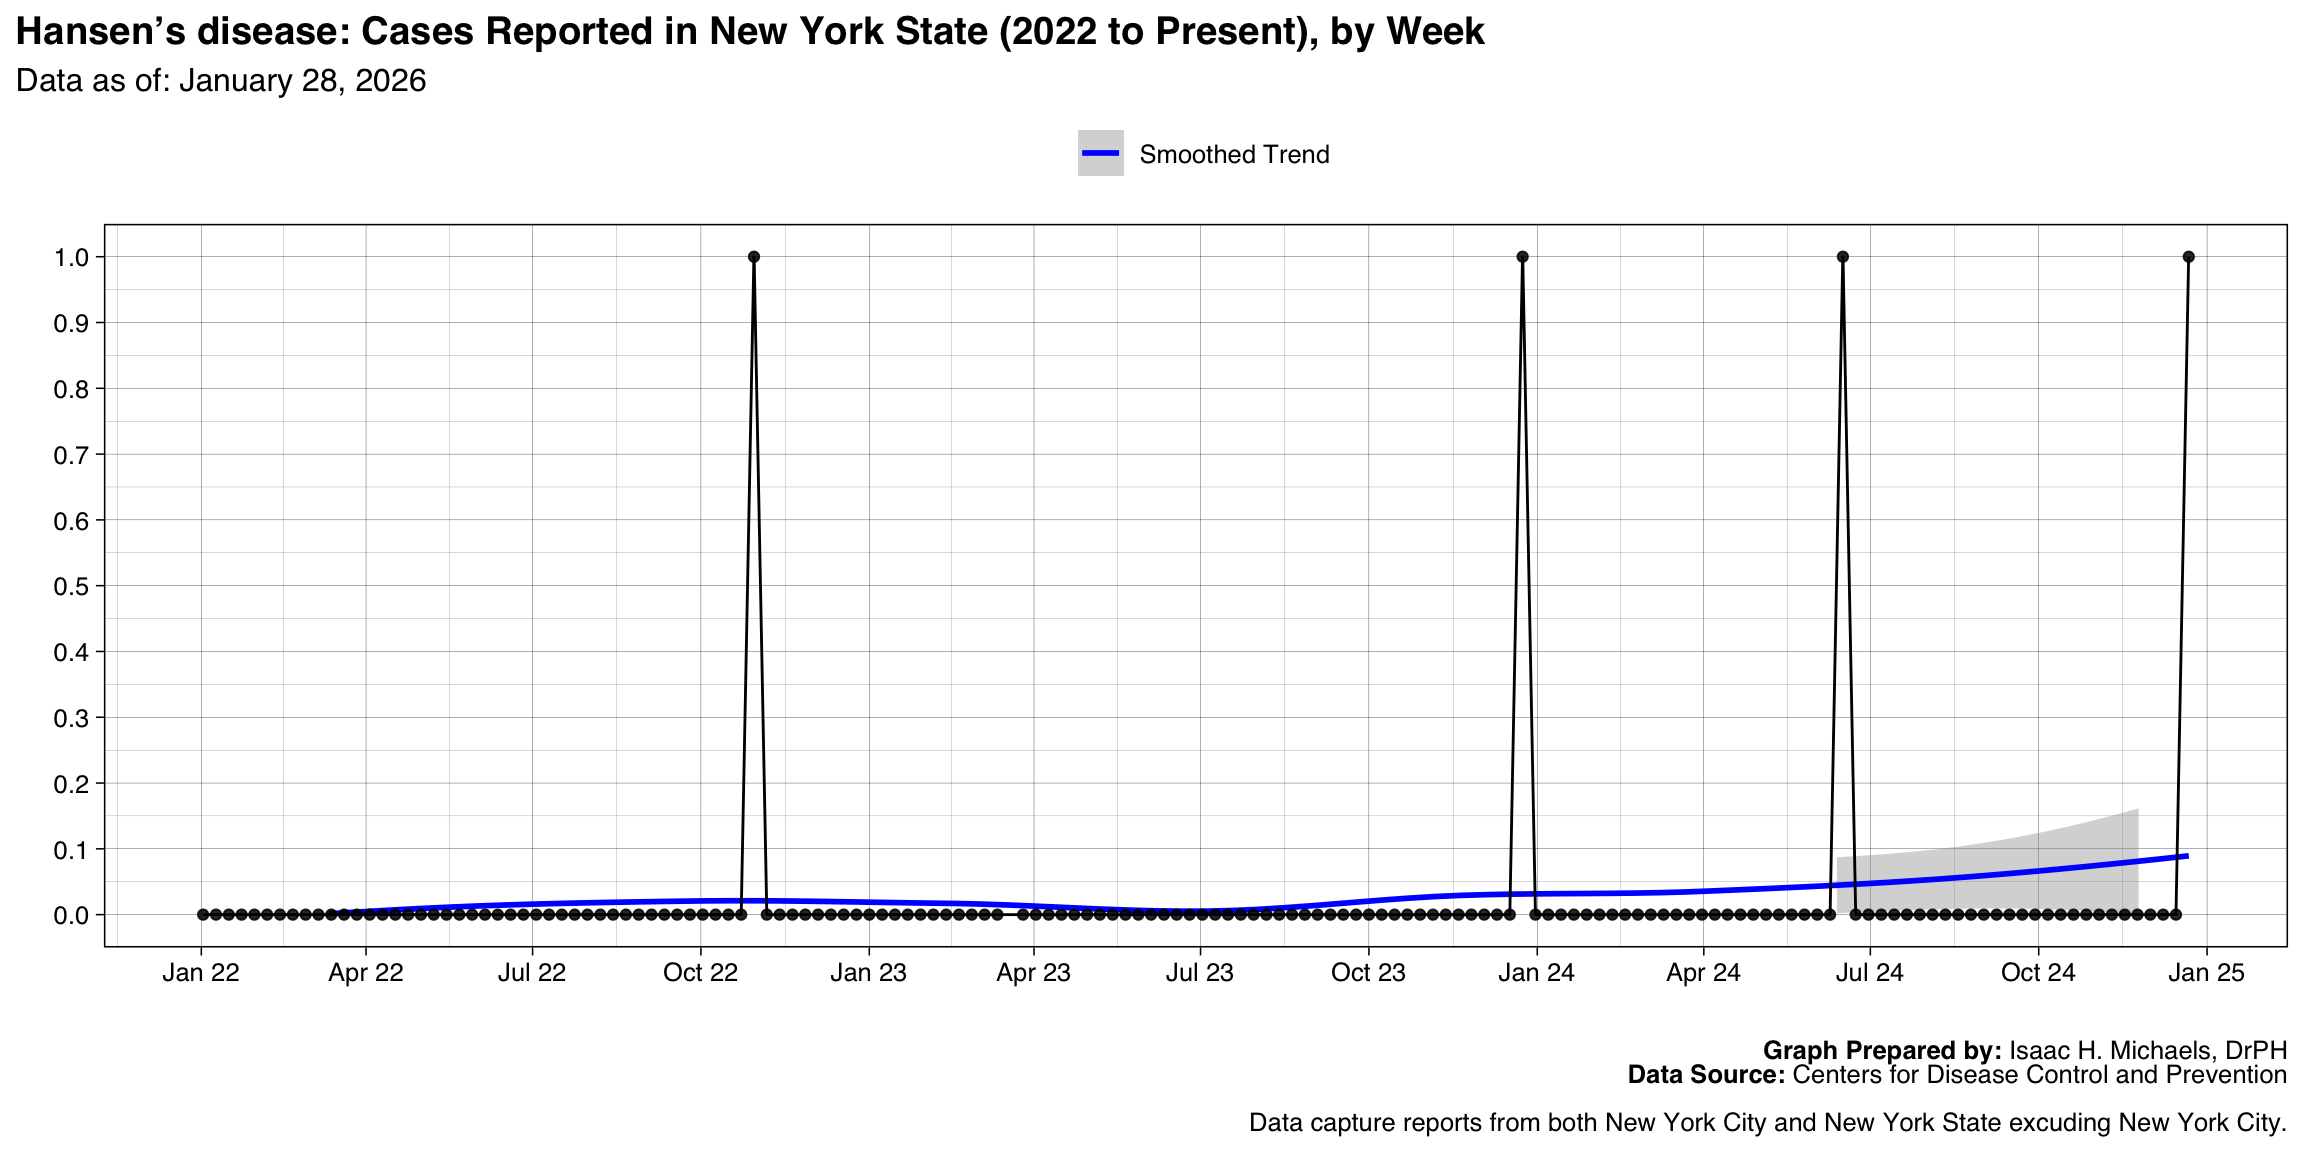
- Hansen’s disease
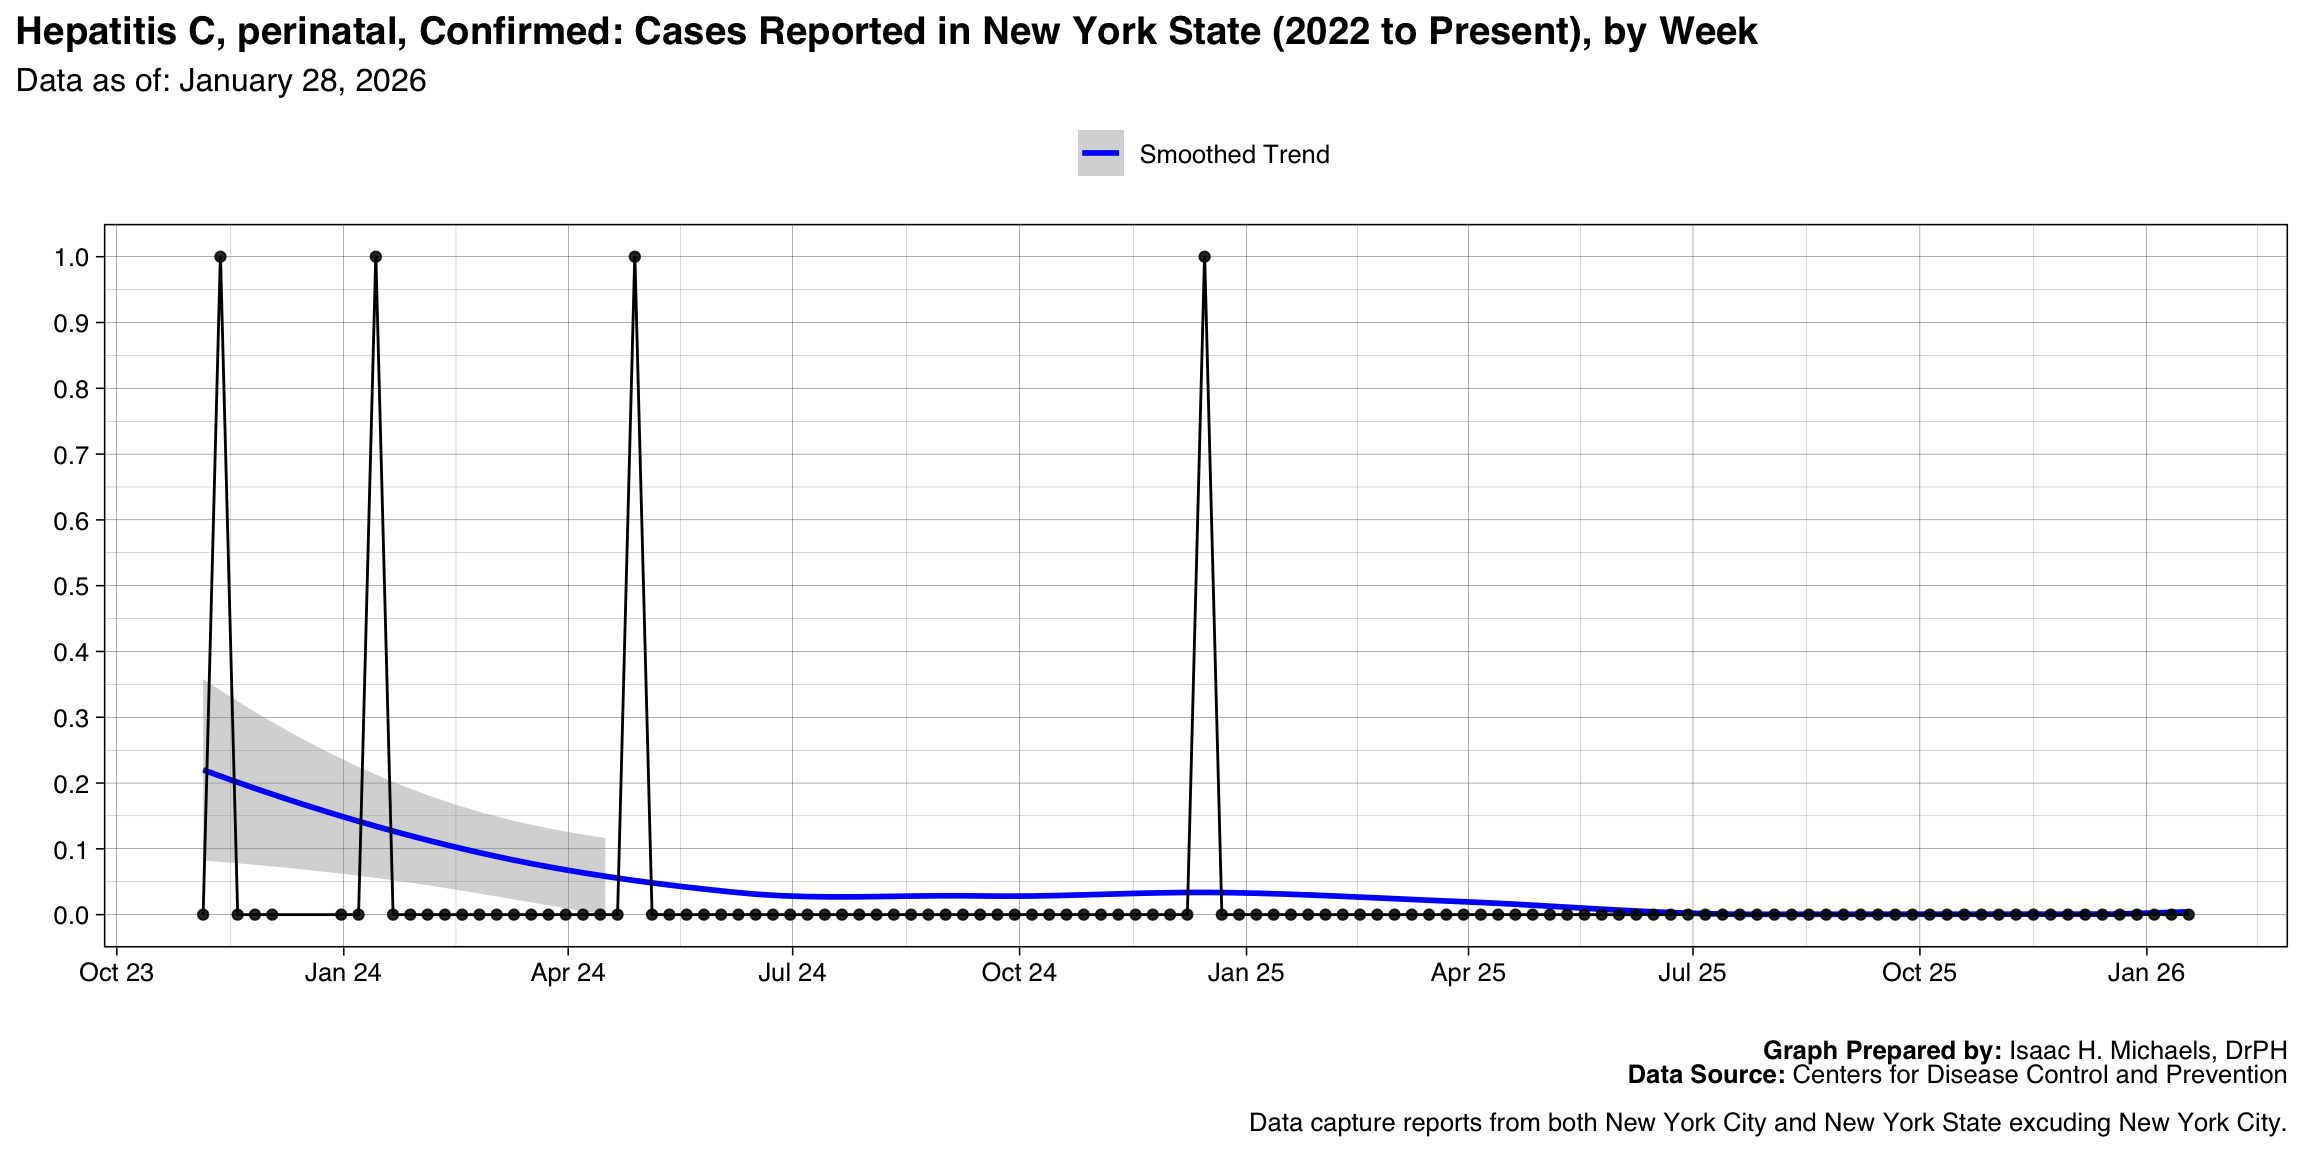
- Hepatitis C, perinatal, Confirmed
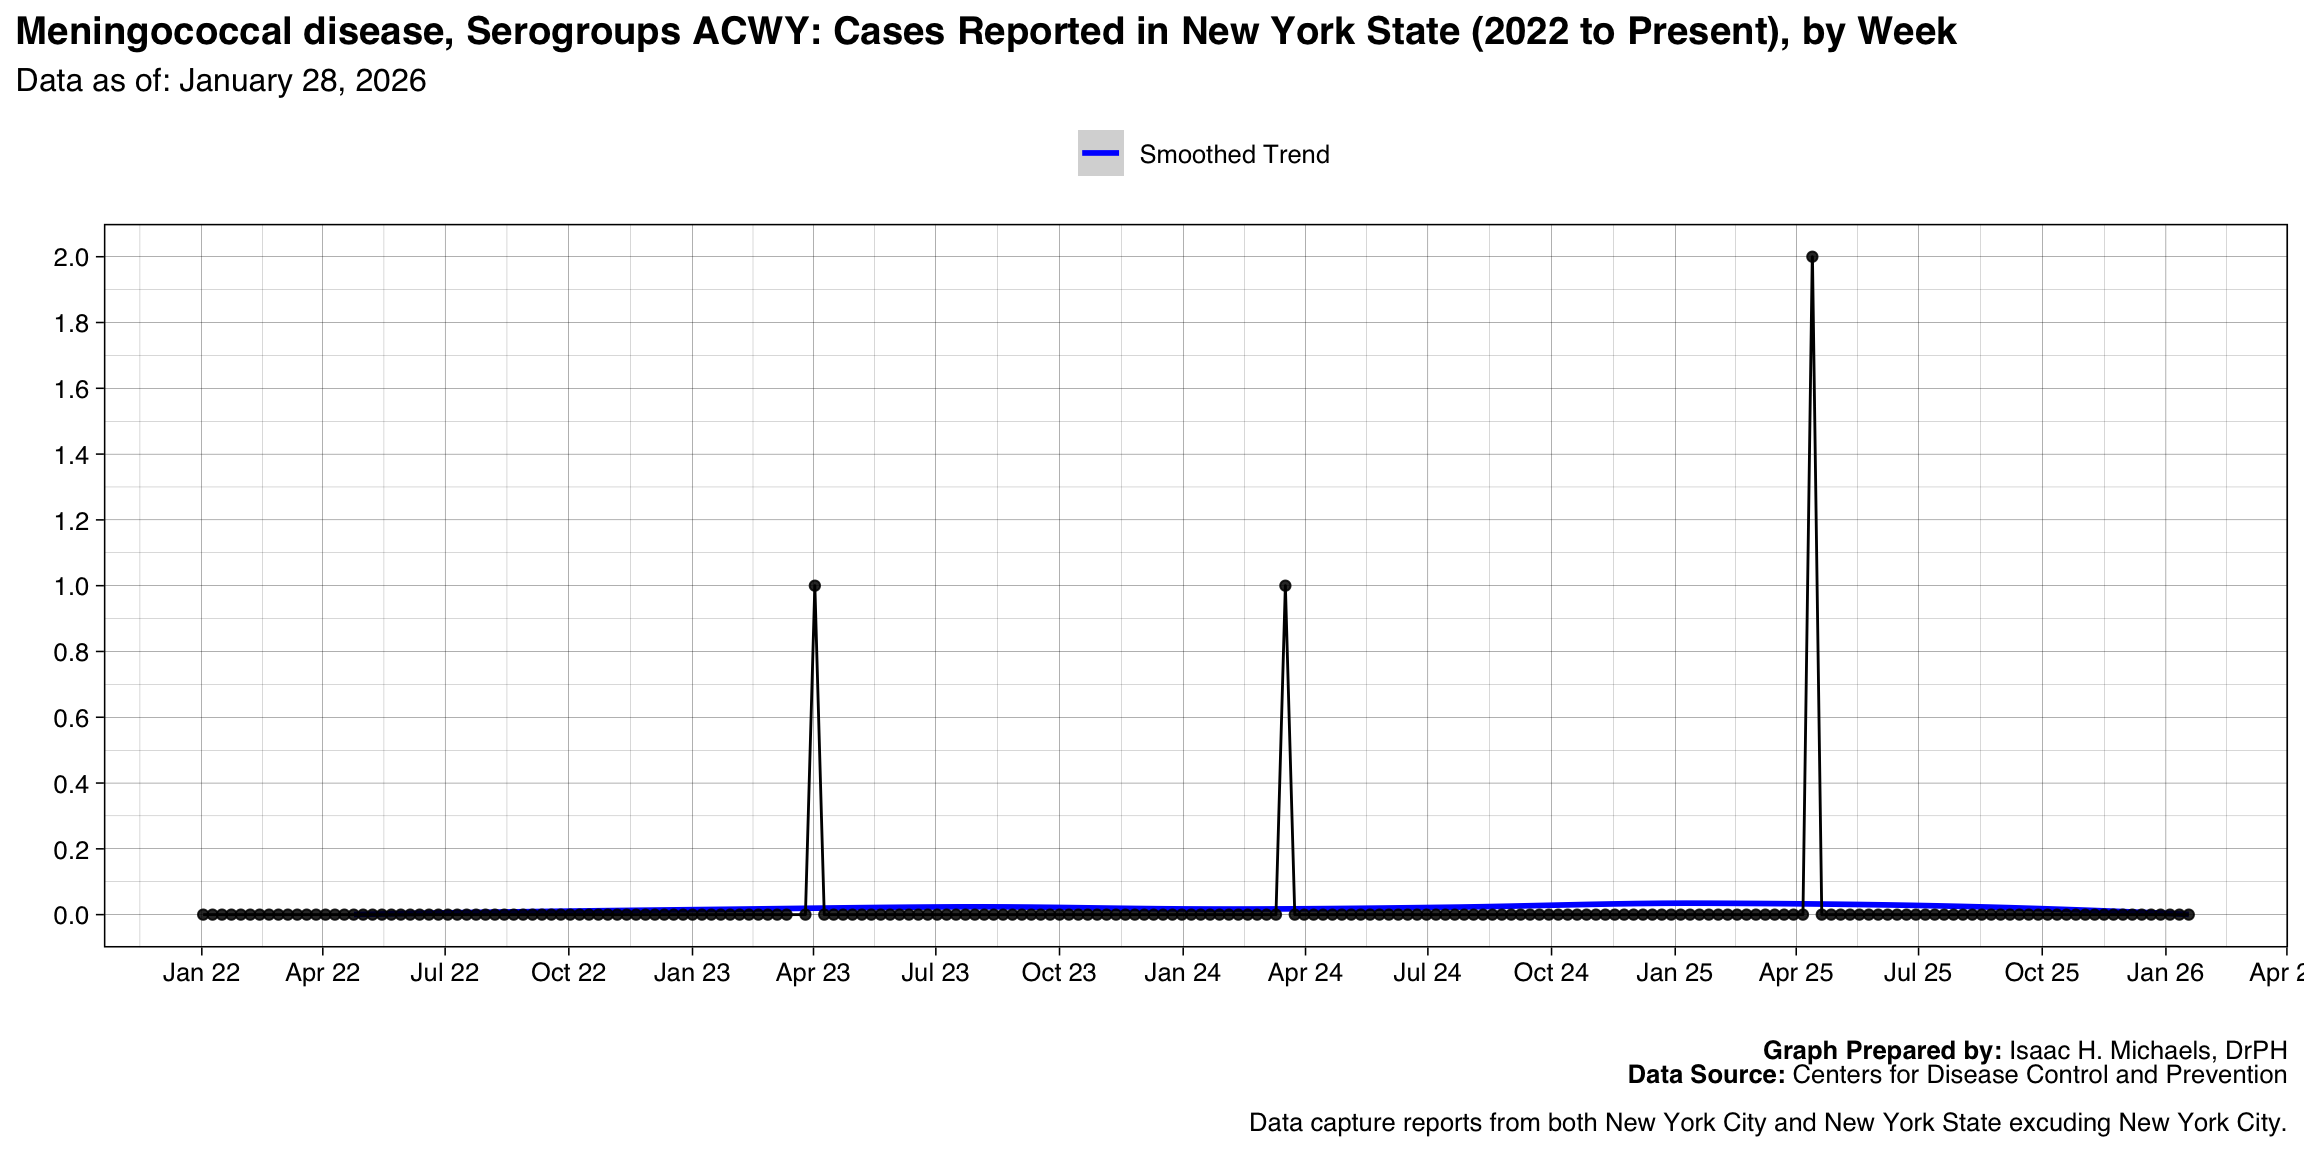
- Meningococcal disease, Serogroups ACWY
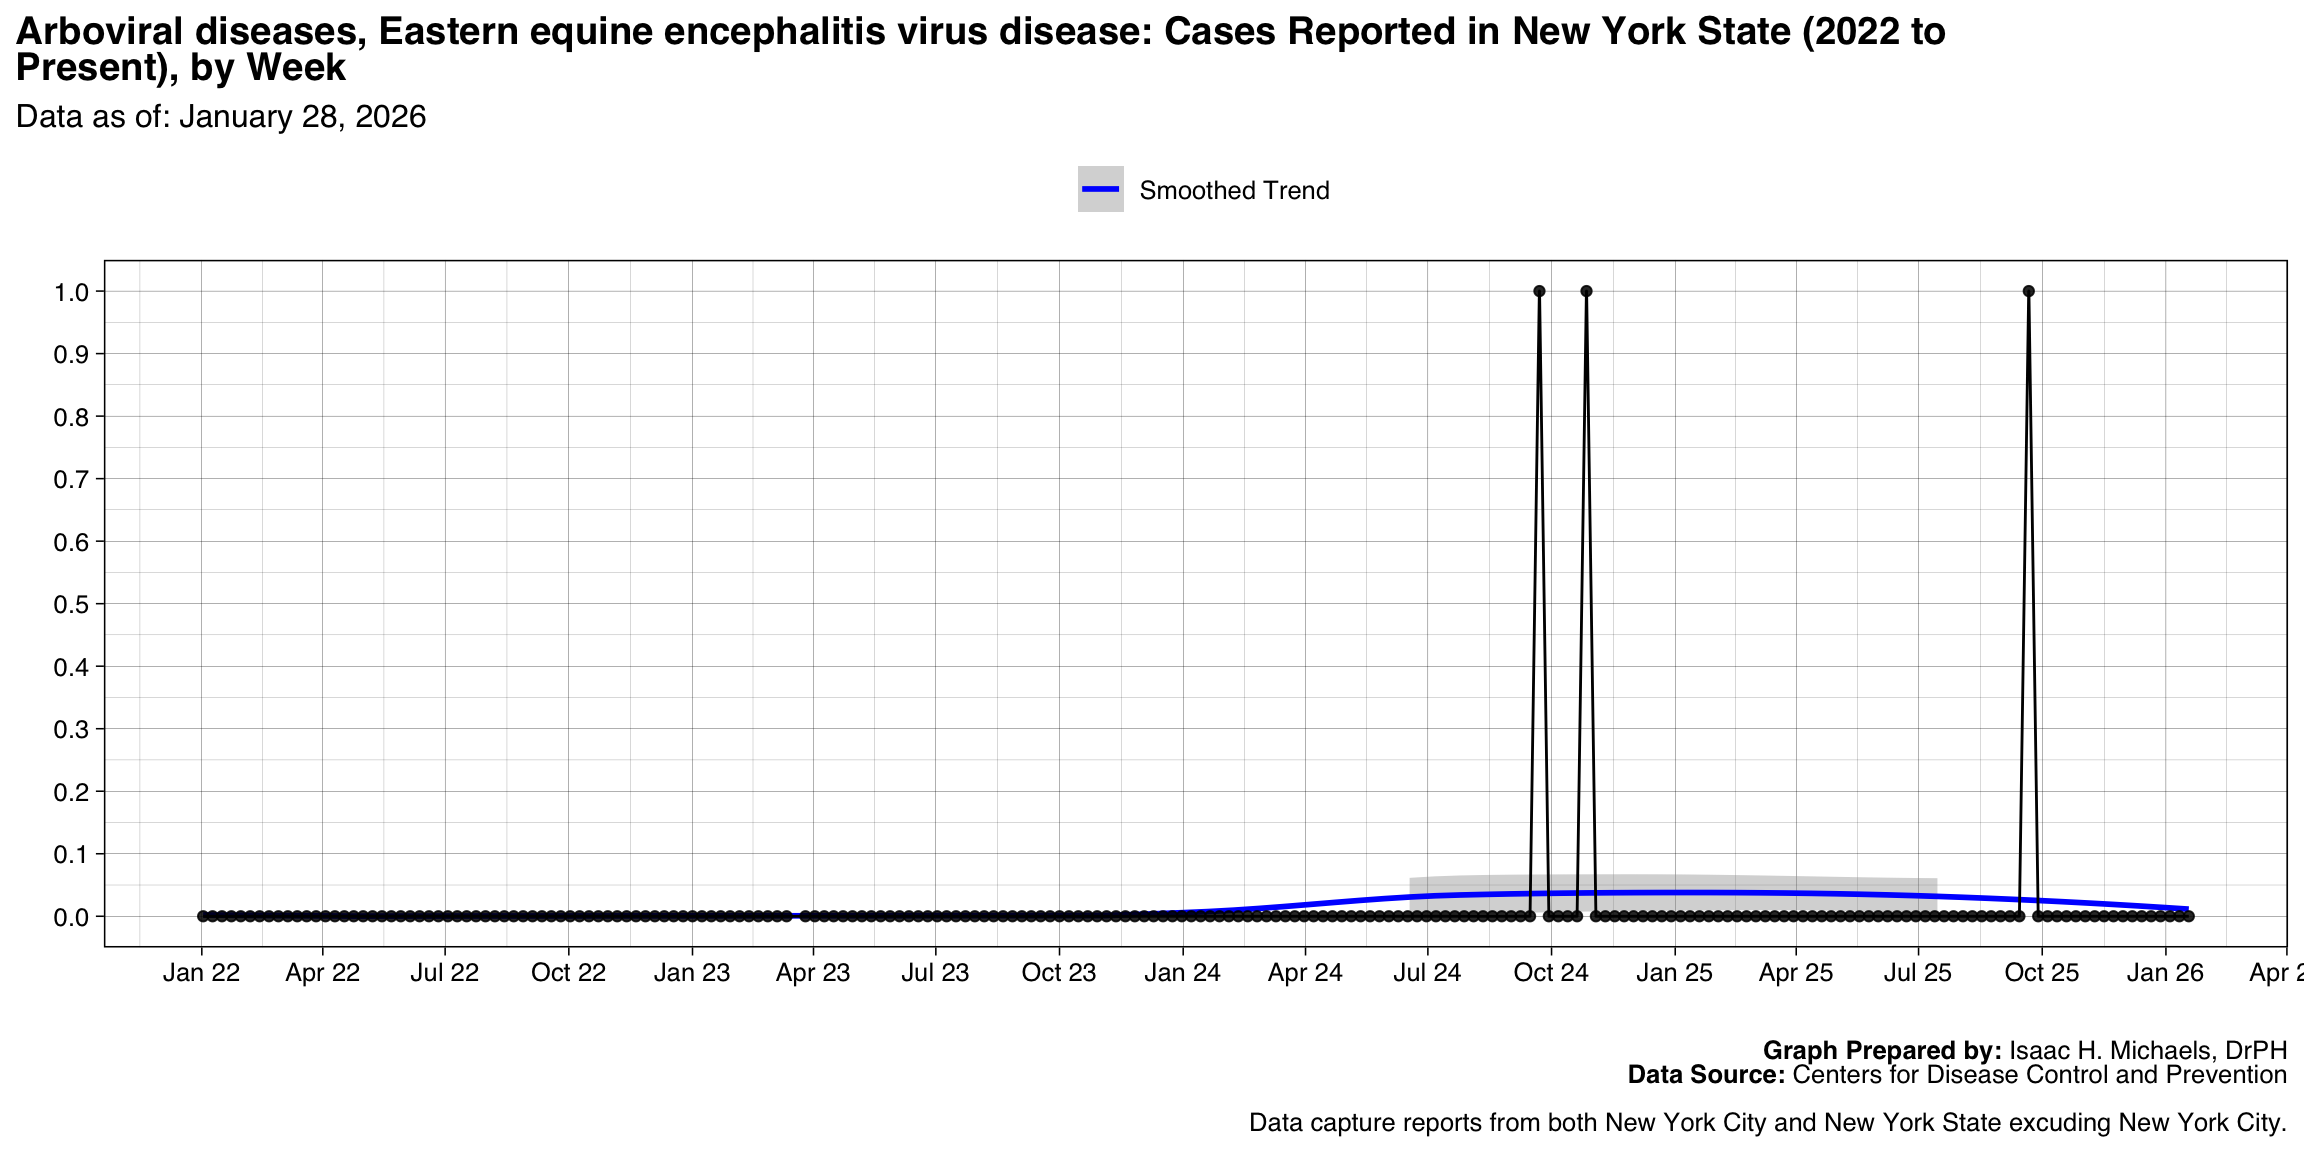
- Arboviral diseases, Eastern equine encephalitis virus disease
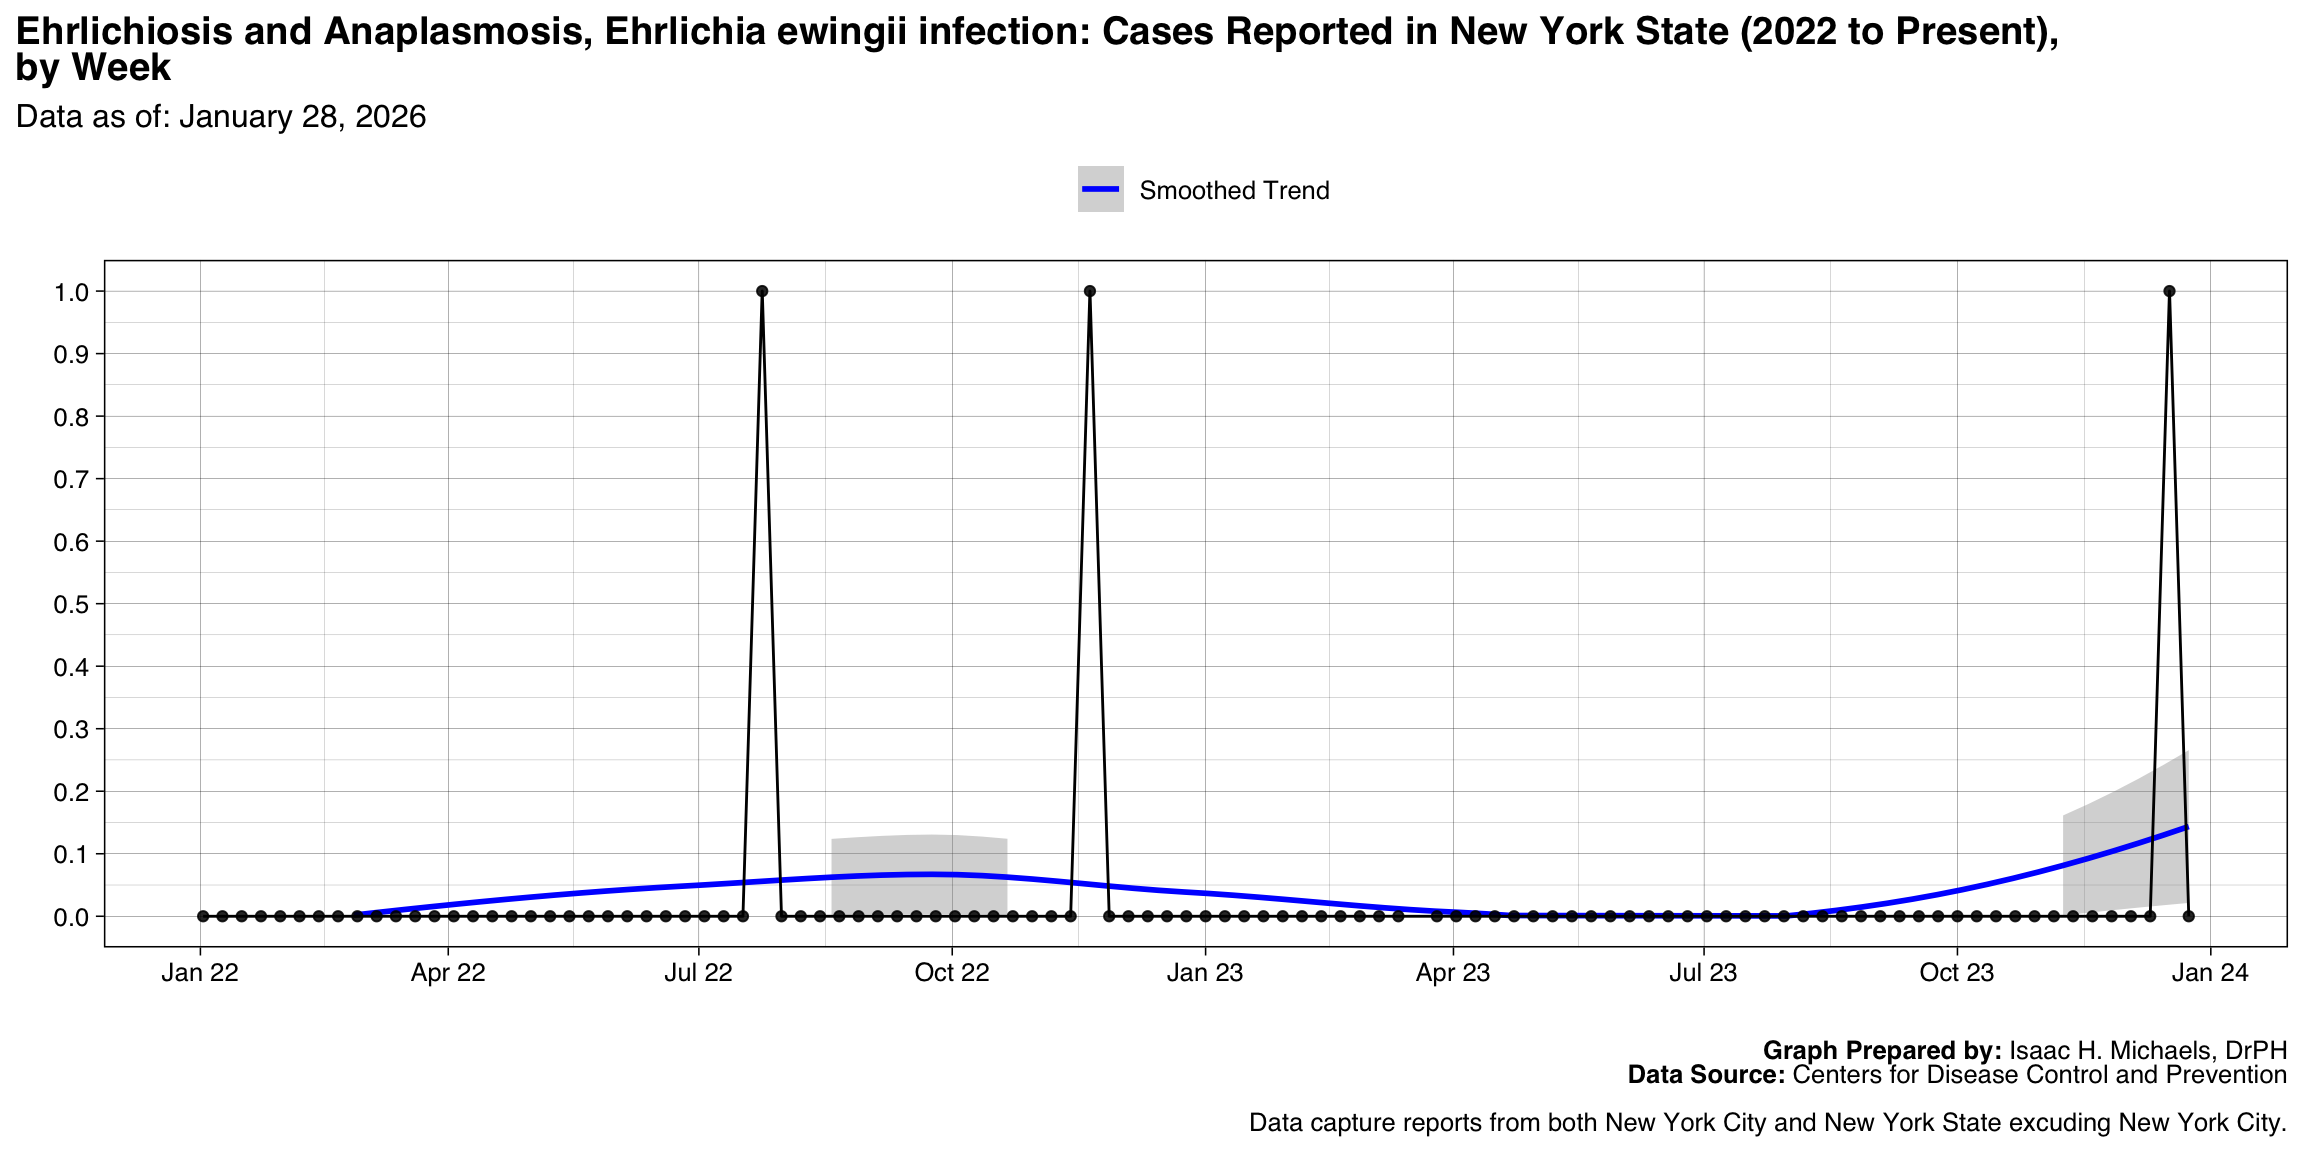
- Ehrlichiosis and Anaplasmosis, Ehrlichia ewingii infection
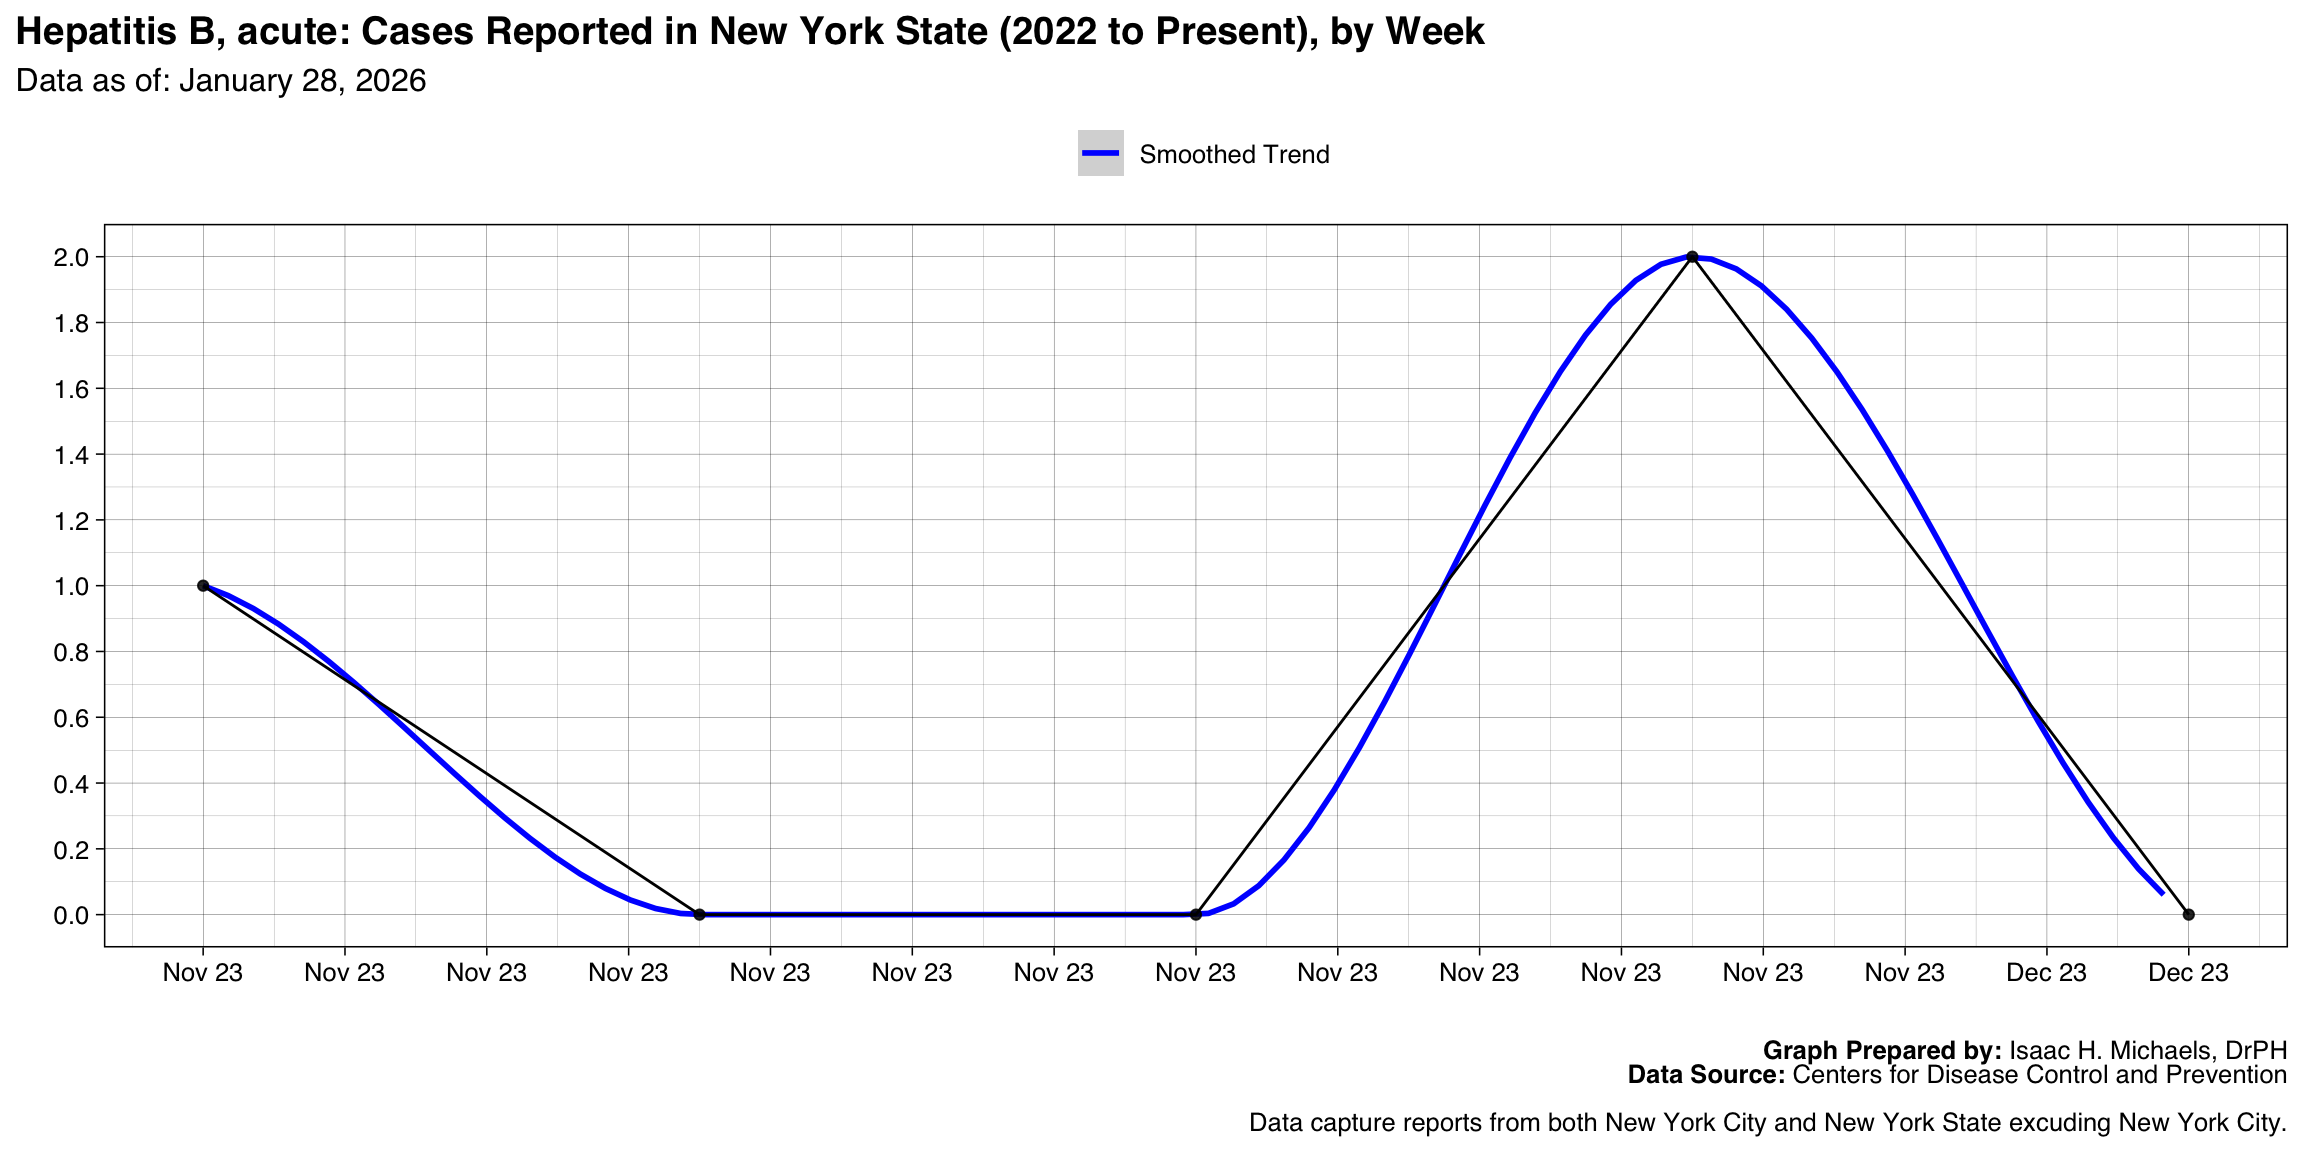
- Hepatitis B, acute
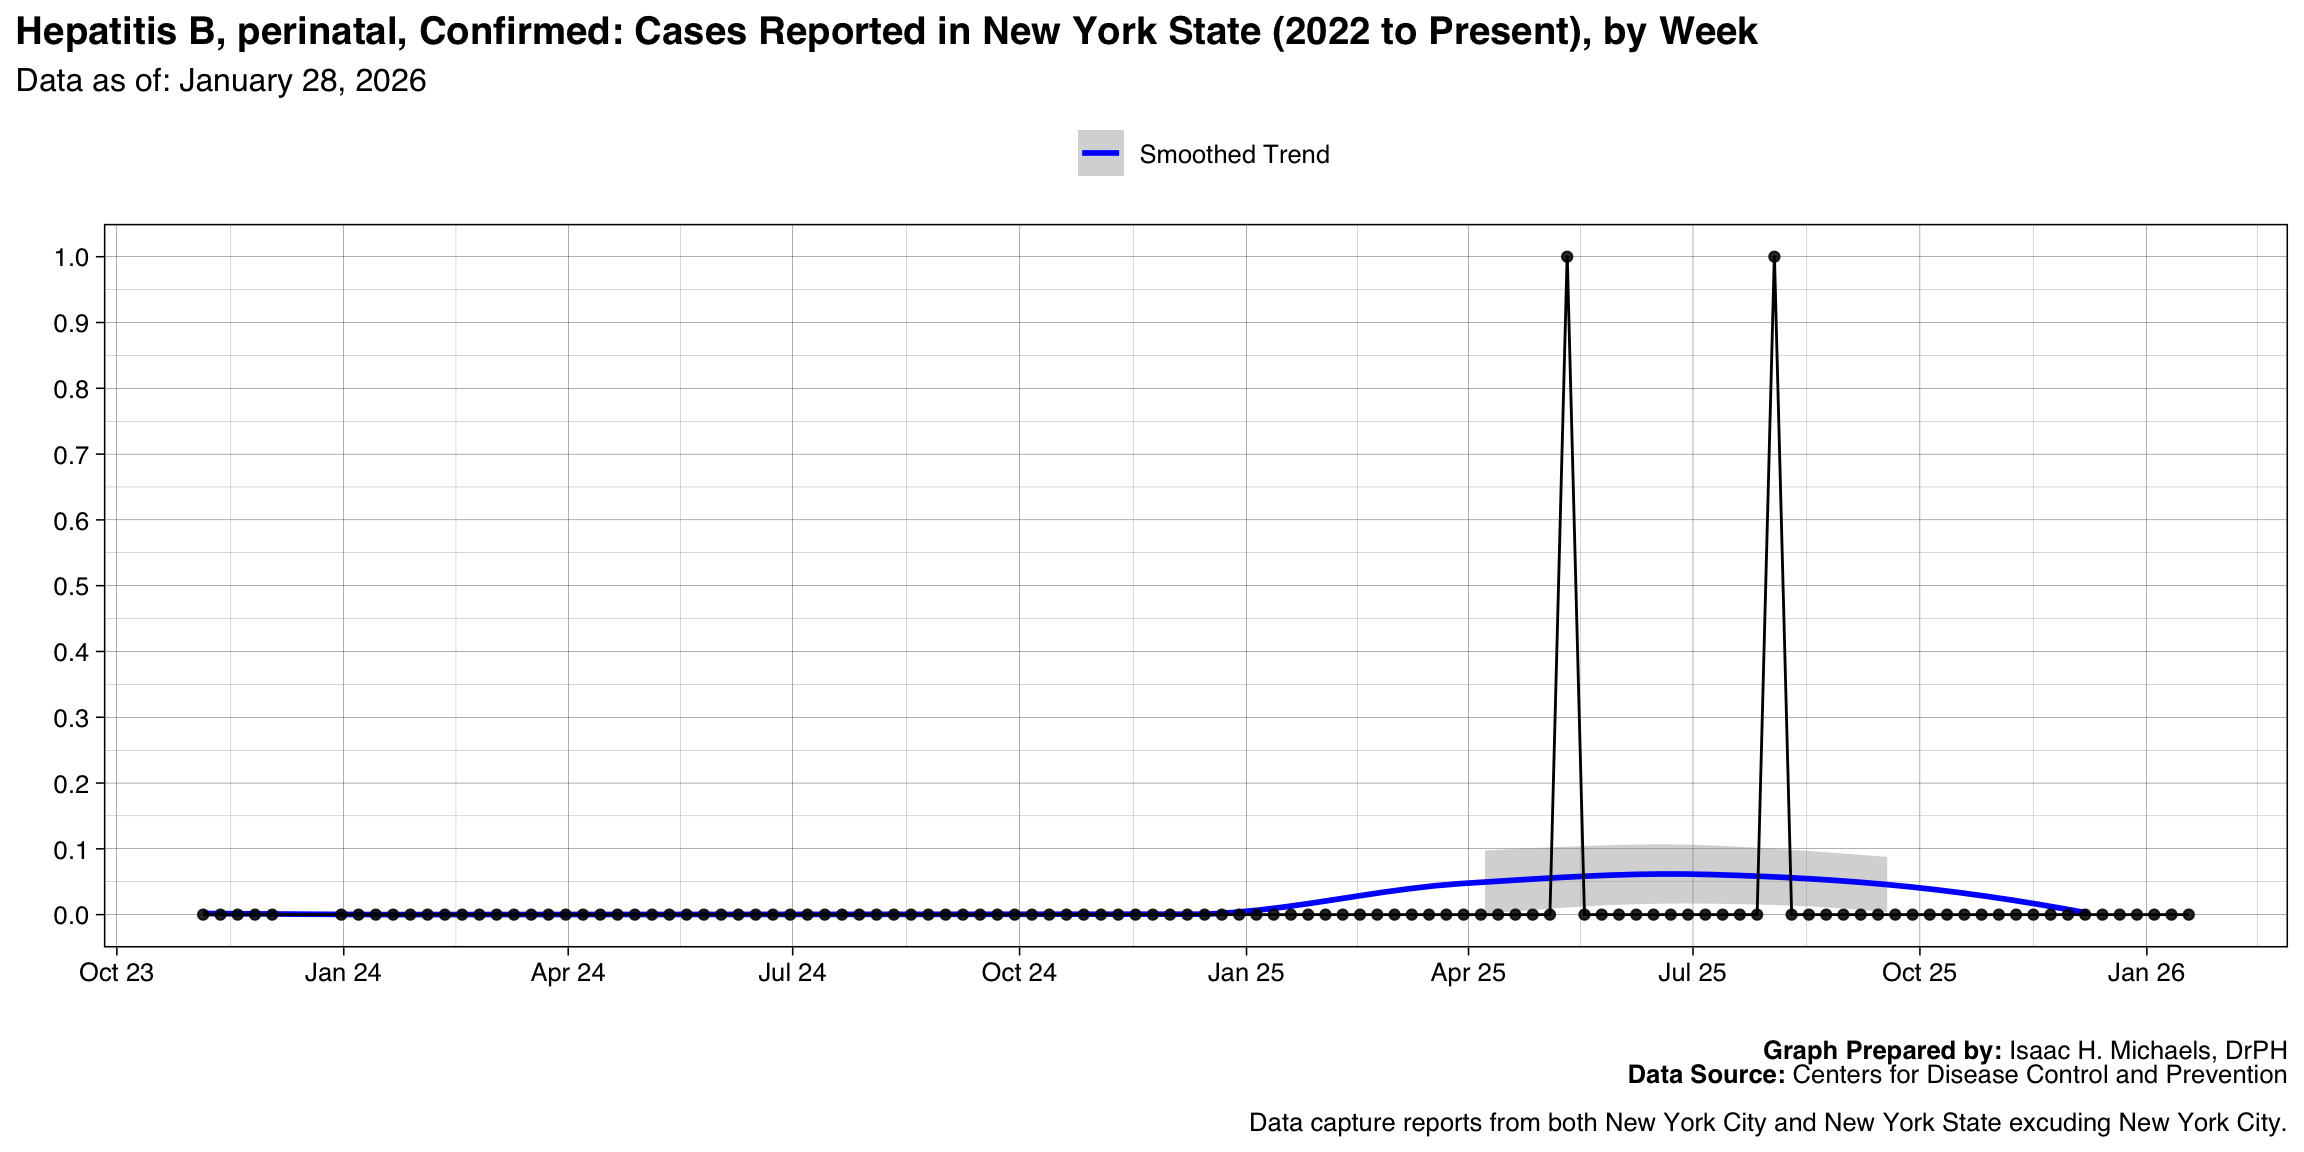
- Hepatitis B, perinatal, Confirmed
- Leprosy (Hansen’s disease)
- Tetanus
- Botulism, Foodborne
- Botulism, Other (wound & unspecified)
- Chancroid
- Hantavirus pulmonary syndrome
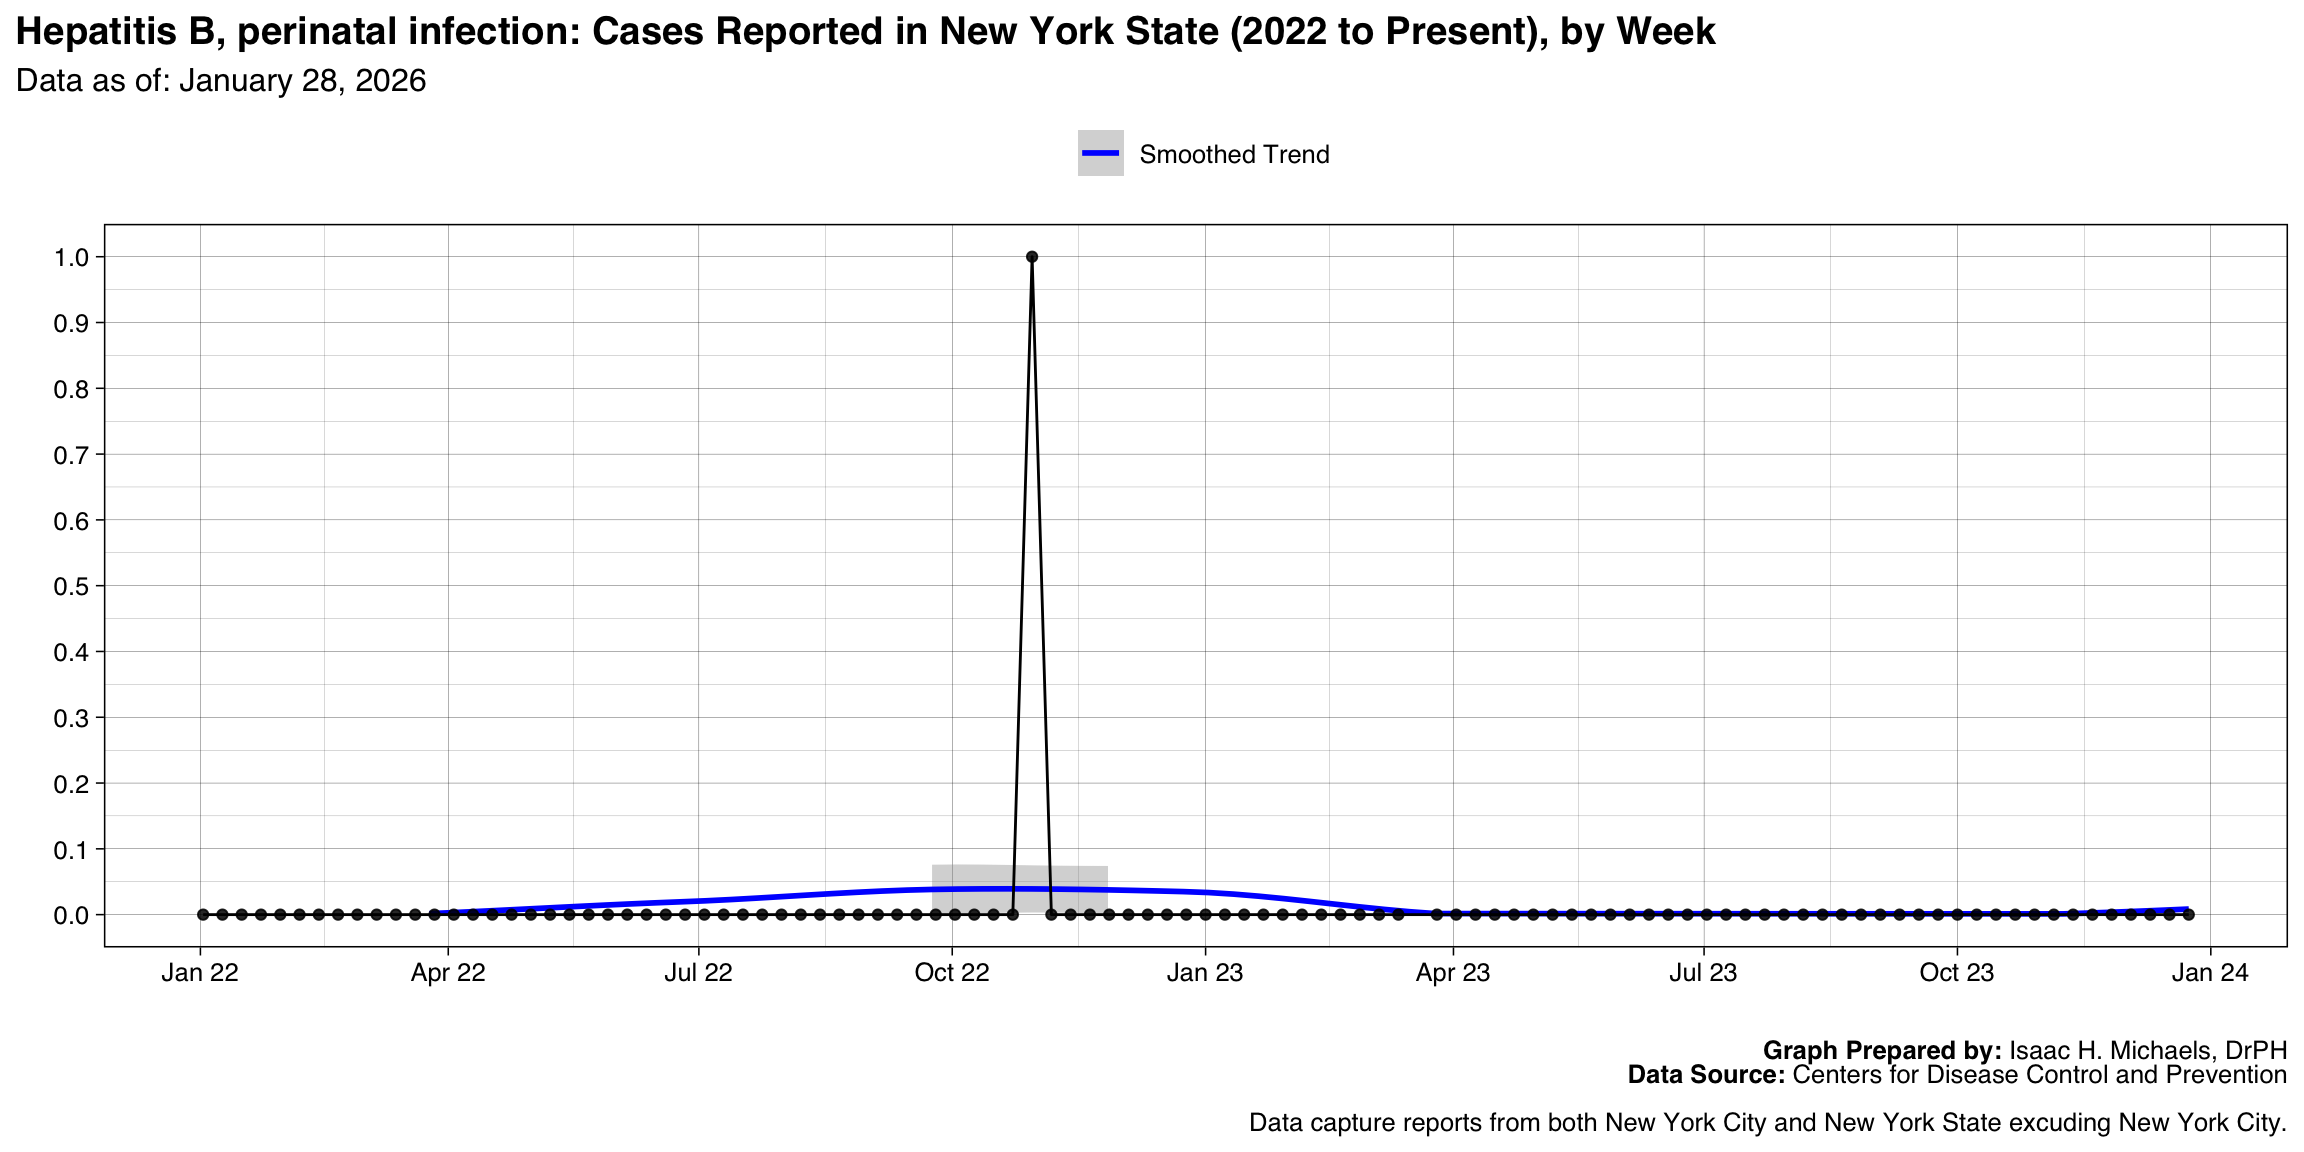
- Hepatitis B, perinatal infection
- Meningococcal disease, Other serogroups
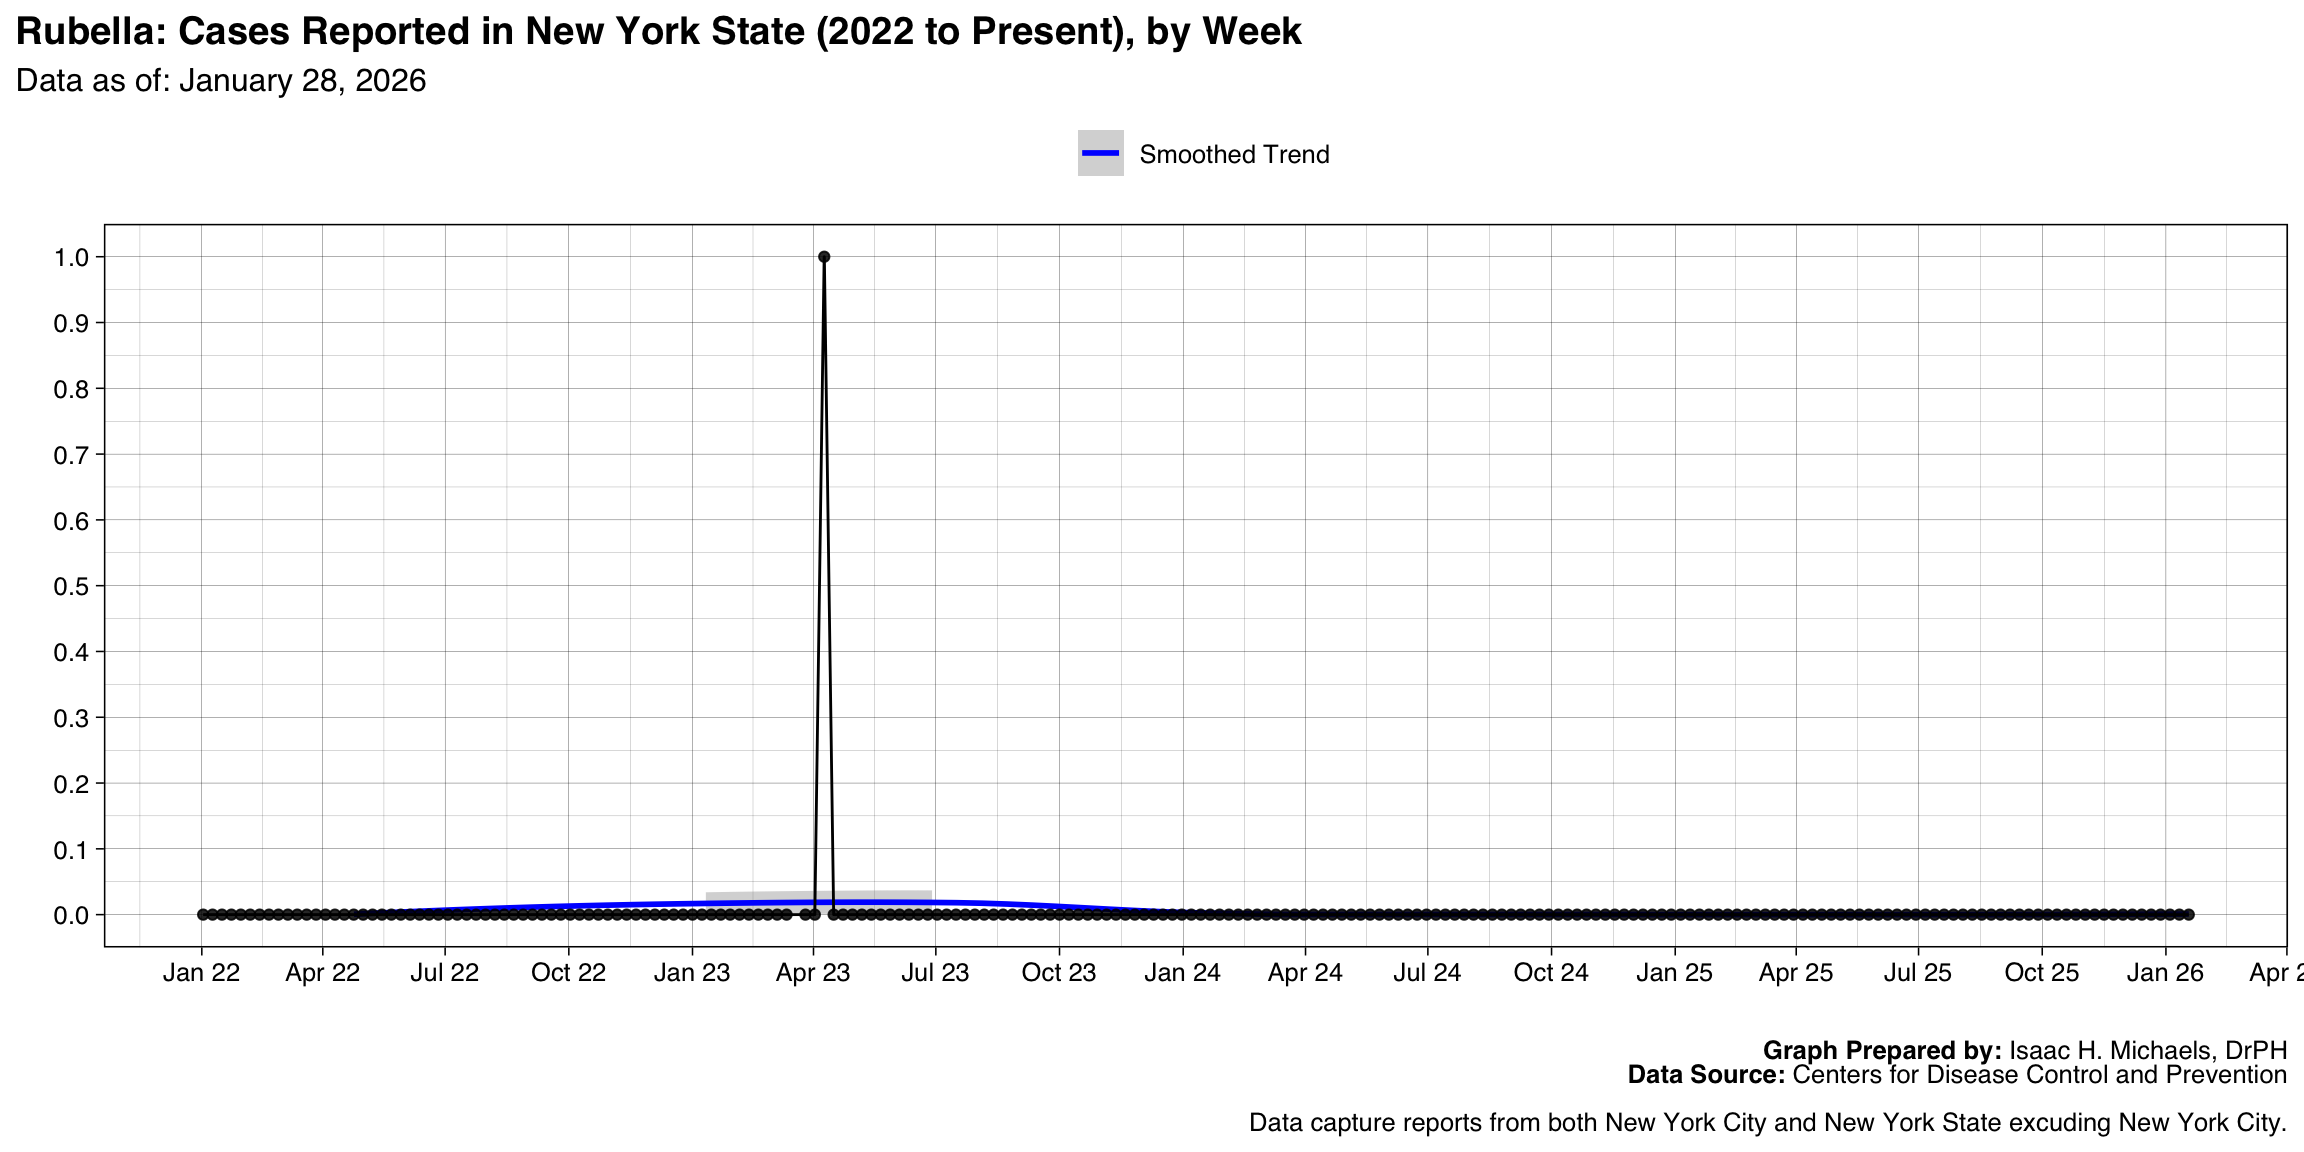
- Rubella
Published: June 13, 2023
Updated: July 29, 2026 at 09:37PM
Welcome
Welcome to my personal data science website, where I focus on epidemiology and public health. On this page, I present data analyses on communicable disease incidence in New York State. The data used in these analyses are obtained from the Centers for Disease Control and Prevention (CDC) through the data.CDC.gov open data platform. The latest data are provisional and subject to updates.
I updated this page on a weekly basis.
Data Overview
The data presented on this page are weekly cases of selected infectious national notifiable diseases in the United States, including New York State. These cases are reported to the National Notifiable Diseases Surveillance System (NNDSS). The NNDSS data reported by the 50 states, New York City, the District of Columbia, and the U.S. territories are collated and published weekly as numbered tables by the CDC.
It’s important to note that the case counts listed in the tables are provisional and may change as additional information becomes available. State health departments report cases to the CDC for weekly publication, and ongoing revisions and delayed reporting can impact the numbers listed in later weeks. For a comprehensive understanding of interpreting these data, please refer to the Guide to Interpreting Provisional and Finalized NNDSS Data.
How to Use These Data
The summary data are now presented in a comprehensive table format with the following columns: * Disease: The name of the notifiable disease. * First MMWR Week with Any Cases Reported: The earliest week of the year when any cases were reported. * Latest MMWR Week with Any Cases Reported: The most recent week with reported cases. * Current Week Reported Cases: The number of cases reported for the current week. * Cumulative Reported Cases: The total number of cases reported so far for the year. * Trend: A sparkline visualization summarizing the weekly longitudinal trends in reported cases.
This table provides an at-a-glance overview of disease incidence, highlighting patterns over time and identifying changes in reporting. The trend column’s sparklines enable quick visual assessments of fluctuations or seasonality in disease activity.
The longitudinal trend graphs, displayed as line graphs, show the incidence of each disease over time. Each disease is represented by a separate line on the graph, allowing you to observe changes in disease occurrence and identify any seasonal patterns or long-term trends.
Why Are These Data Important?
These data play a crucial role in monitoring and understanding communicable diseases in New York State. By tracking the incidence of notifiable diseases, public health officials can identify outbreaks, assess the impact of interventions, and allocate resources effectively. These data inform public health policies and interventions aimed at preventing and controlling the spread of infectious diseases.
What Do These Data Show?
The table and graphs together provide a comprehensive view of the temporal and cumulative patterns of disease incidence: * First and Latest Weeks with Cases: These columns in the table help identify the duration of disease activity over the year. * Current Week Reported Cases: This column offers a snapshot of the most recent case data. * Cumulative Cases: This total highlights the overall burden of each disease. * Trend (Sparklines): The sparkline visualizations in the table illustrate how the weekly incidence has varied, revealing potential patterns, seasonality, or anomalies. * Longitudinal Trend Graphs: These graphs provide a detailed visualization of weekly case trends for each disease, allowing for a deeper understanding of changes over time and enabling the identification of specific weeks with spikes or declines.
What Do These Data Not Show?
While these data provide valuable information on the incidence of notifiable diseases, it’s important to note their limitations. The data only include cases that are reported to the CDC and may not capture the complete picture of disease incidence in New York State. Some cases may go unreported or may not meet the criteria for being included in the notifiable diseases list.
Additionally, the data are provisional and subject to updates. As more information becomes available and reporting is finalized, the case counts may change. Therefore, it’s crucial to interpret these data with caution and consider them as a snapshot of disease incidence at a specific point in time.
Implications for Public Health Practice
These data have significant implications for public health practice in New York State. By analyzing the trends and patterns in disease incidence, public health professionals can identify priority areas for intervention, allocate resources effectively, and develop targeted strategies to prevent and control communicable diseases. The insights gained from these data can inform decision-making, guide surveillance efforts, and contribute to evidence-based public health policies.
Thank you for visiting my website and exploring the data analyses on communicable disease incidence in New York State. I hope these insights contribute to your understanding of the public health landscape and support efforts to improve population health.
Executive Summary1
[1] “MEMORANDUM*To:** New York State Public Health Leadership*From:** Public Health Analysis Unit*Date:** July 24, 2026*Subject:** Weekly Notifiable Disease Surveillance Briefing (Week Ending July 19, 2026)the week ending July 19, 2026, the diseases with the highest reported incidence were Chlamydia (1,369), Gonorrhea (660), and Campylobacteriosis (287). Notable week-over-week changes include significant increases in Chlamydia (+308 cases, +29.0%) and Gonorrhea (+214 cases, +48.0%). Conversely, reports of chronic Hepatitis B and C decreased substantially after a reporting spike in the prior week. The emergence of tick-borne diseases like Anaplasmosis (9 cases) and Babesiosis (5 cases) is consistent with seasonal expectations.trends require further review. First, the rise in Chlamydia and Gonorrhea continues a four-week pattern, with cases now 93.4% and 297.6% higher, respectively, than in late June. This sustained increase may suggest heightened transmission but could also reflect non-epidemiologic factors like recent screening campaigns or reporting artifacts. Further analysis of demographic and geographic data is recommended to clarify these drivers., a significant drop in chronic Hepatitis B (-113 cases, -91.9%) and chronic Hepatitis C (-131 combined cases, approx. -80%) was observed. This appears to be a data correction following an anomalous spike in the previous week, likely due to administrative factors such as clearing a reporting backlog, rather than a true change in disease prevalence. Current case counts for these conditions have returned to prior levels.”
Summary Table
| Notifiable Diseases in New York State, 2022 to Present | |||||
| Disease |
MMWR Weeks with Any Cases Reported
|
Reported Cases
|
Trend | ||
|---|---|---|---|---|---|
| First Week | Latest Week | Current Week | Cumulative | ||
| Chlamydia trachomatis infection | 2022-01-02 | 2026-07-19 | 1,369 | 239,084 | |
| Gonorrhea | 2022-01-02 | 2026-07-19 | 660 | 89,577 | |
| Campylobacteriosis | 2022-01-02 | 2026-07-19 | 287 | 27,735 | |
| Salmonellosis (excluding Salmonella Typhi infection and Salmonella Paratyphi infection) | 2022-01-02 | 2026-07-19 | 151 | 13,498 | |
| Hepatitis B, chronic, Confirmed | 2023-12-31 | 2026-07-19 | 10 | 12,952 | |
| Shigellosis | 2022-01-02 | 2026-07-19 | 56 | 10,745 | |
| Giardiasis | 2022-01-02 | 2026-07-19 | 49 | 9,691 | |
| Hepatitis C, chronic, Probable | 2023-12-31 | 2026-07-19 | 10 | 6,674 | |
| Invasive pneumococcal disease, all ages, Confirmed | 2022-01-02 | 2026-07-19 | 26 | 6,628 | |
| Hepatitis C, chronic, Confirmed | 2023-12-31 | 2026-07-19 | 25 | 6,451 | |
| Shiga toxin-producing Escherichia coli (STEC) | 2022-01-02 | 2026-07-19 | 55 | 4,536 | |
| Syphilis, Primary and secondary | 2022-01-02 | 2026-07-19 | 13 | 4,192 | |
| Ehrlichiosis and Anaplasmosis, Anaplasma phagocytophilum infection | 2022-01-02 | 2023-12-24 | NA | 3,346 | |
| Pertussis | 2022-01-16 | 2026-07-19 | 7 | 3,125 | |
| Tuberculosis | 2022-01-02 | 2026-07-19 | 14 | 2,913 | |
| Legionellosis | 2022-01-02 | 2026-07-19 | 11 | 2,356 | |
| Hepatitis B, chronic, Probable | 2024-03-10 | 2026-07-19 | 10 | 2,305 | |
| Babesiosis | 2022-01-30 | 2024-12-22 | NA | 2,292 | |
| Cryptosporidiosis | 2022-01-02 | 2026-07-19 | 15 | 1,968 | |
| Haemophilus influenzae, invasive disease, All ages, all serotypes | 2022-01-02 | 2026-07-19 | 10 | 1,779 | |
| Cyclosporiasis | 2022-02-20 | 2026-07-19 | 88 | 1,187 | |
| Hepatitis C, acute, Confirmed | 2022-03-27 | 2026-07-19 | 1 | 605 | |
| Vibriosis (any species of the family Vibrionaceae, other than toxigenic Vibrio cholerae O1 or O139), Probable | 2022-02-20 | 2026-07-19 | 19 | 568 | |
| Mpox | 2023-12-31 | 2026-07-19 | 1 | 521 | |
| Invasive pneumococcal disease, all ages, Probable | 2022-01-02 | 2026-07-12 | 0 | 407 | |
| Ehrlichiosis and Anaplasmosis, Ehrlichia chaffeensis infection | 2022-01-02 | 2023-12-10 | NA | 356 | |
| Listeriosis, Confirmed | 2022-01-02 | 2026-07-19 | 4 | 345 | |
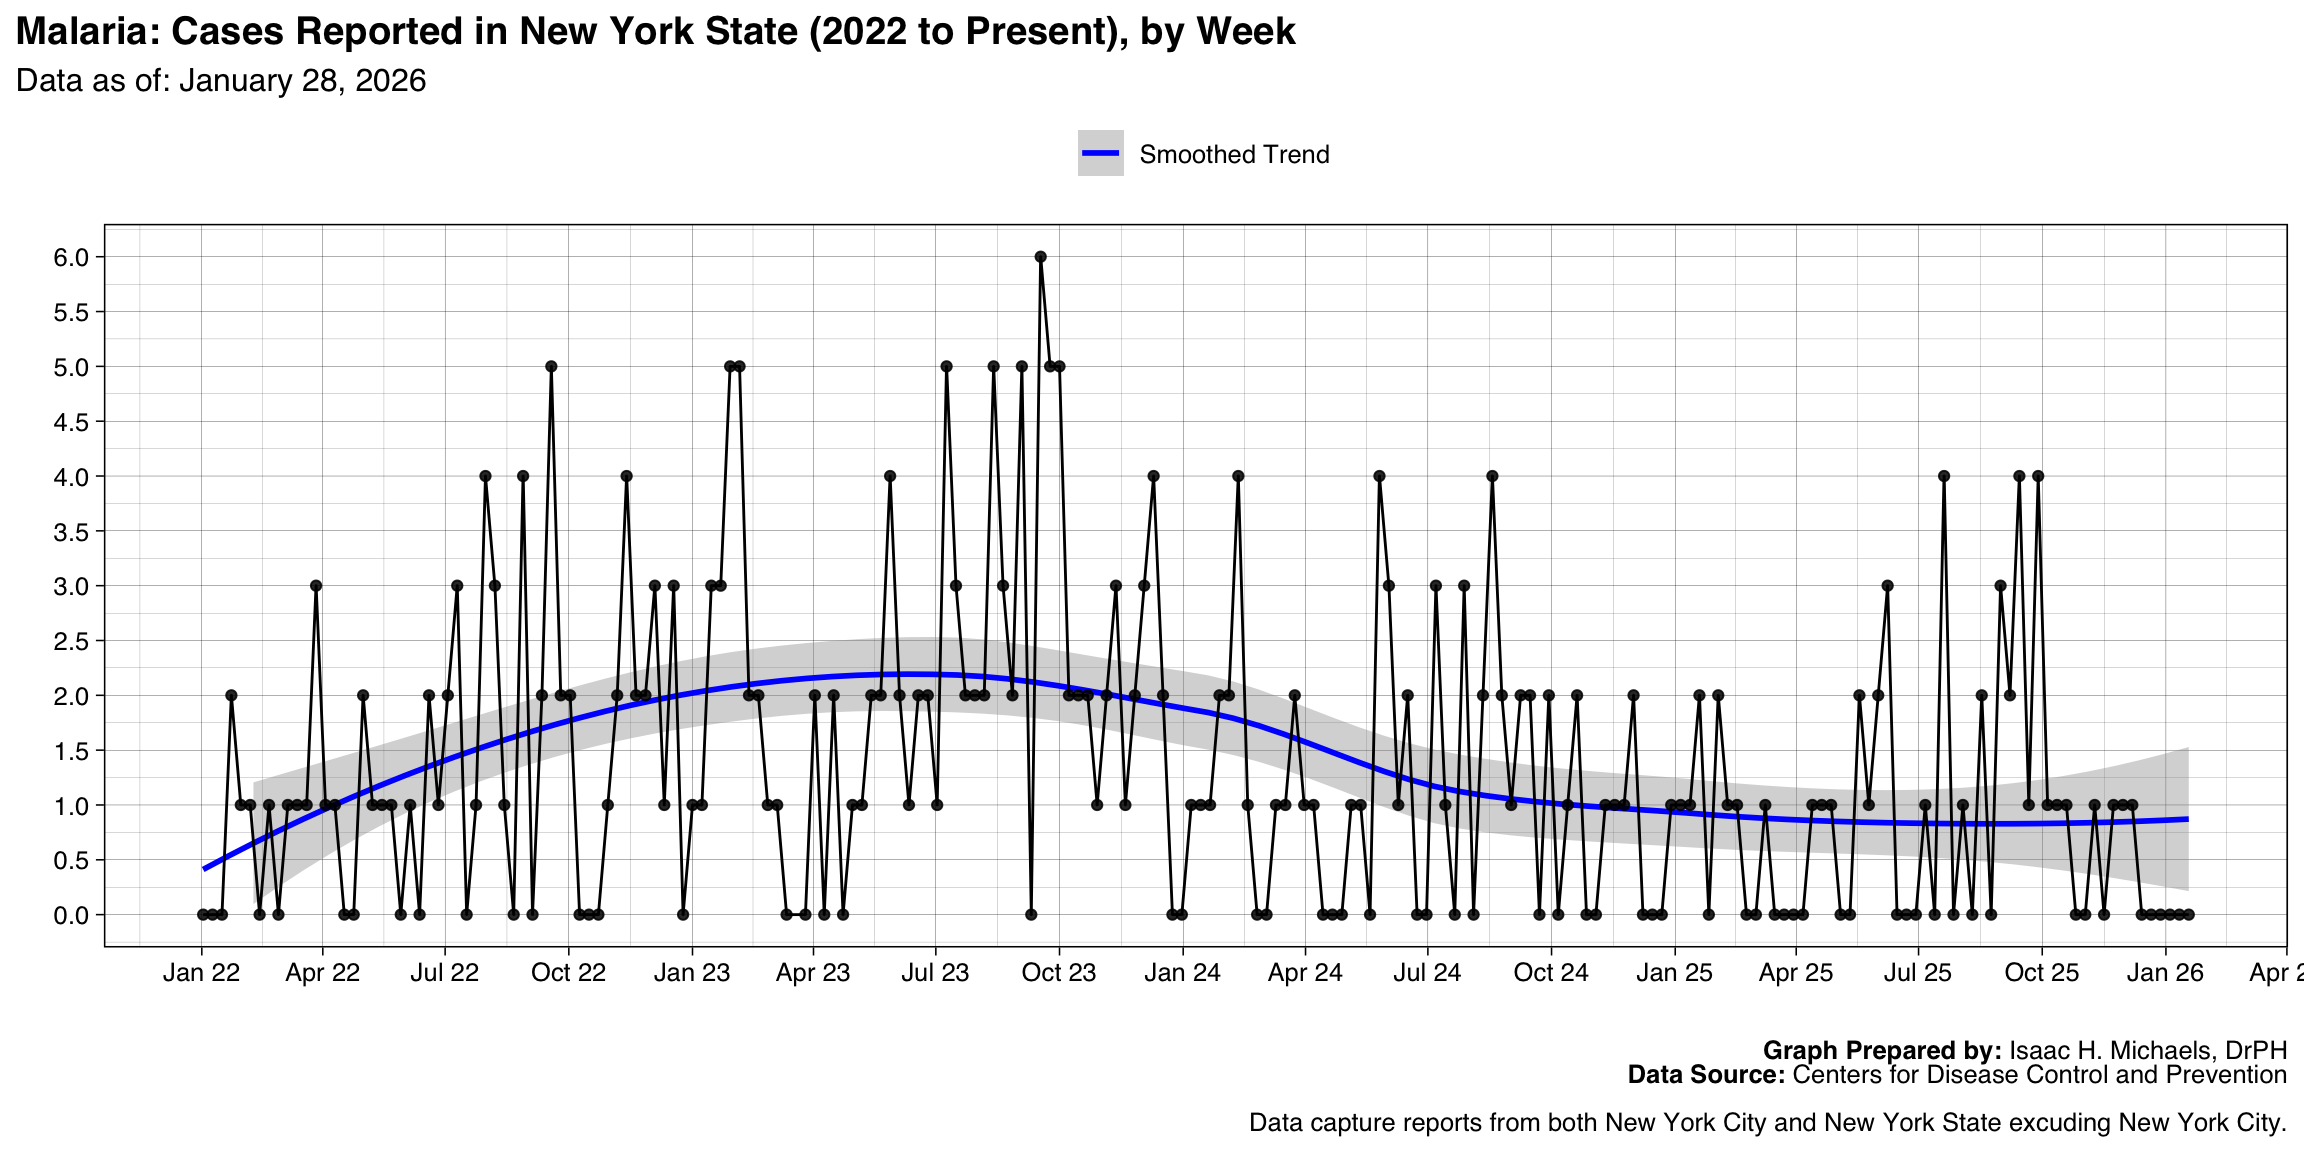
| Malaria | 2022-01-23 | 2026-07-12 | 0 | 310 | |
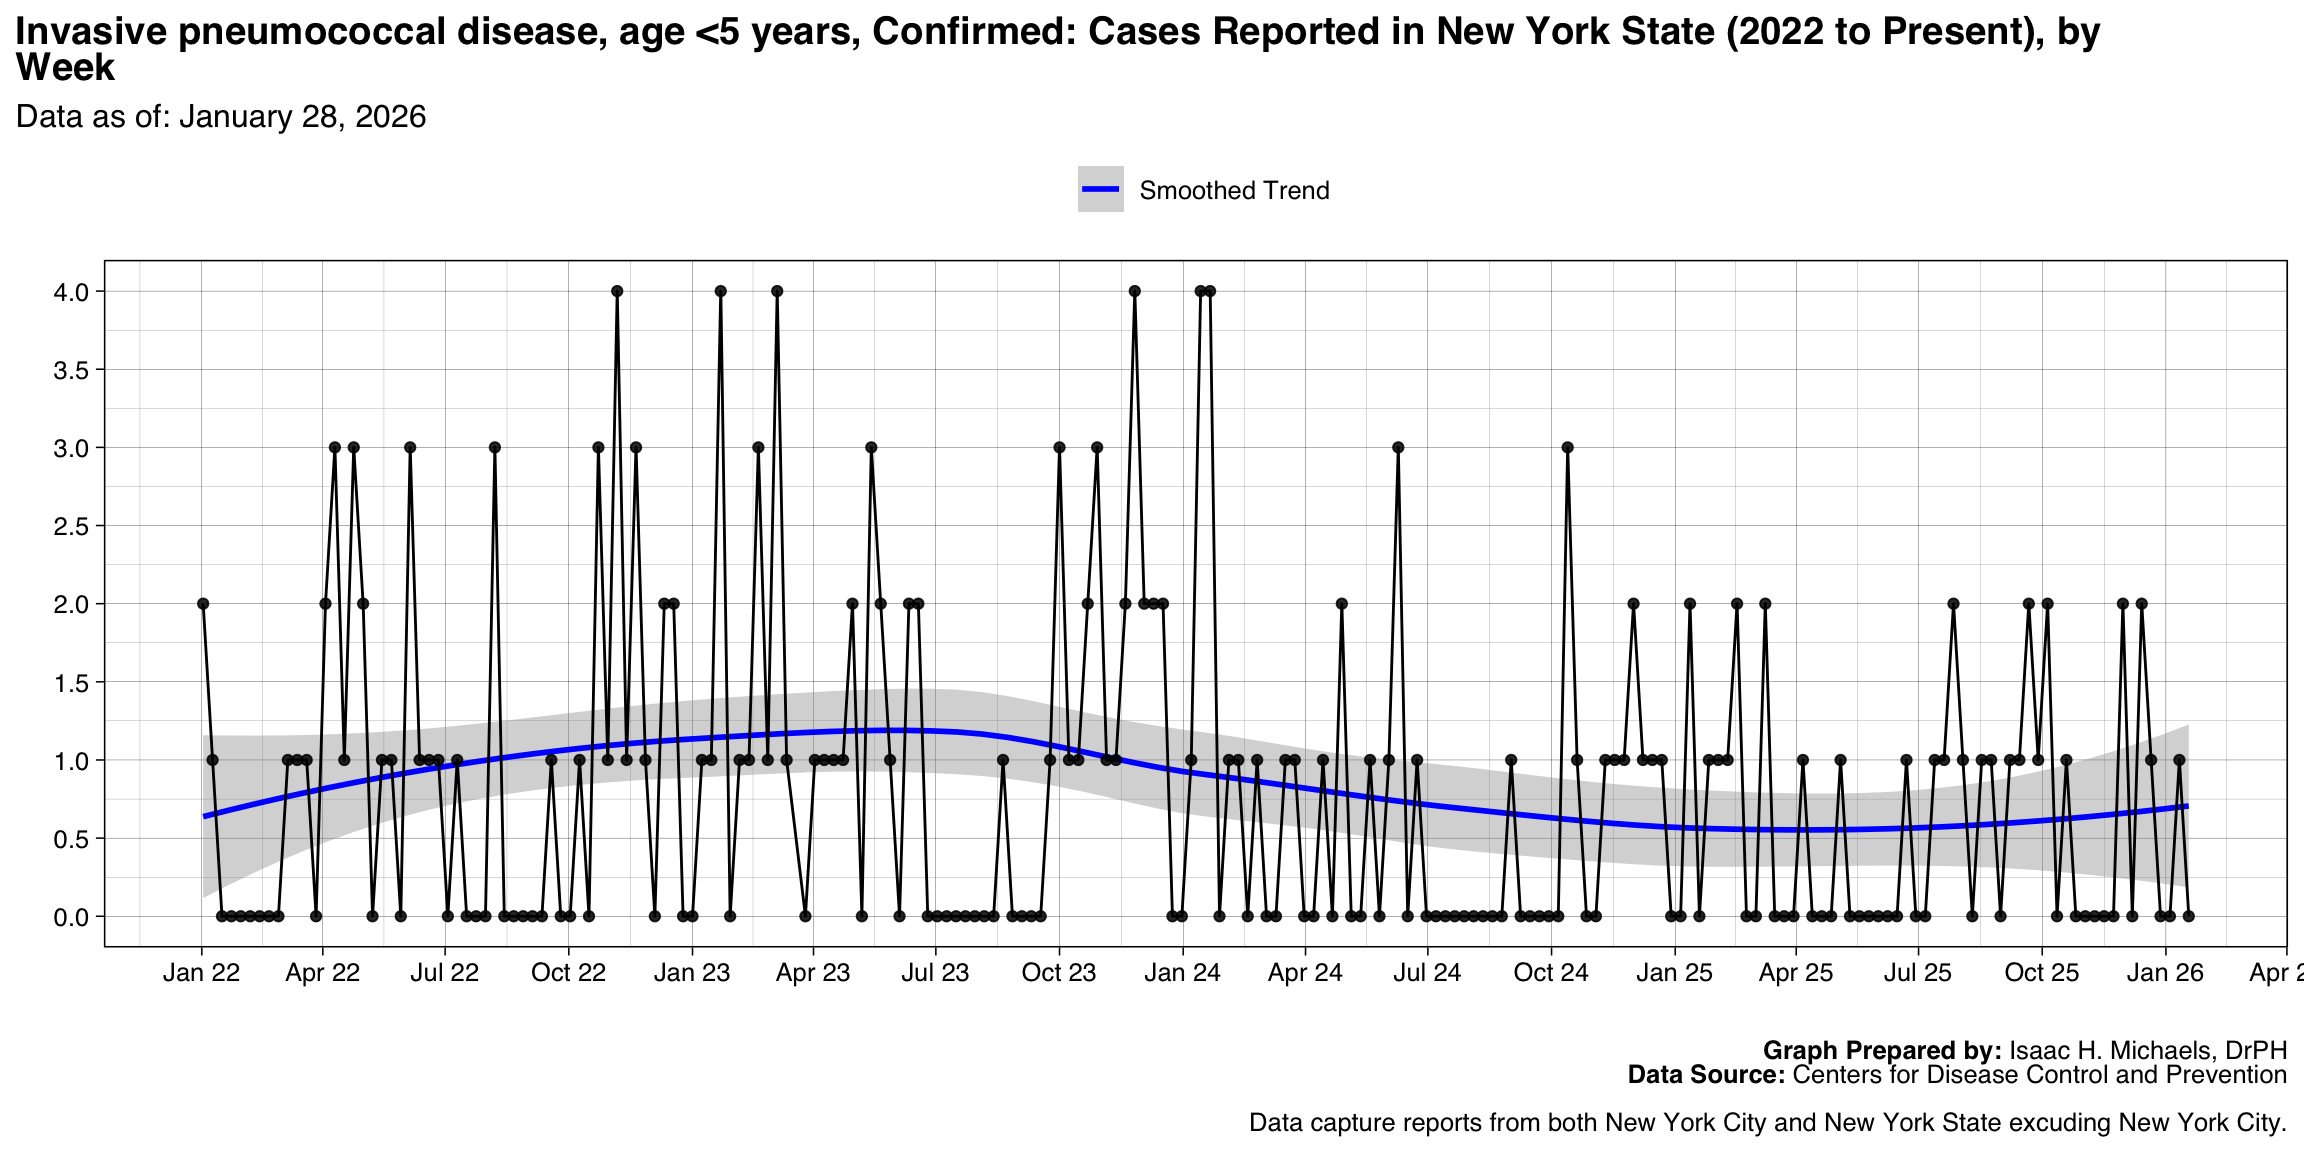
| Invasive pneumococcal disease, age <5 years, Confirmed | 2022-01-02 | 2026-07-19 | 1 | 196 | |
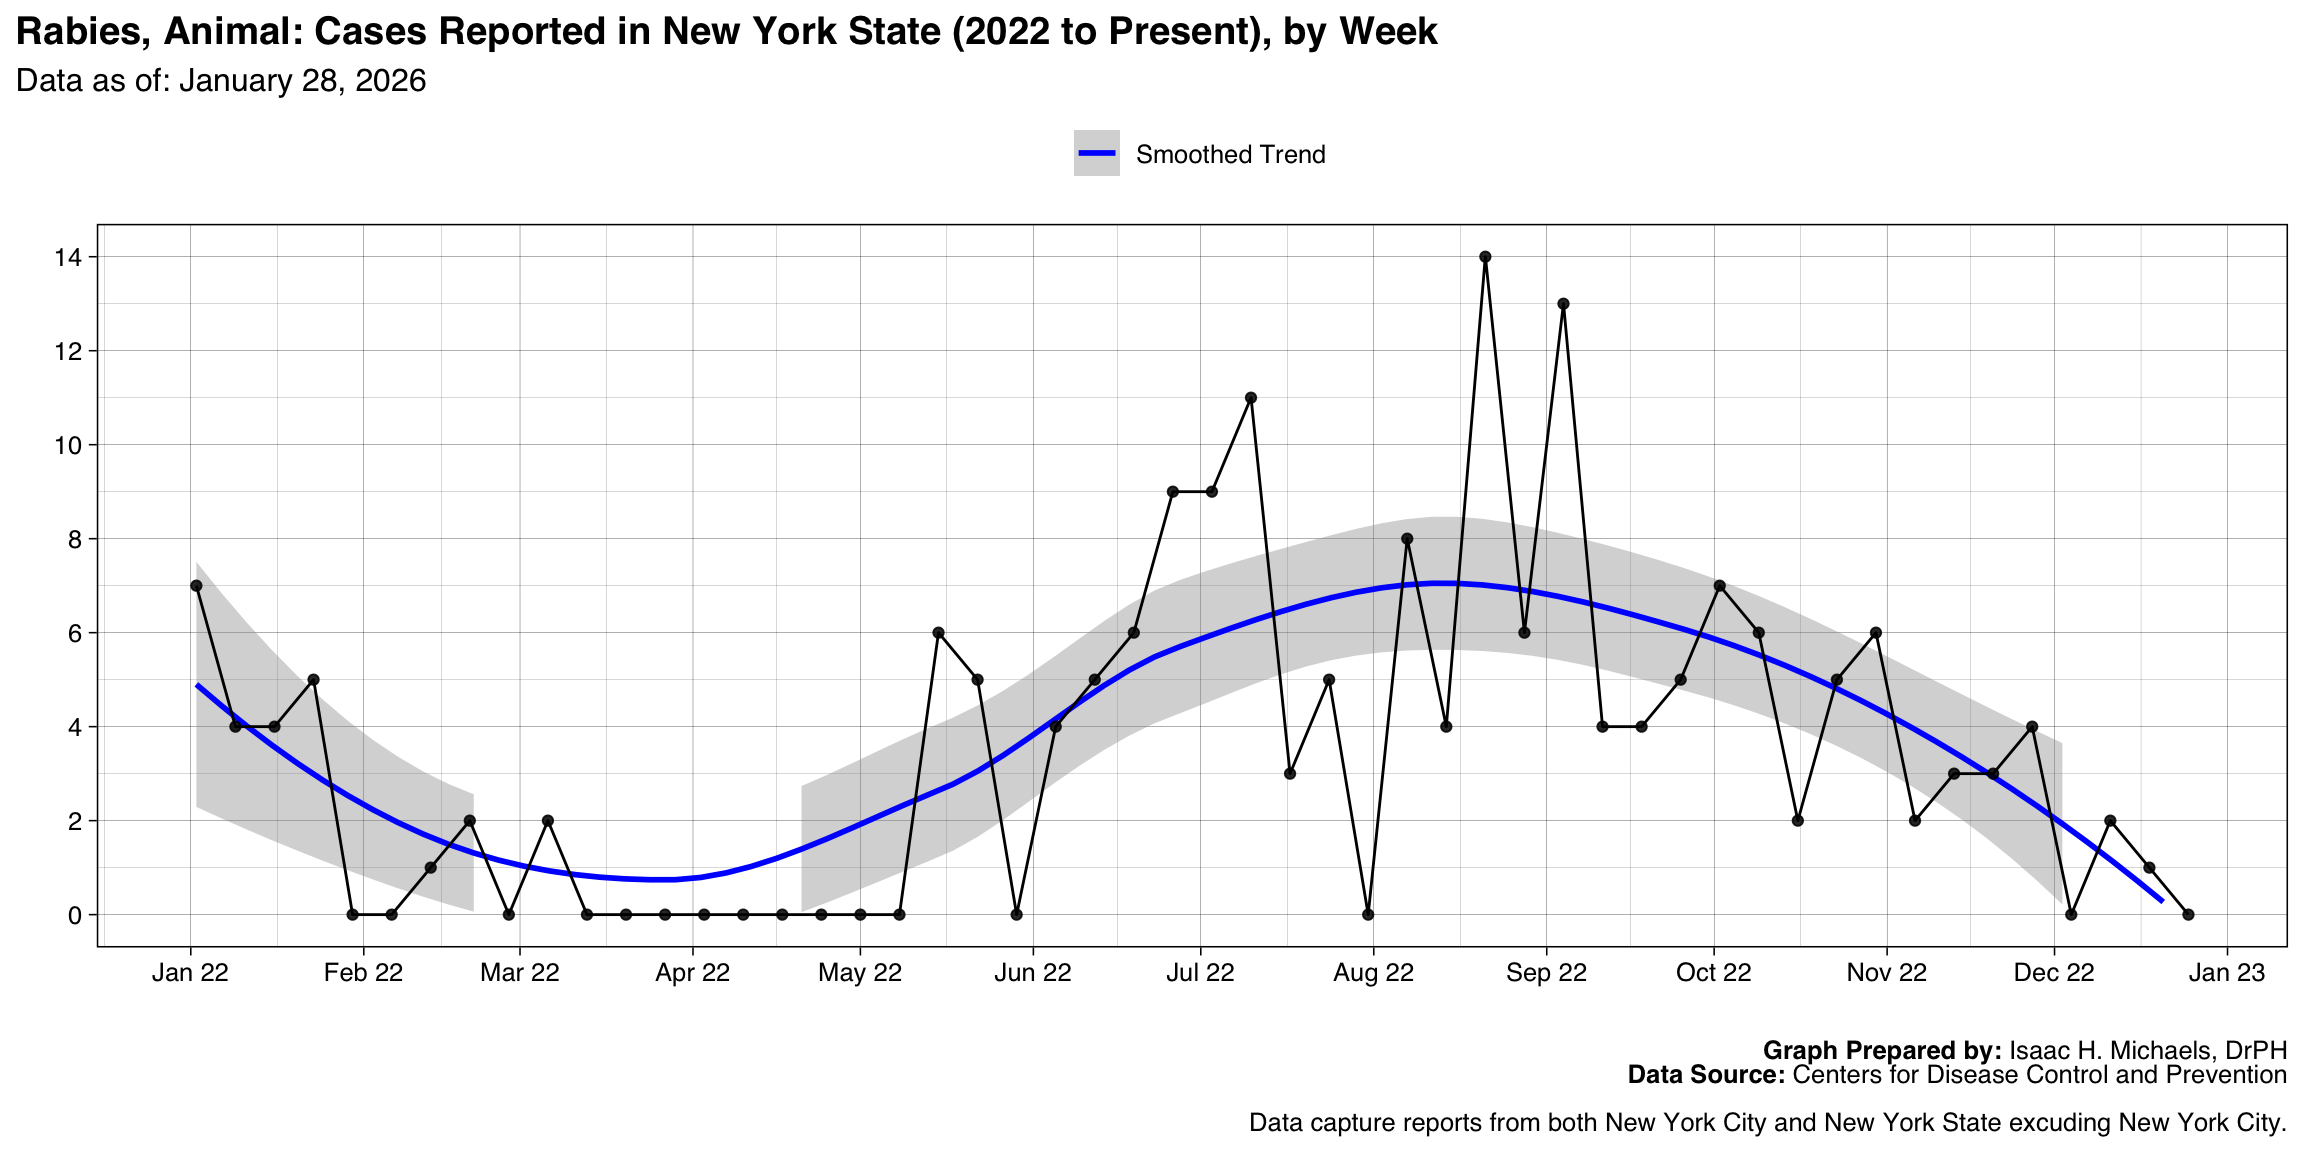
| Rabies, Animal | 2022-01-02 | 2022-12-18 | NA | 187 | |
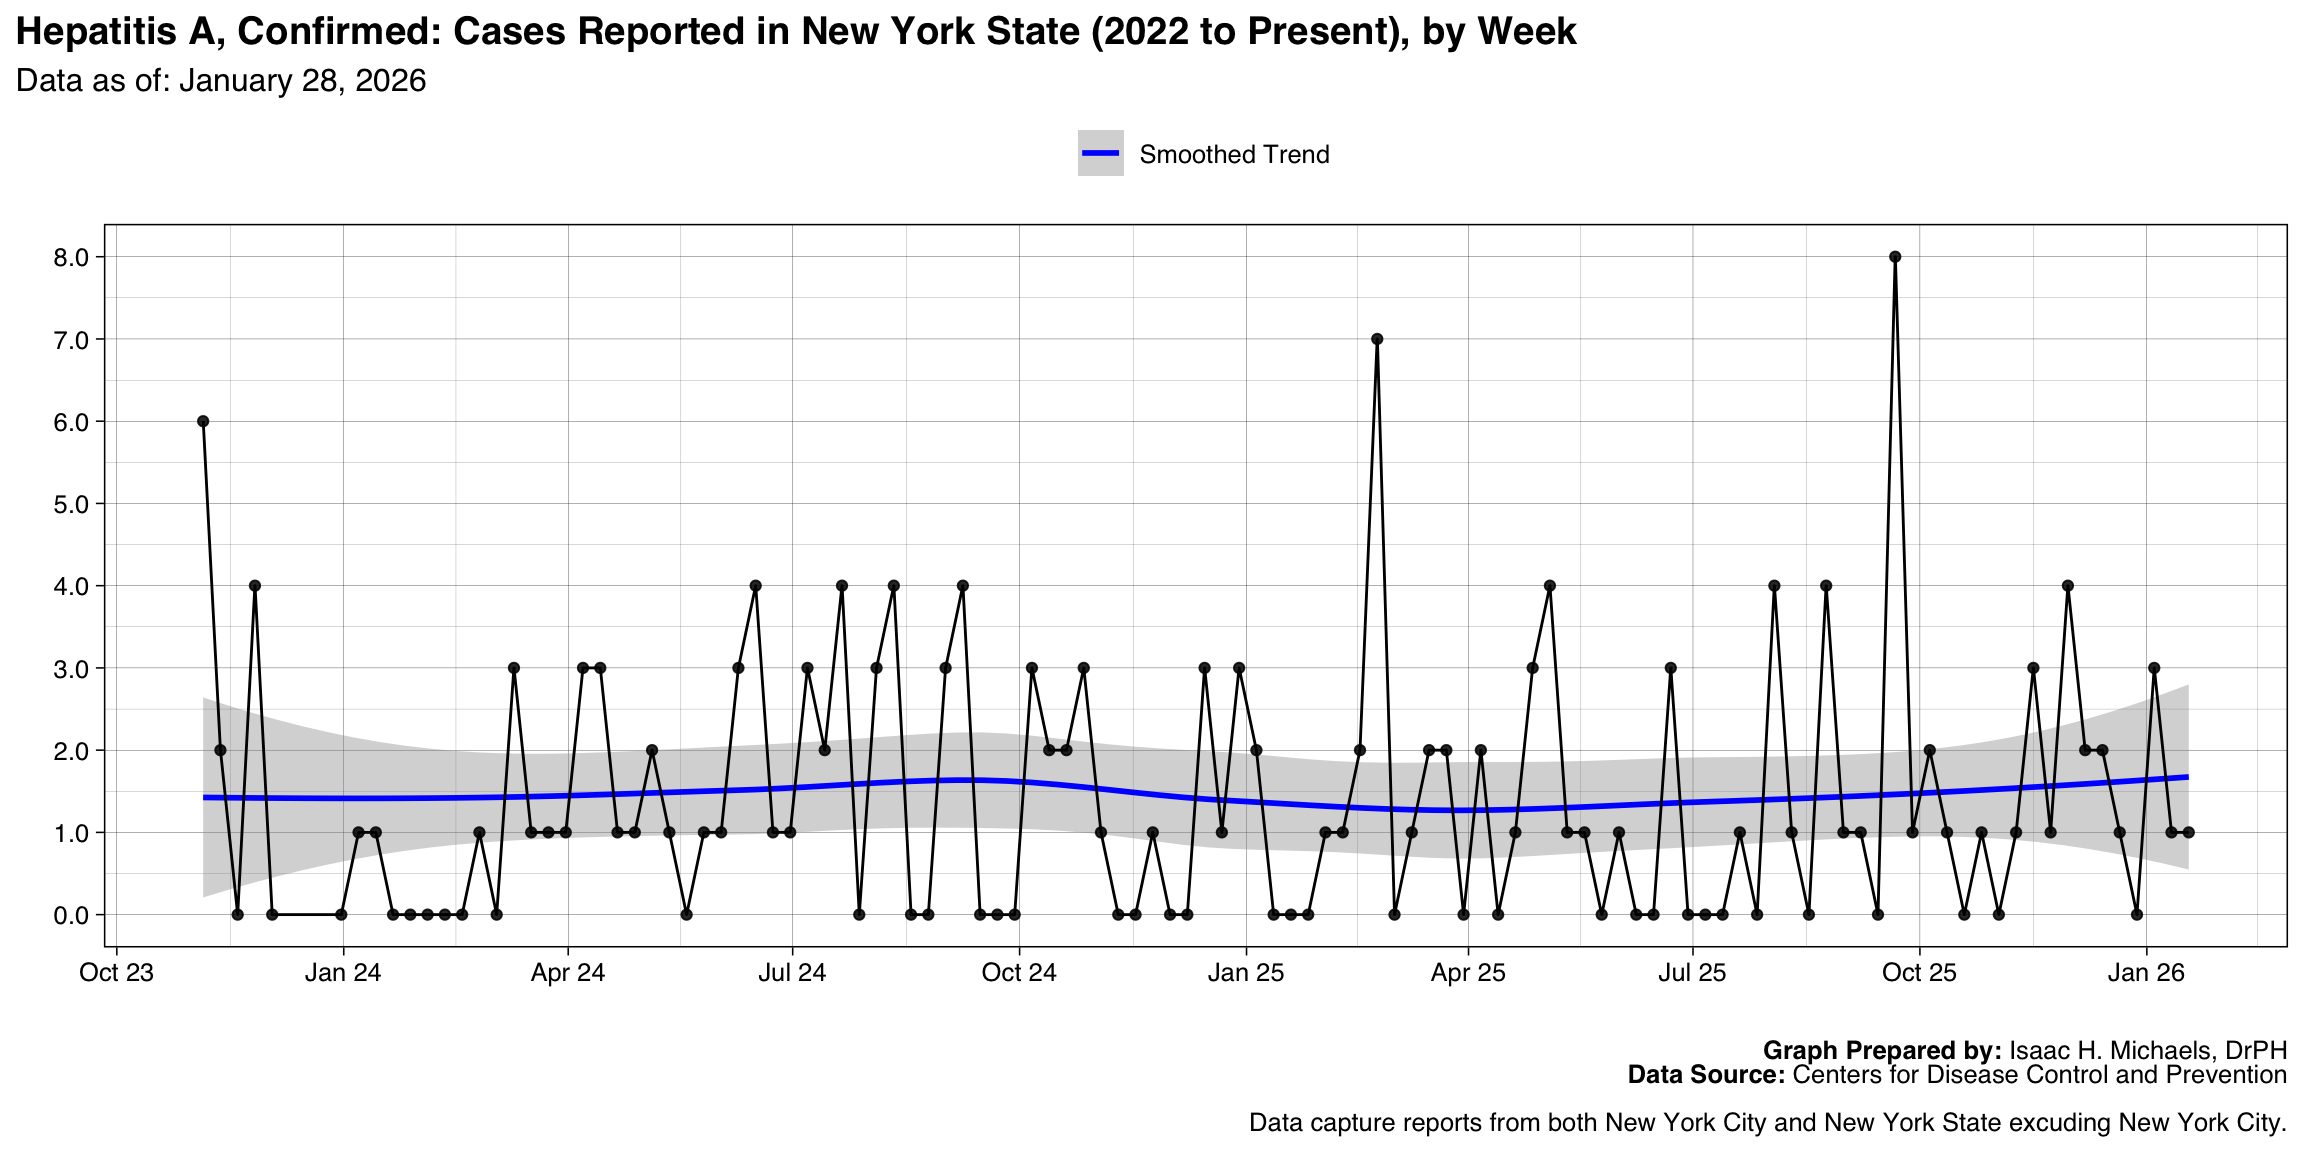
| Hepatitis A, Confirmed | 2023-11-05 | 2026-07-12 | 0 | 184 | |
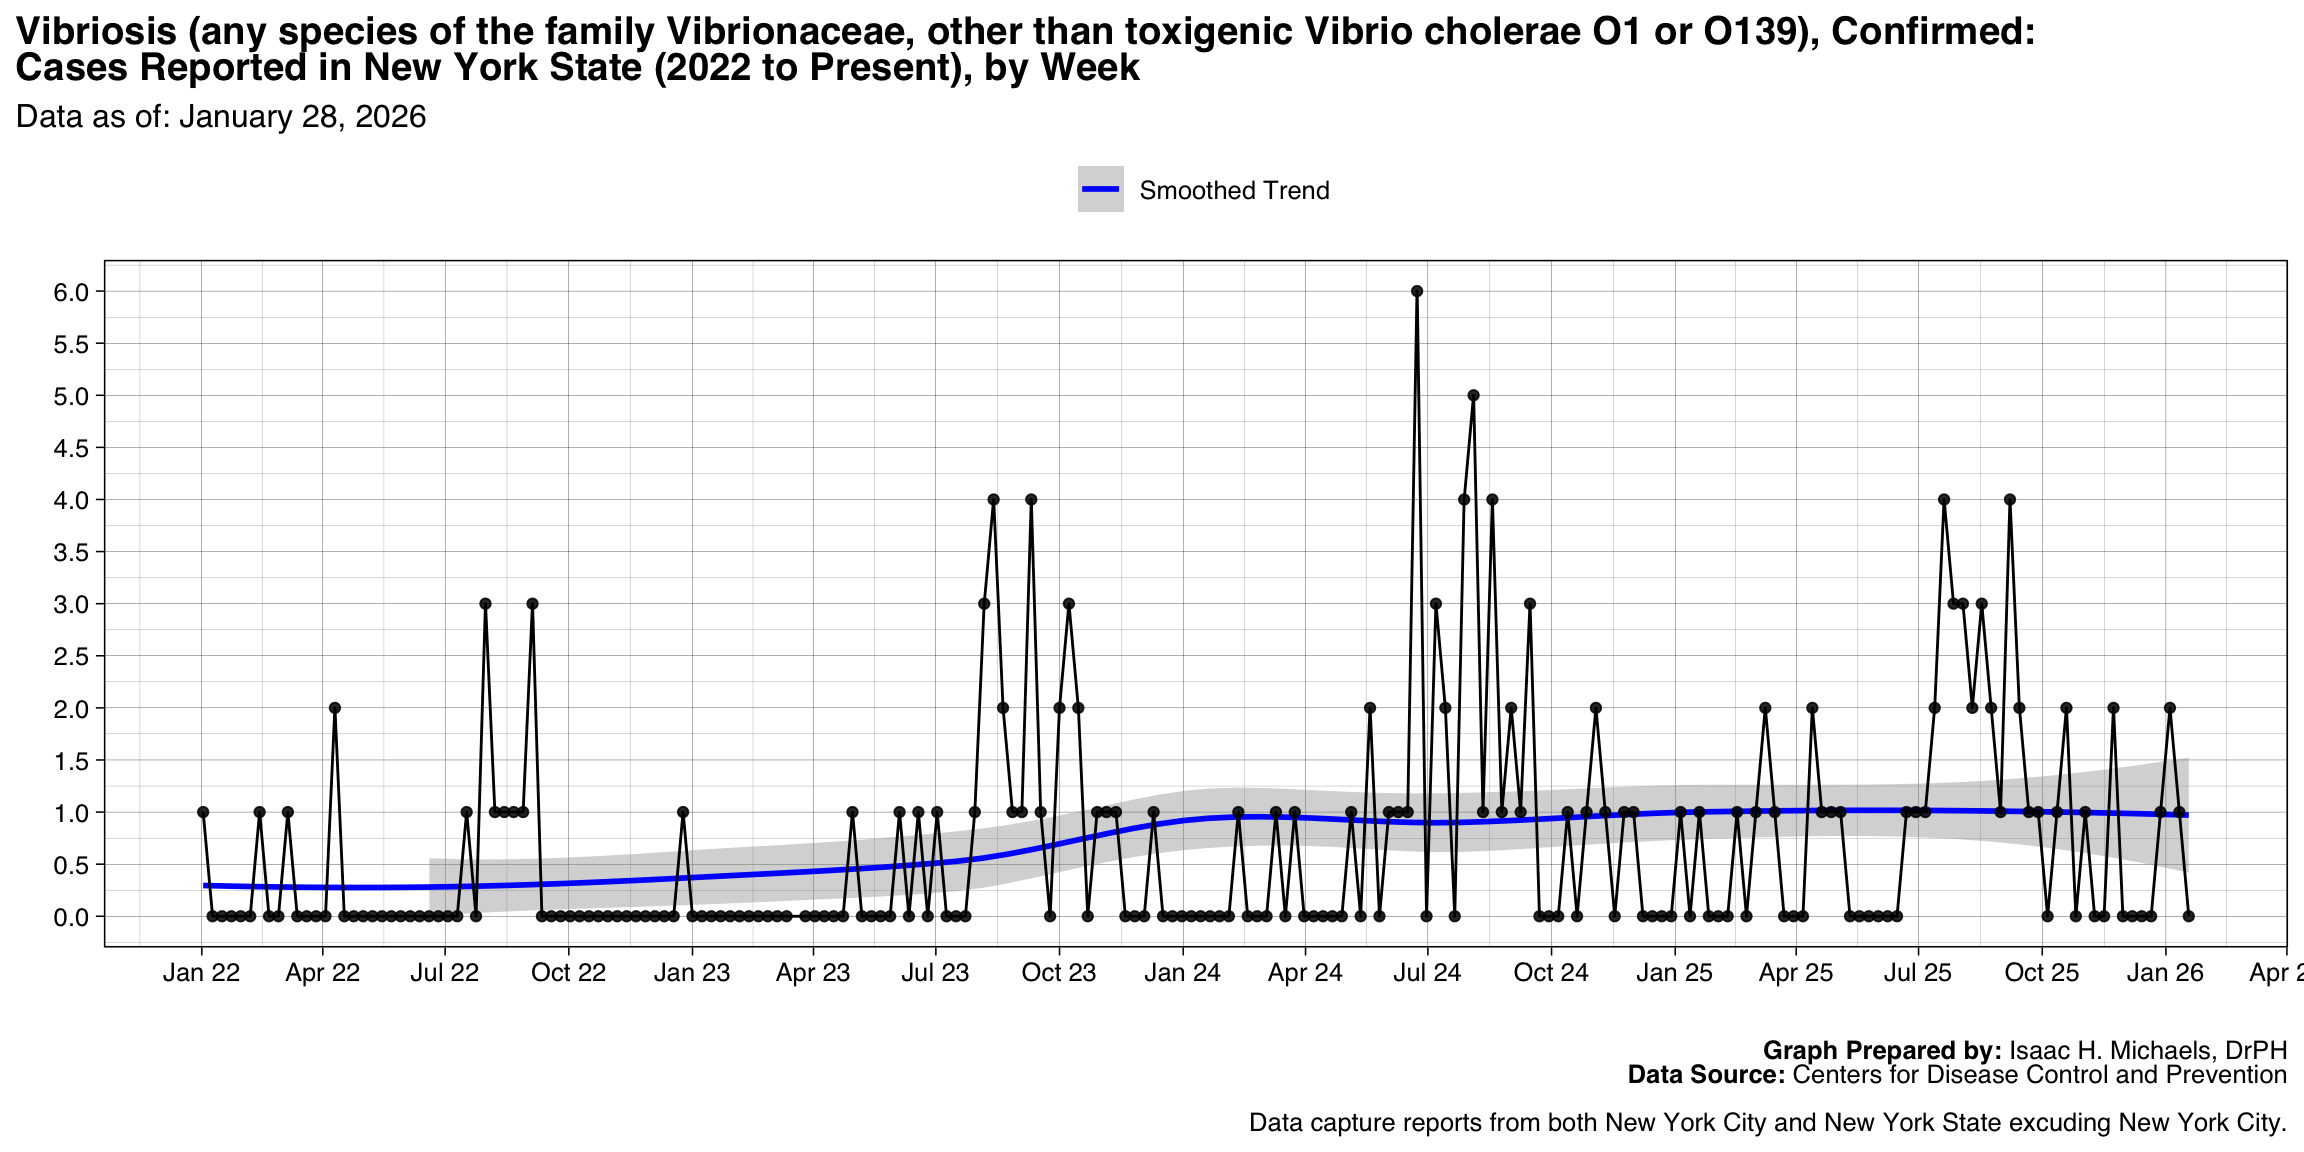
| Vibriosis (any species of the family Vibrionaceae, other than toxigenic Vibrio cholerae O1 or O139), Confirmed | 2022-01-02 | 2026-07-19 | 6 | 180 | |
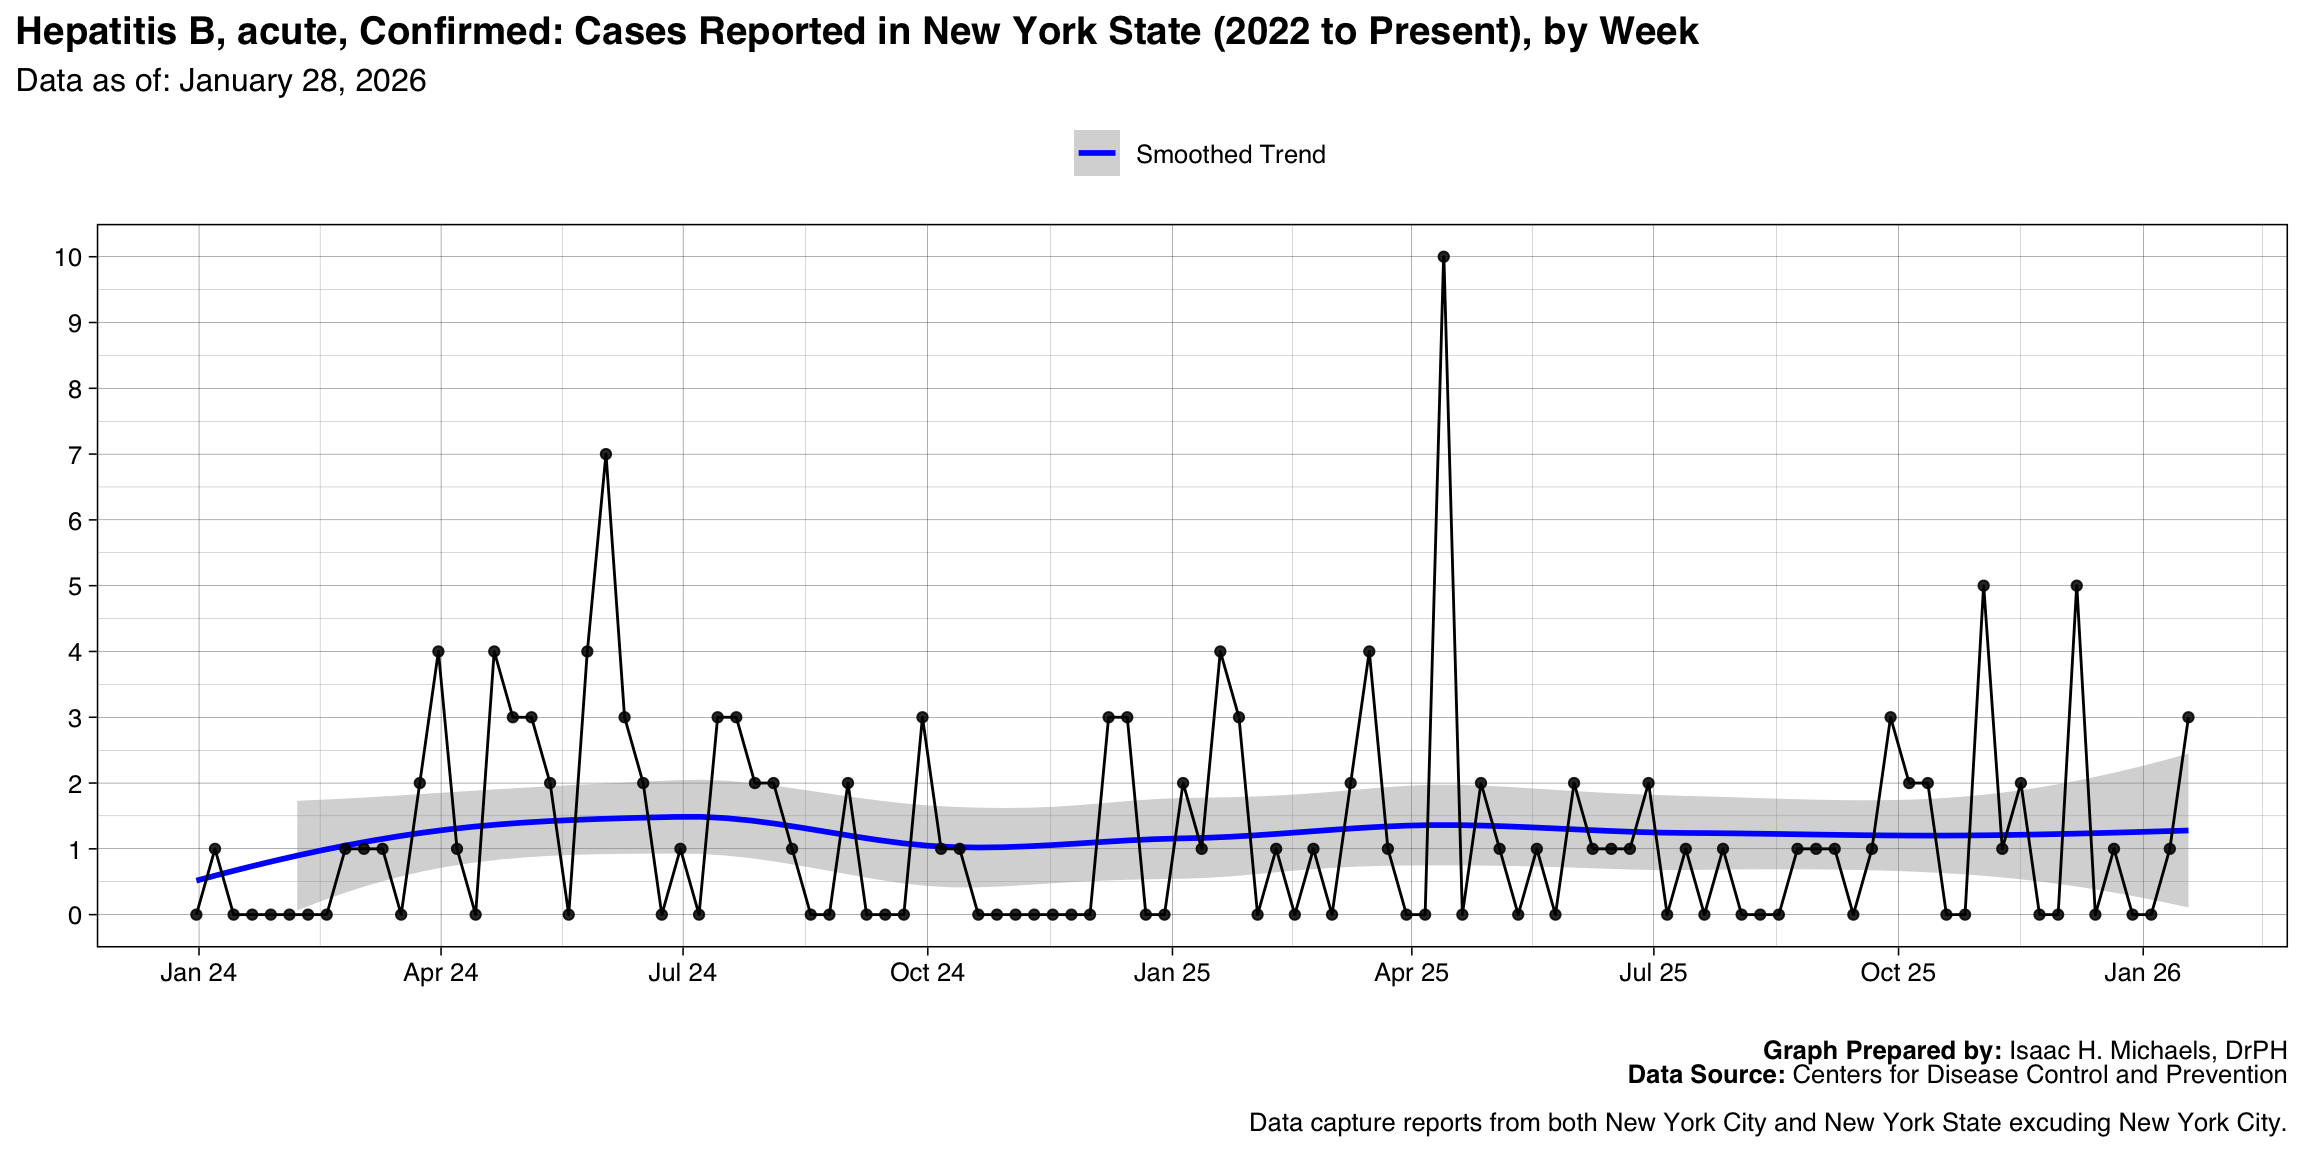
| Hepatitis B, acute, Confirmed | 2024-01-07 | 2026-07-19 | 1 | 168 | |
| Meningococcal disease, All serogroups | 2022-01-02 | 2026-06-14 | 0 | 167 | |
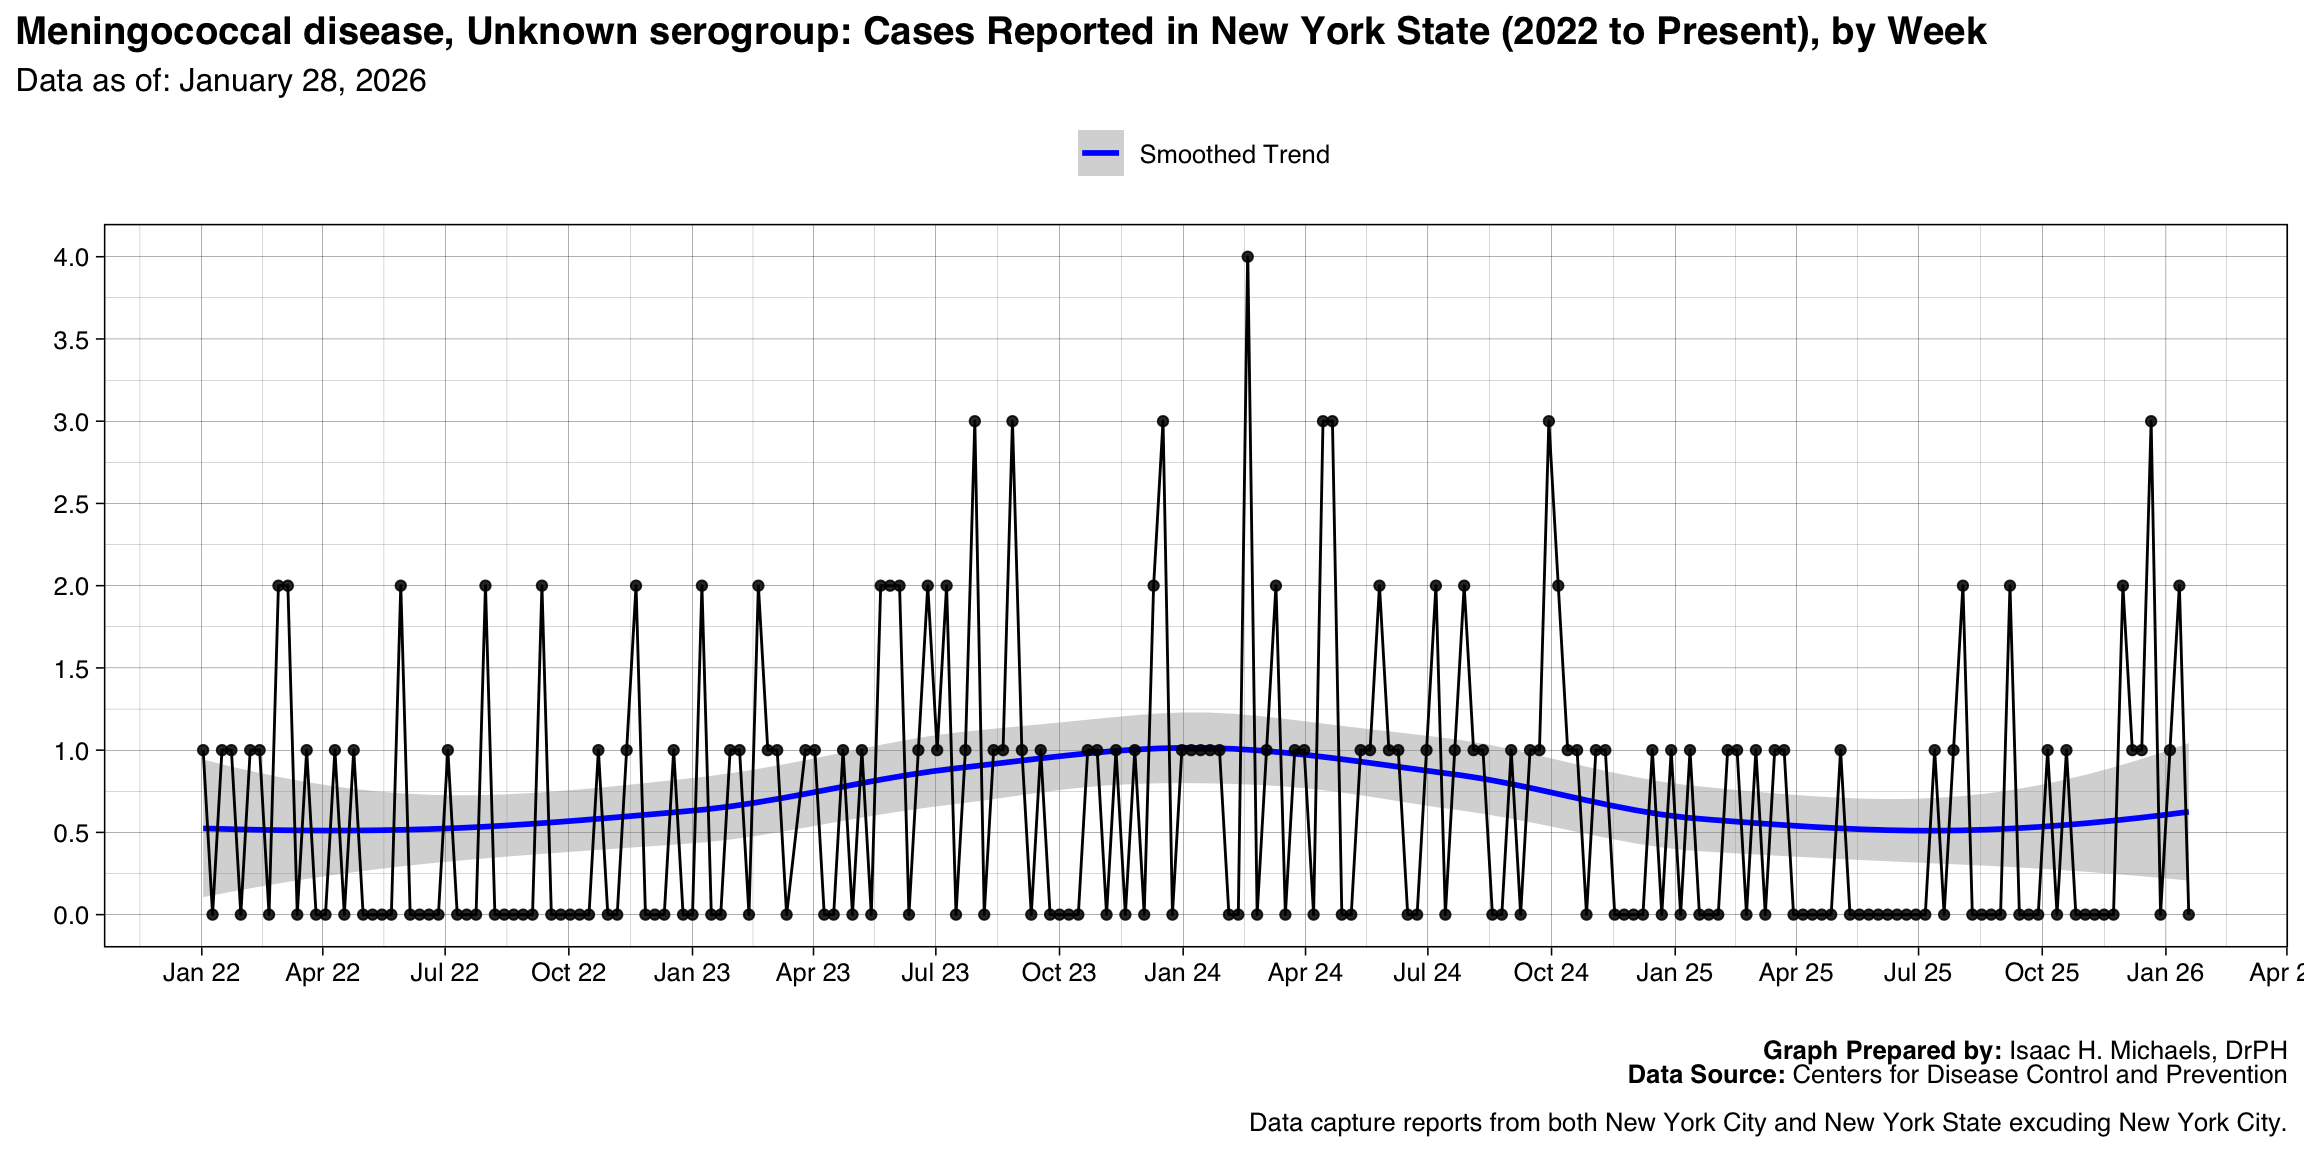
| Meningococcal disease, Unknown serogroup | 2022-01-02 | 2026-06-14 | 0 | 156 | |
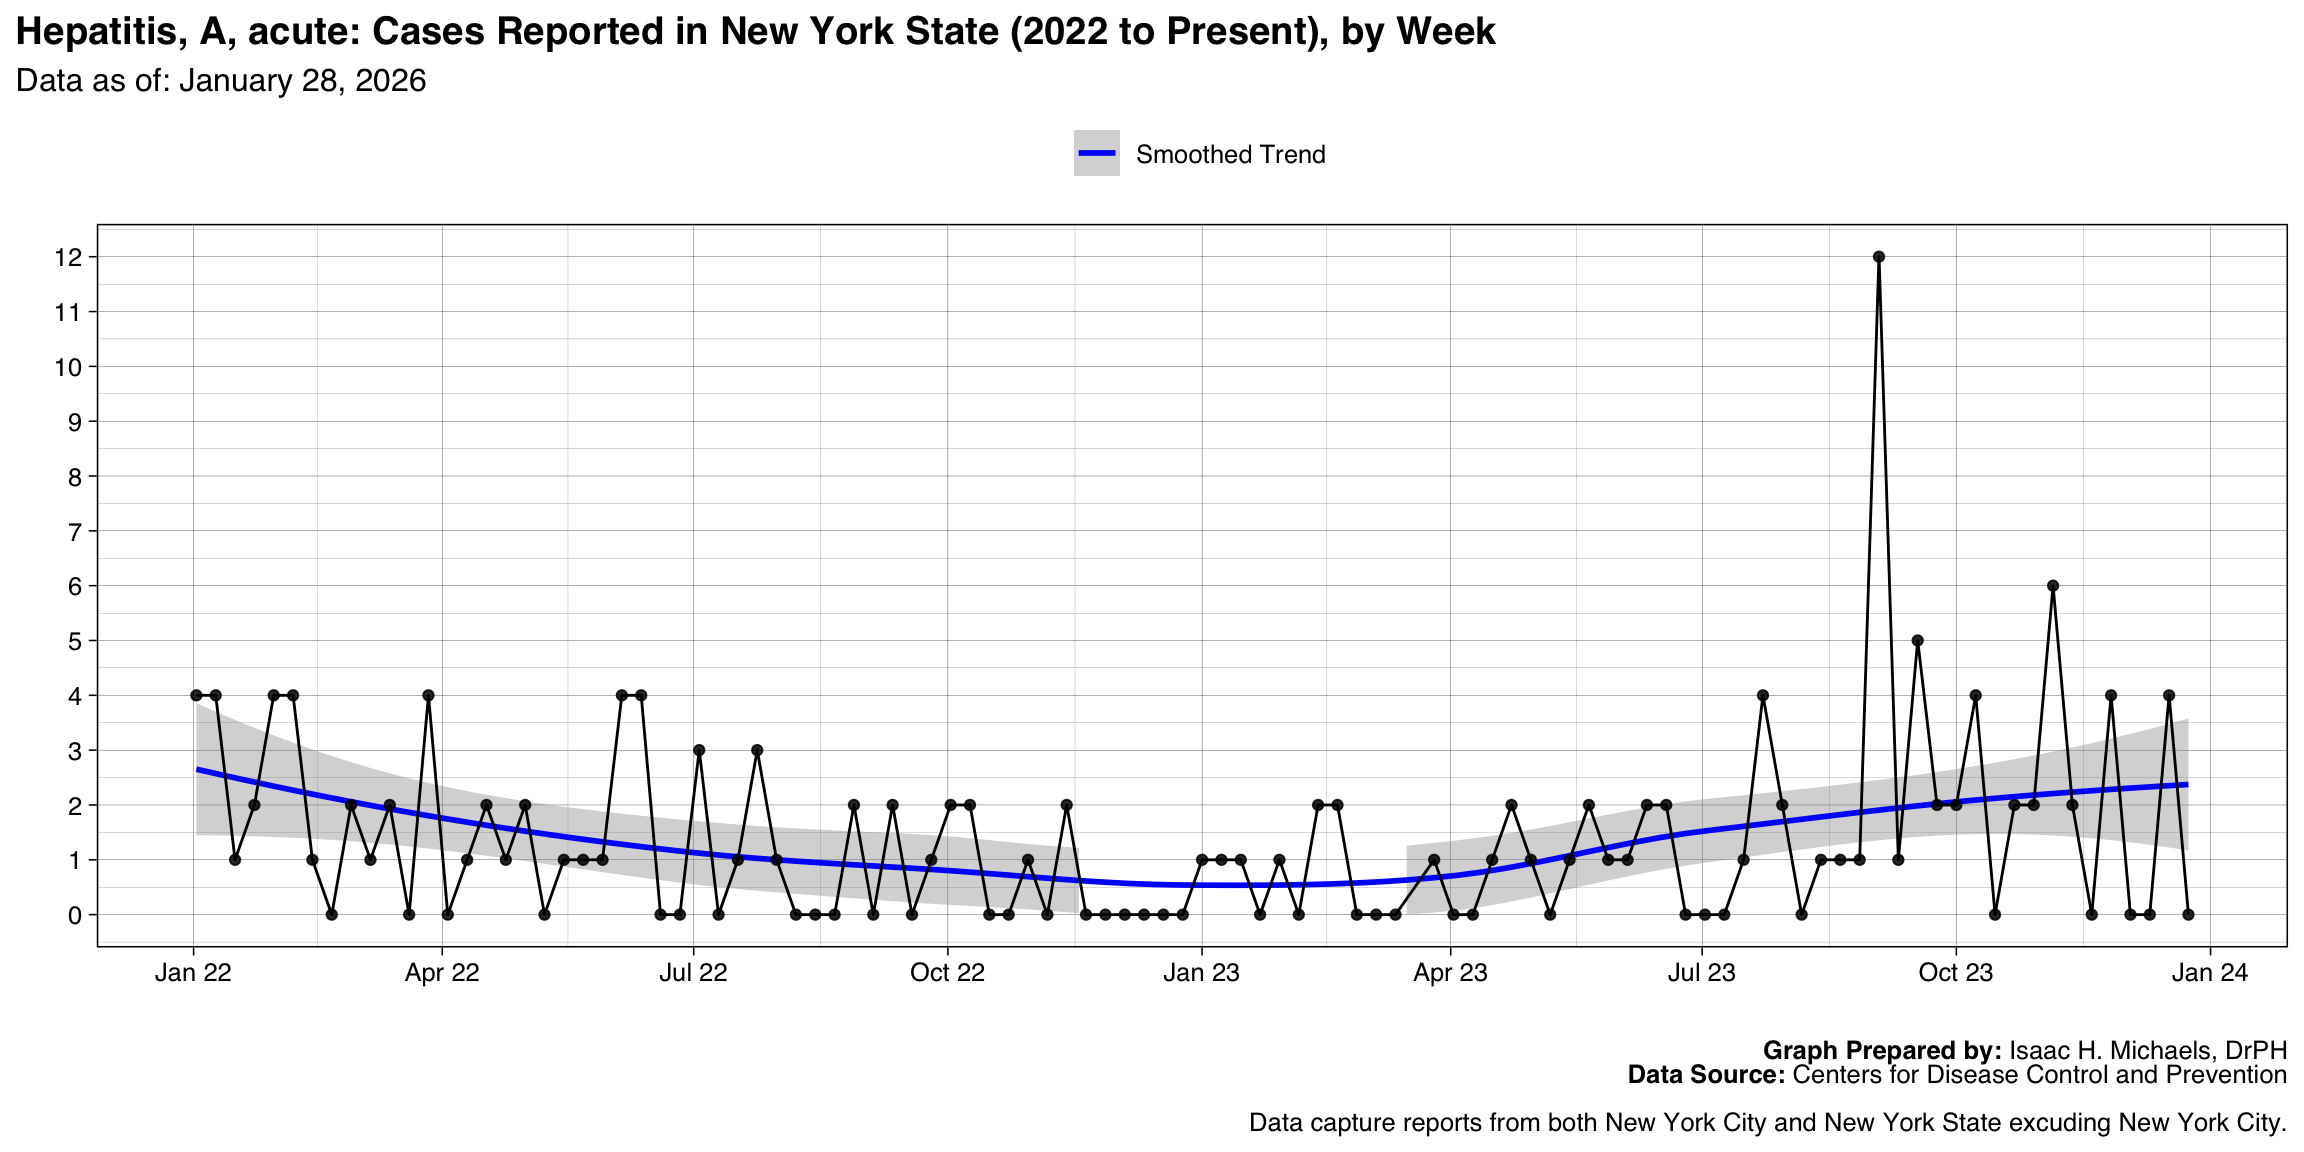
| Hepatitis, A, acute | 2022-01-02 | 2023-12-17 | NA | 146 | |
| Dengue virus infections, Dengue | 2022-08-28 | 2026-07-19 | 1 | 113 | |
| Haemophilus influenzae, invasive disease, Age <5 years, Unknown serotype | 2022-02-13 | 2026-06-21 | 0 | 99 | |
| Streptococcal toxic shock syndrome | 2022-01-30 | 2026-07-12 | 0 | 89 | |
| Salmonella Typhi infection | 2022-02-27 | 2026-05-17 | 0 | 85 | |
| Hepatitis, B, acute | 2022-01-02 | 2023-11-26 | NA | 82 | |
| Hepatitis C, acute, Probable | 2022-01-02 | 2026-06-28 | 0 | 67 | |
| Arboviral diseases, West Nile virus disease | 2022-07-31 | 2025-11-16 | 0 | 64 | |
| Listeriosis, Probable | 2022-01-09 | 2026-07-19 | 2 | 52 | |
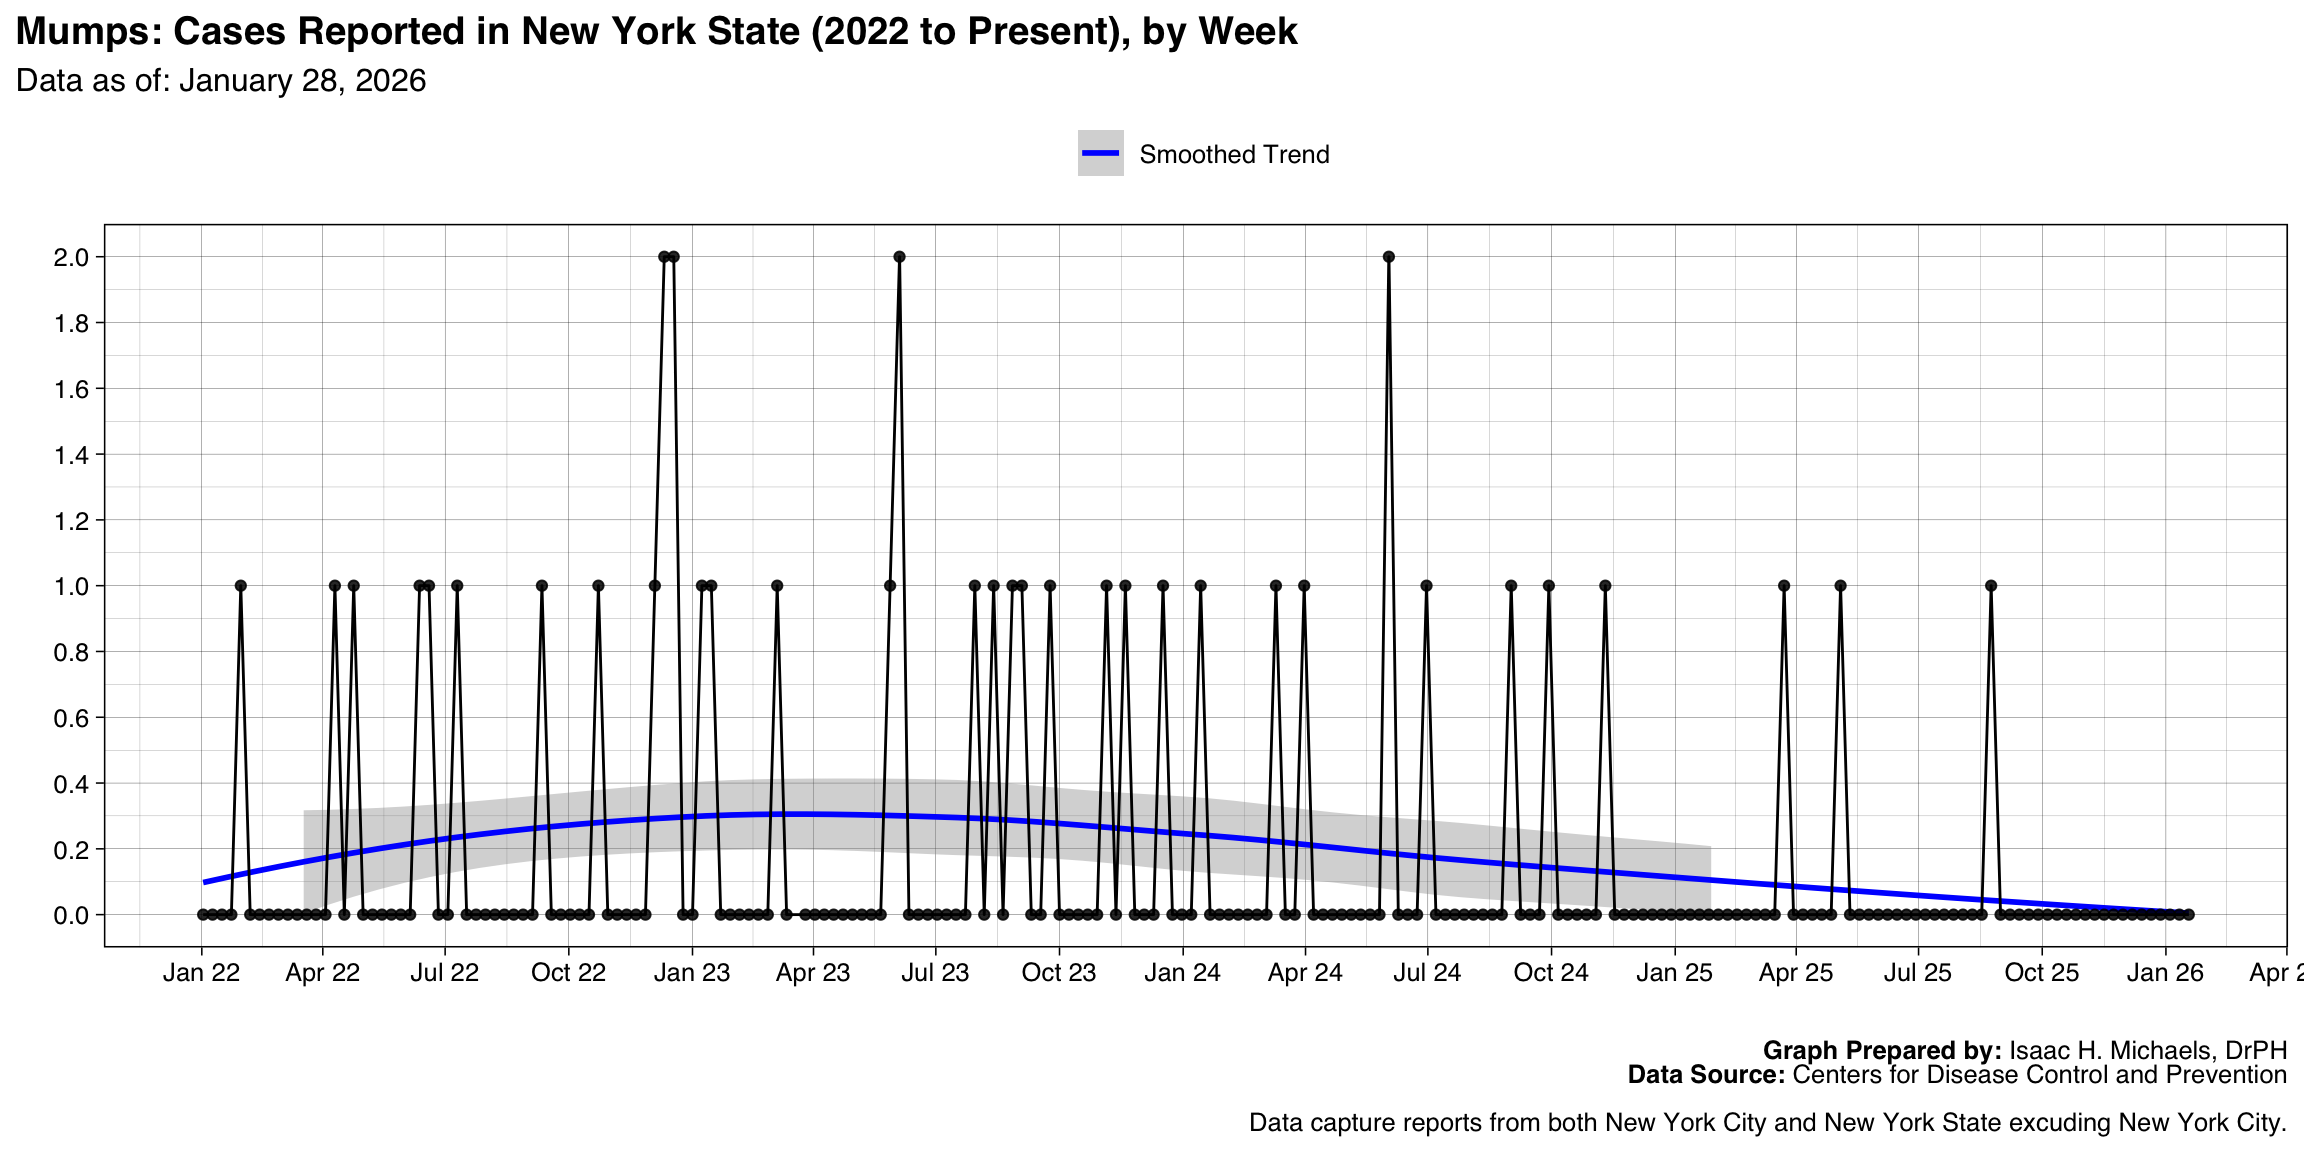
| Mumps | 2022-01-30 | 2026-06-14 | 0 | 42 | |
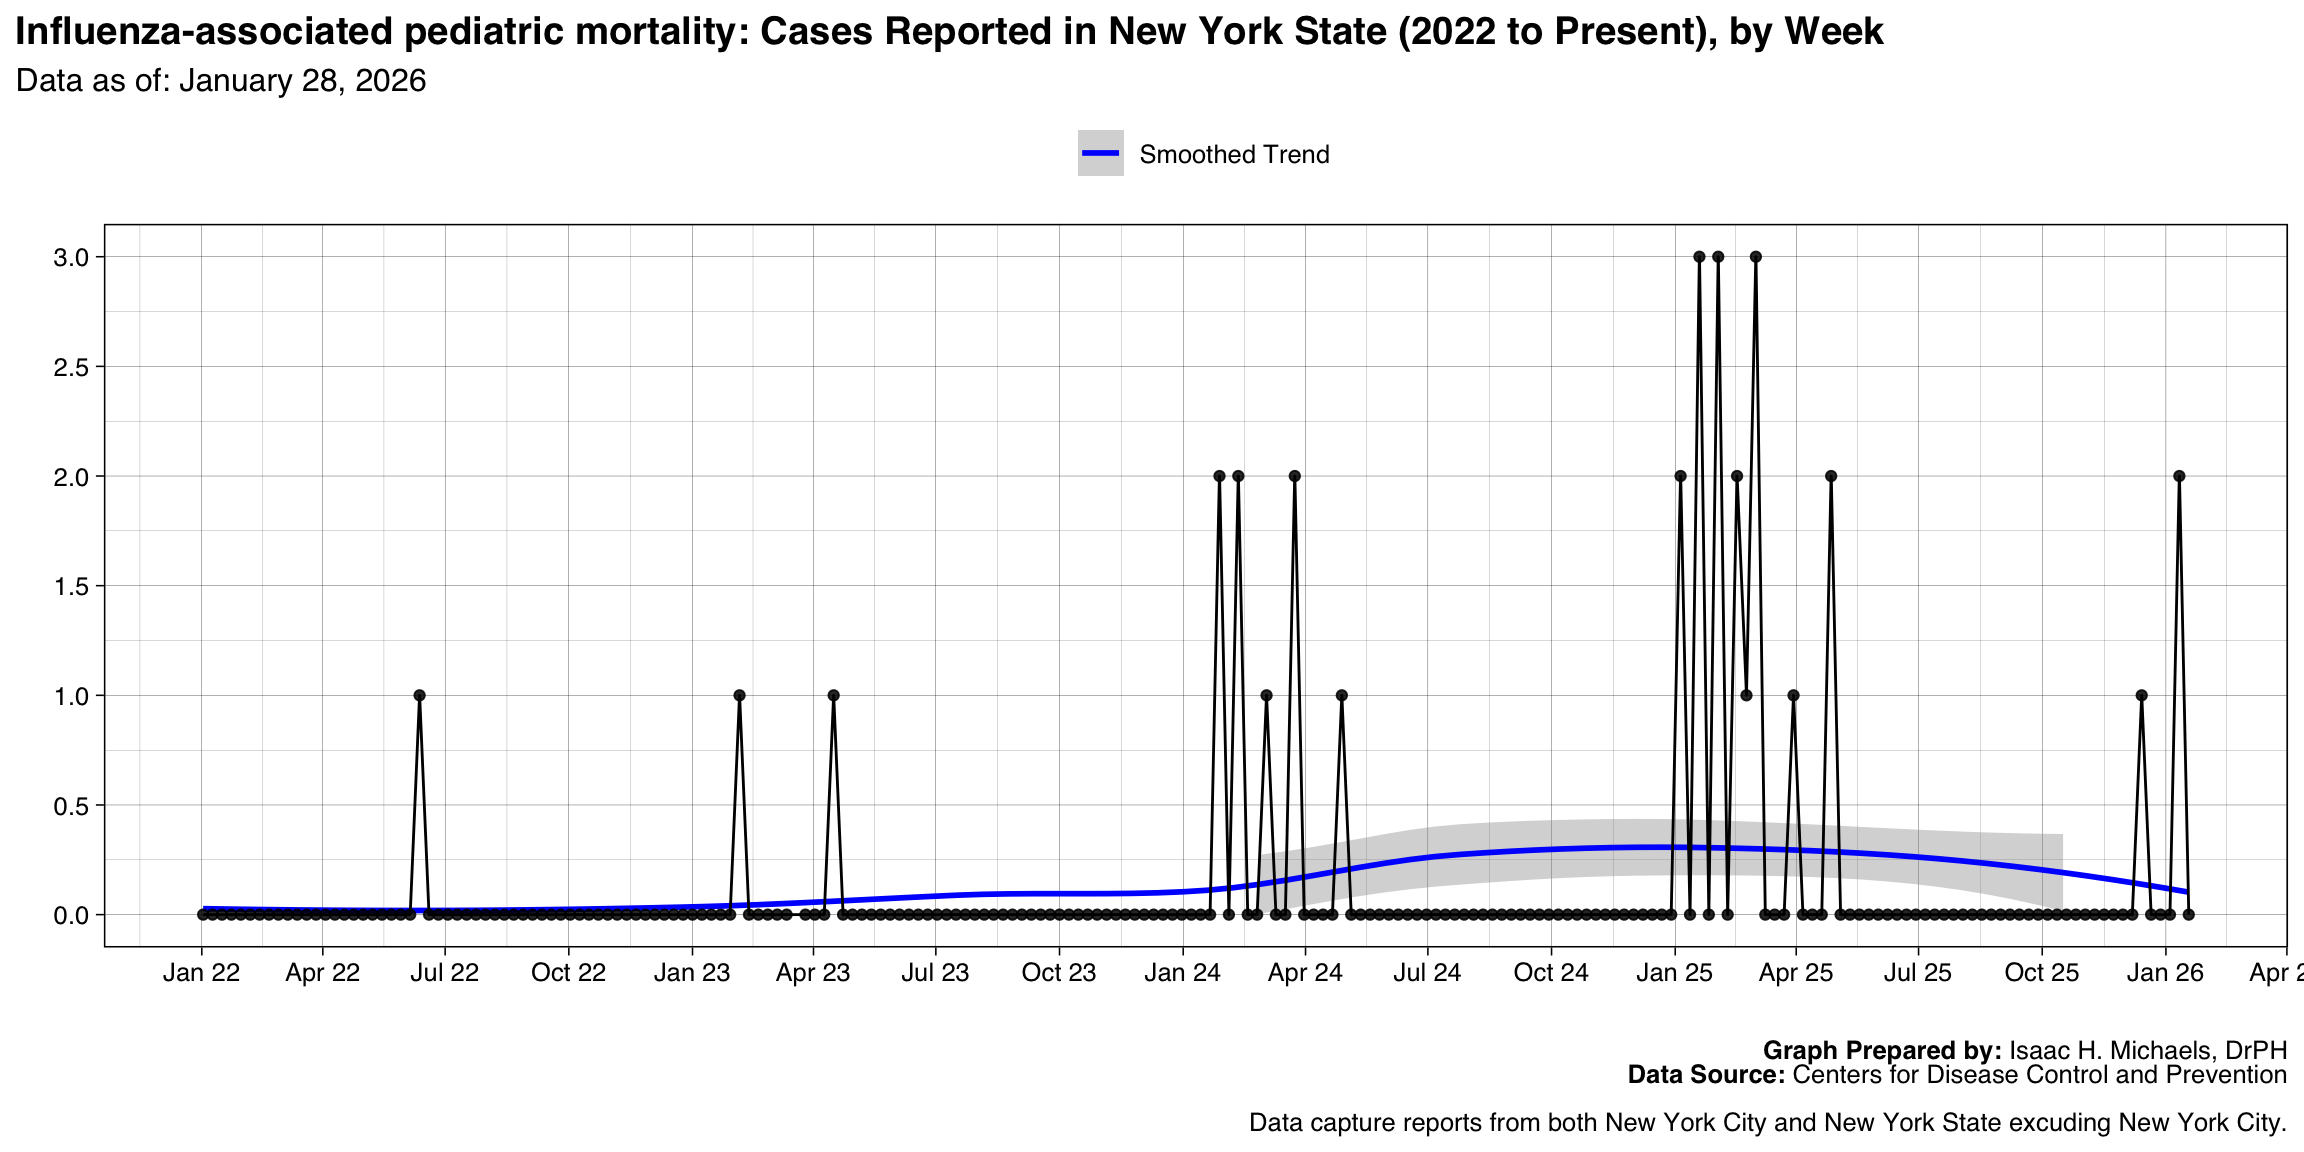
| Influenza-associated pediatric mortality | 2022-06-12 | 2026-02-22 | 0 | 33 | |
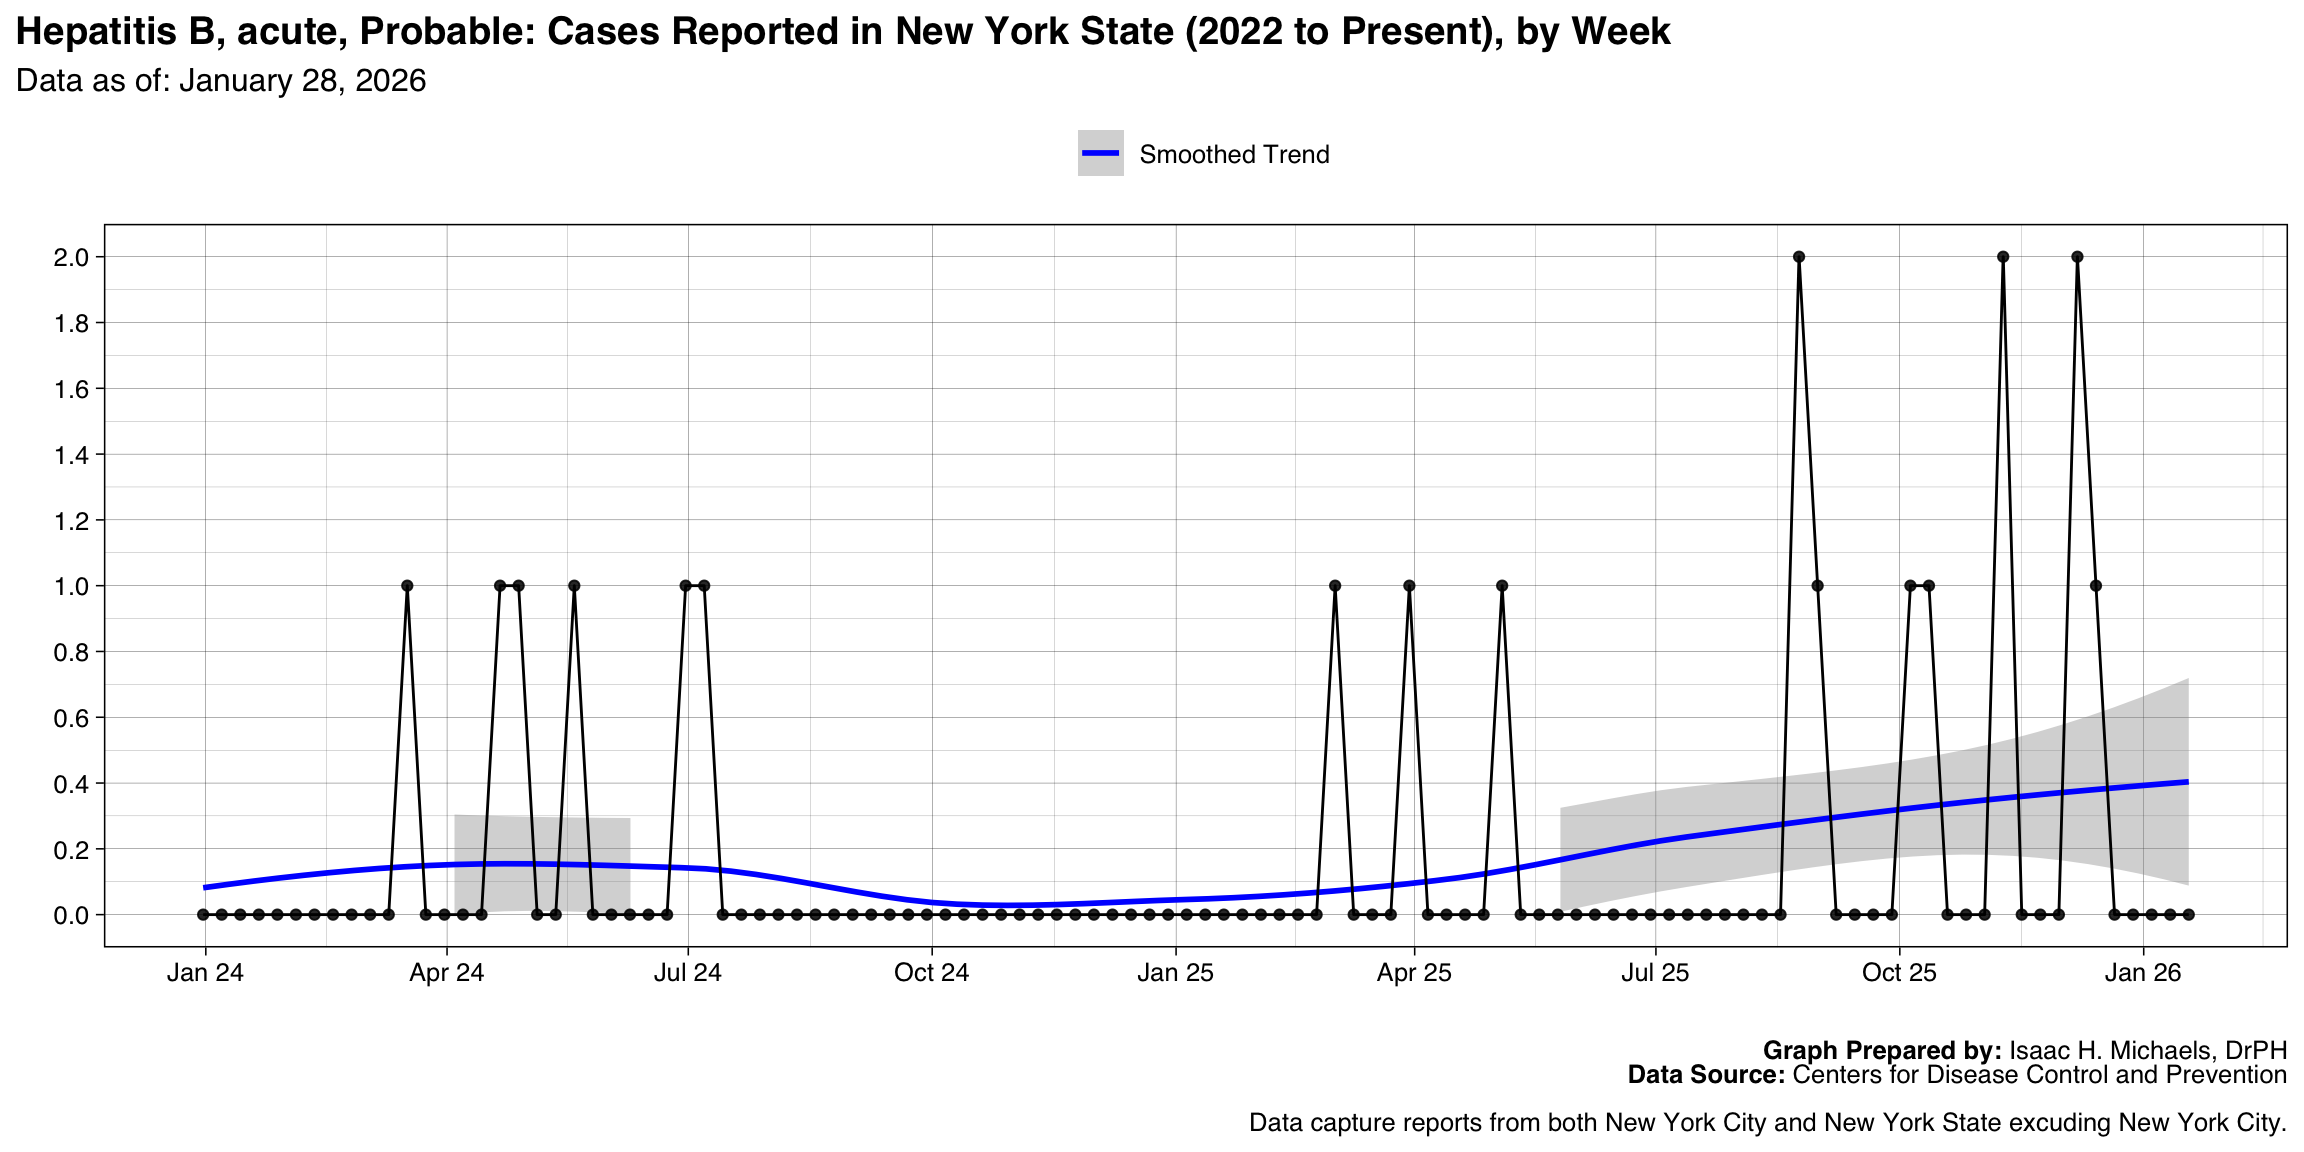
| Hepatitis B, acute, Probable | 2024-03-17 | 2026-04-19 | 0 | 24 | |
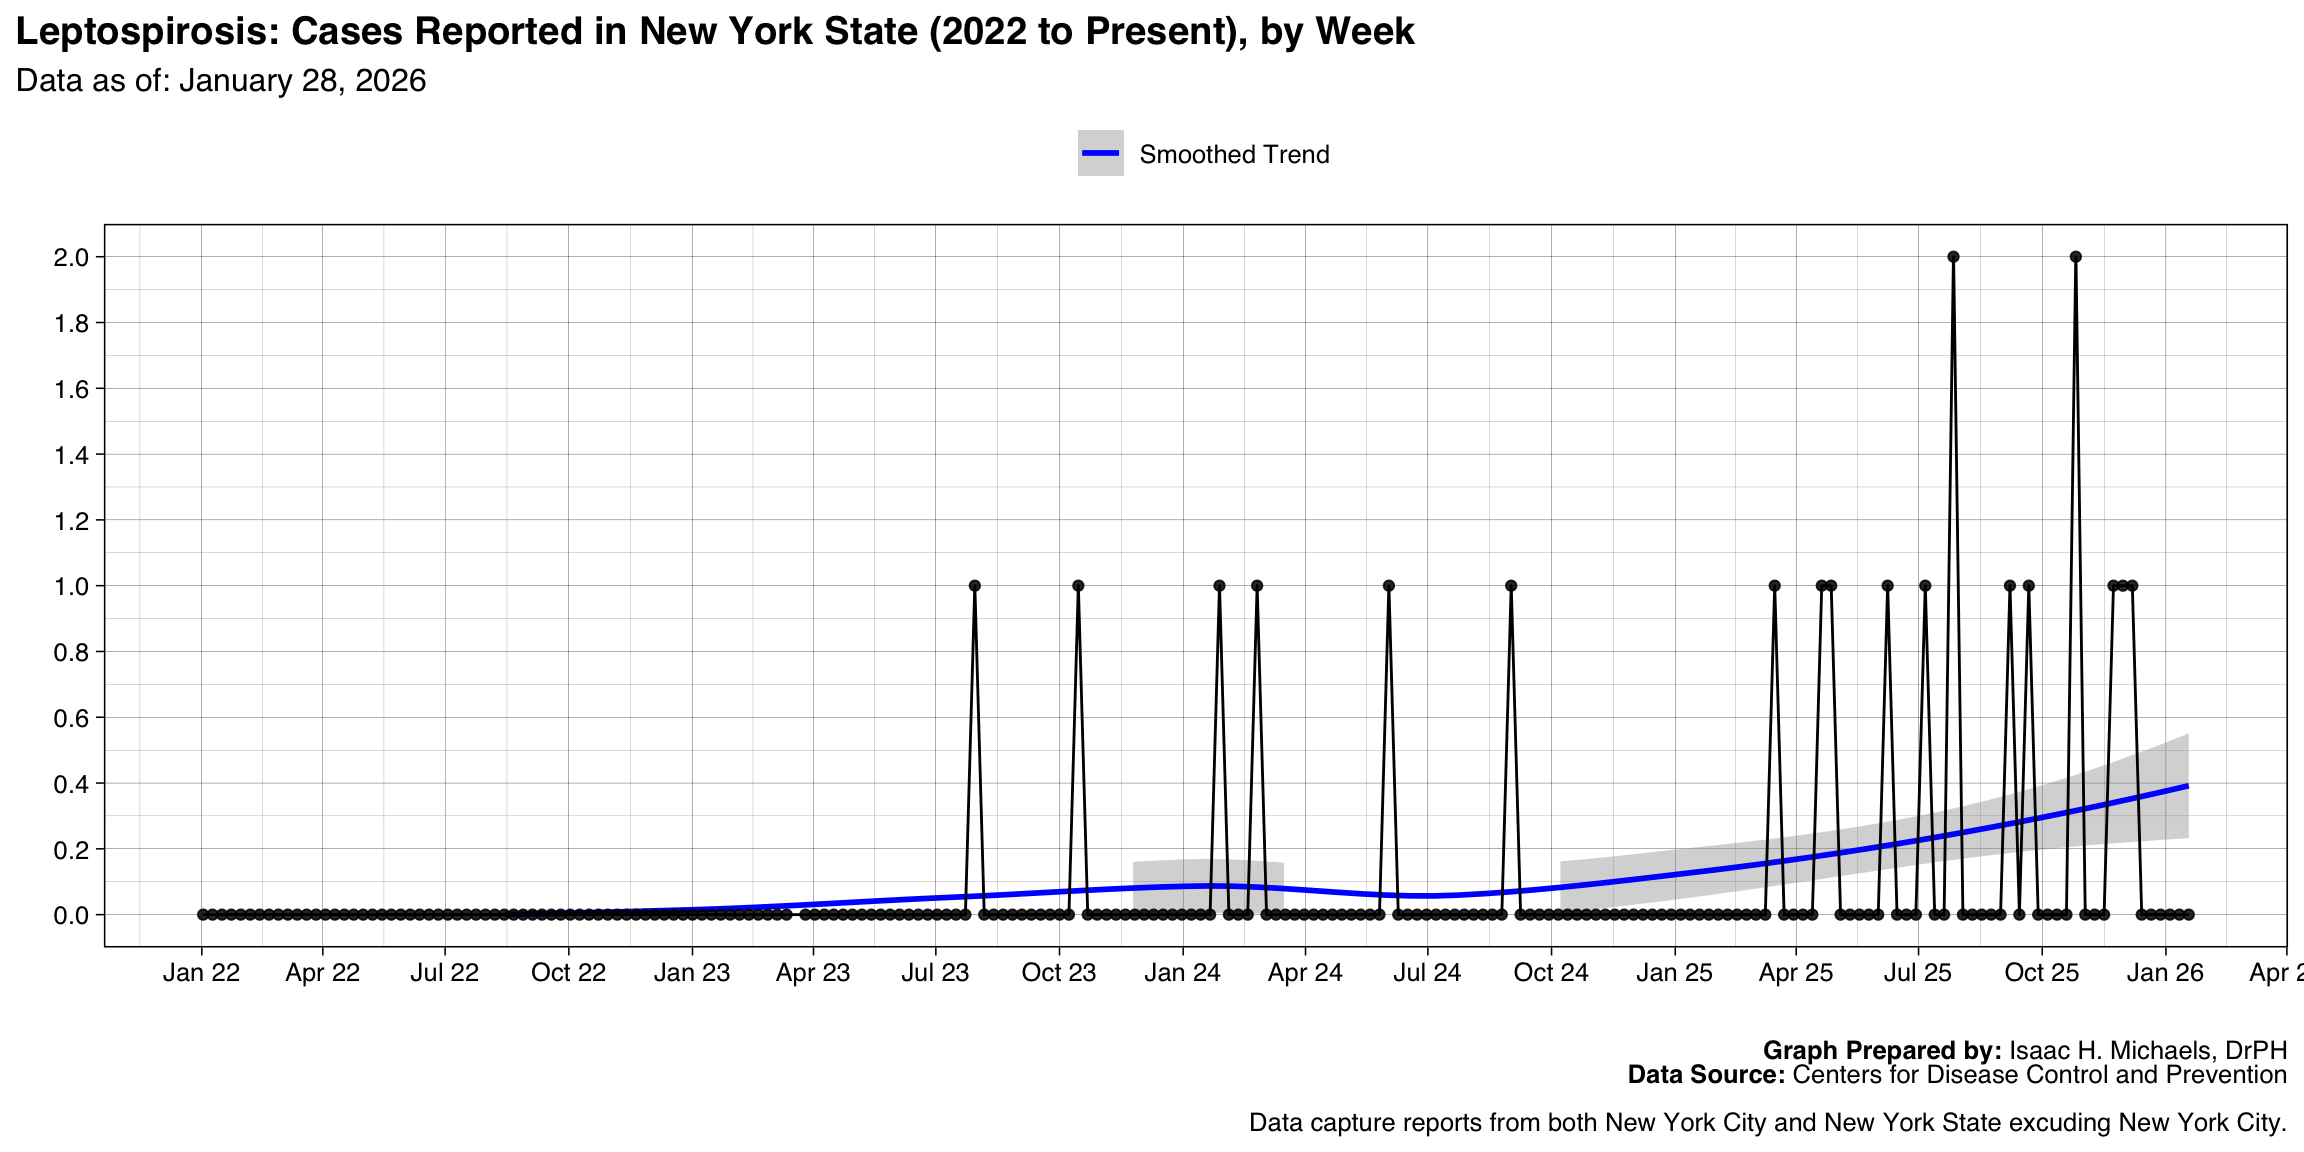
| Leptospirosis | 2023-07-30 | 2026-07-19 | 1 | 24 | |
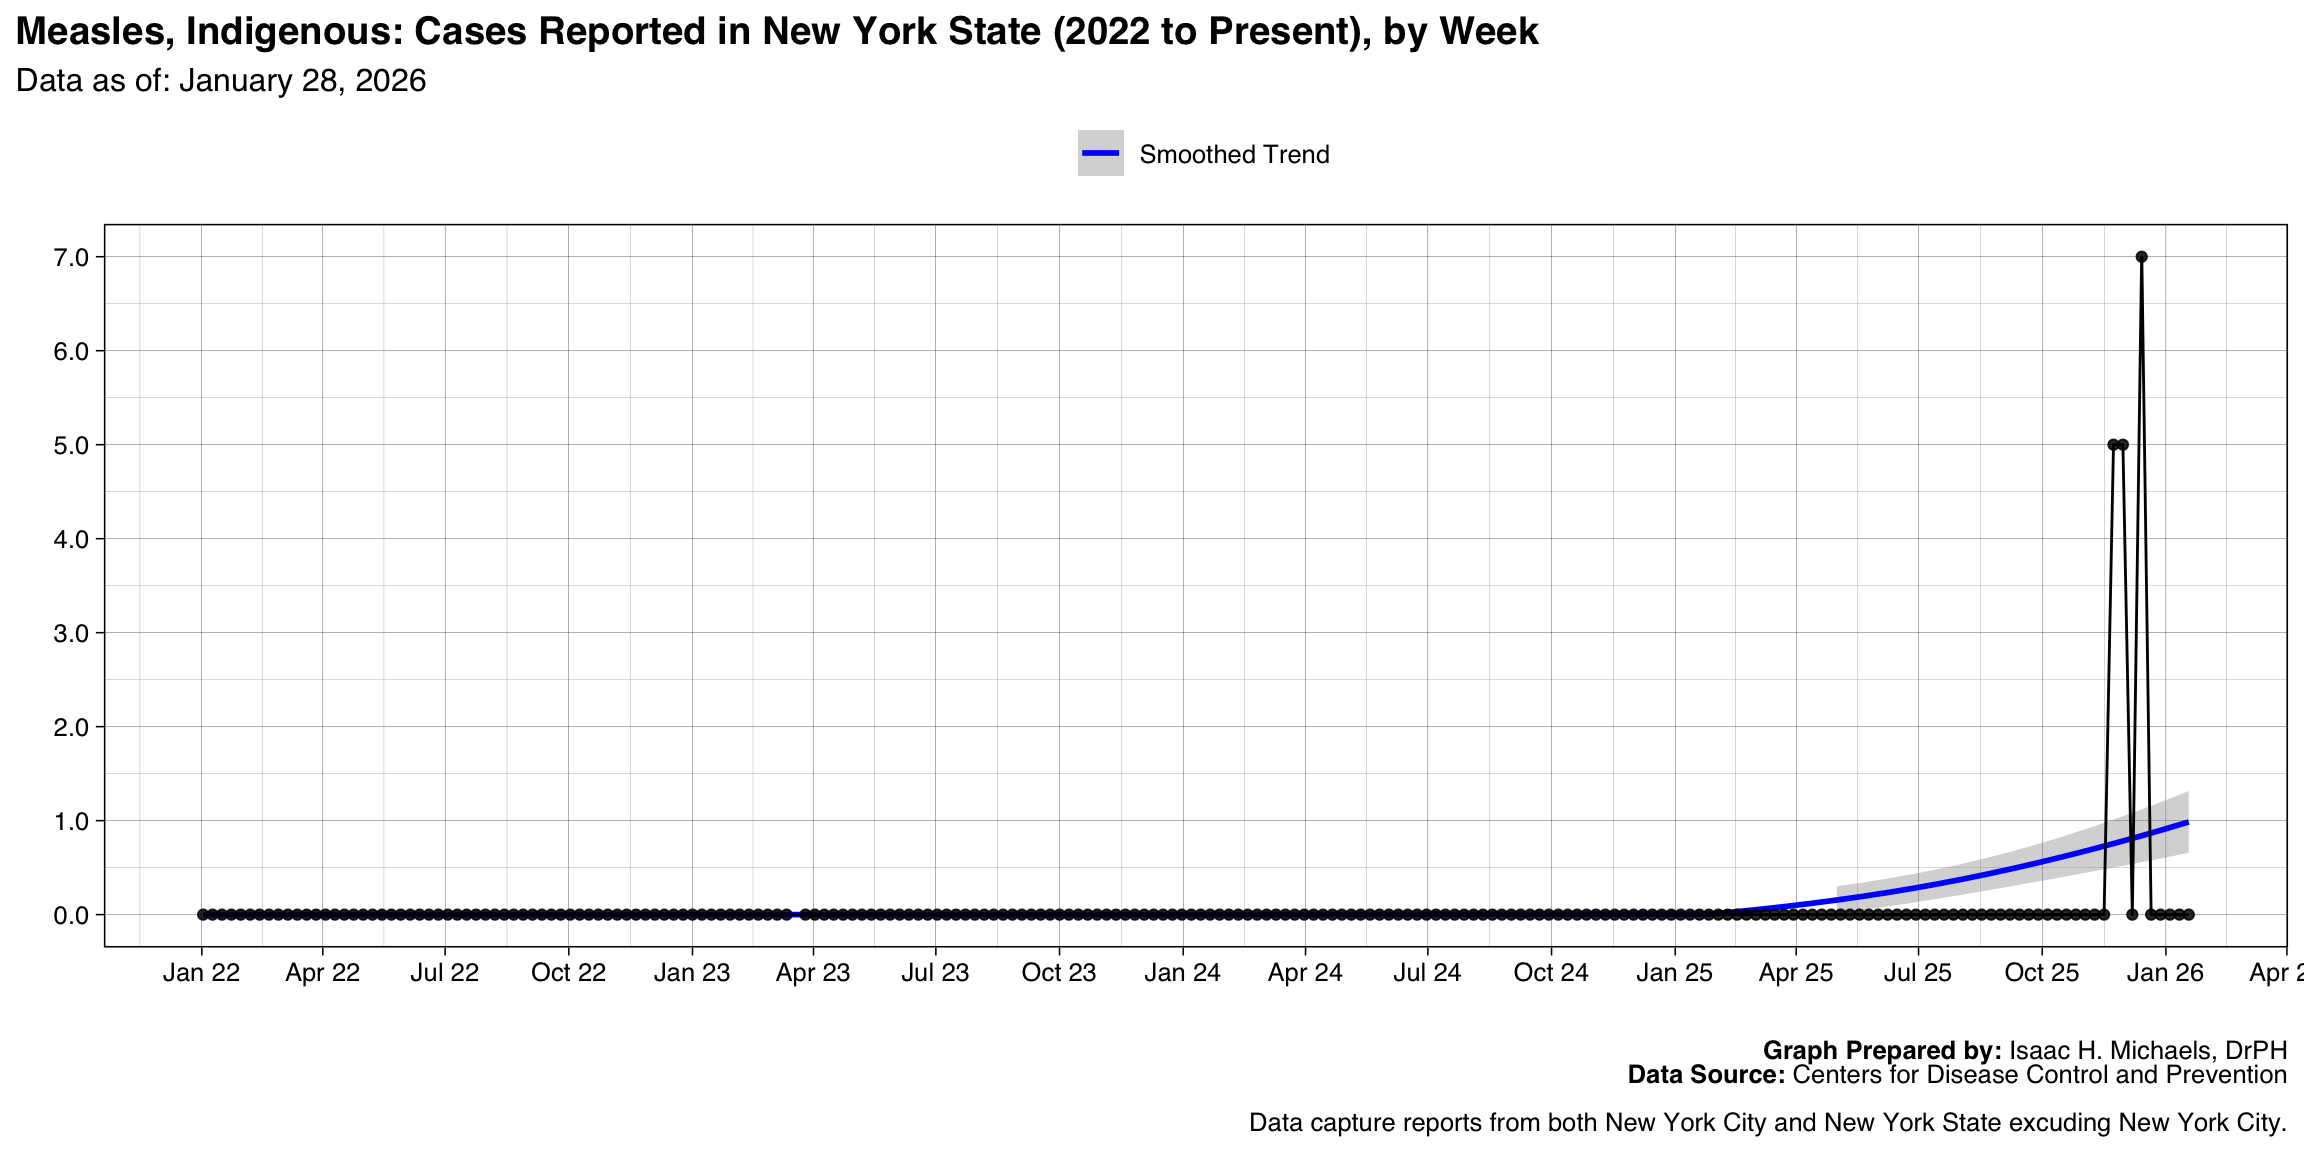
| Measles, Indigenous | 2025-11-23 | 2026-07-19 | 1 | 24 | |
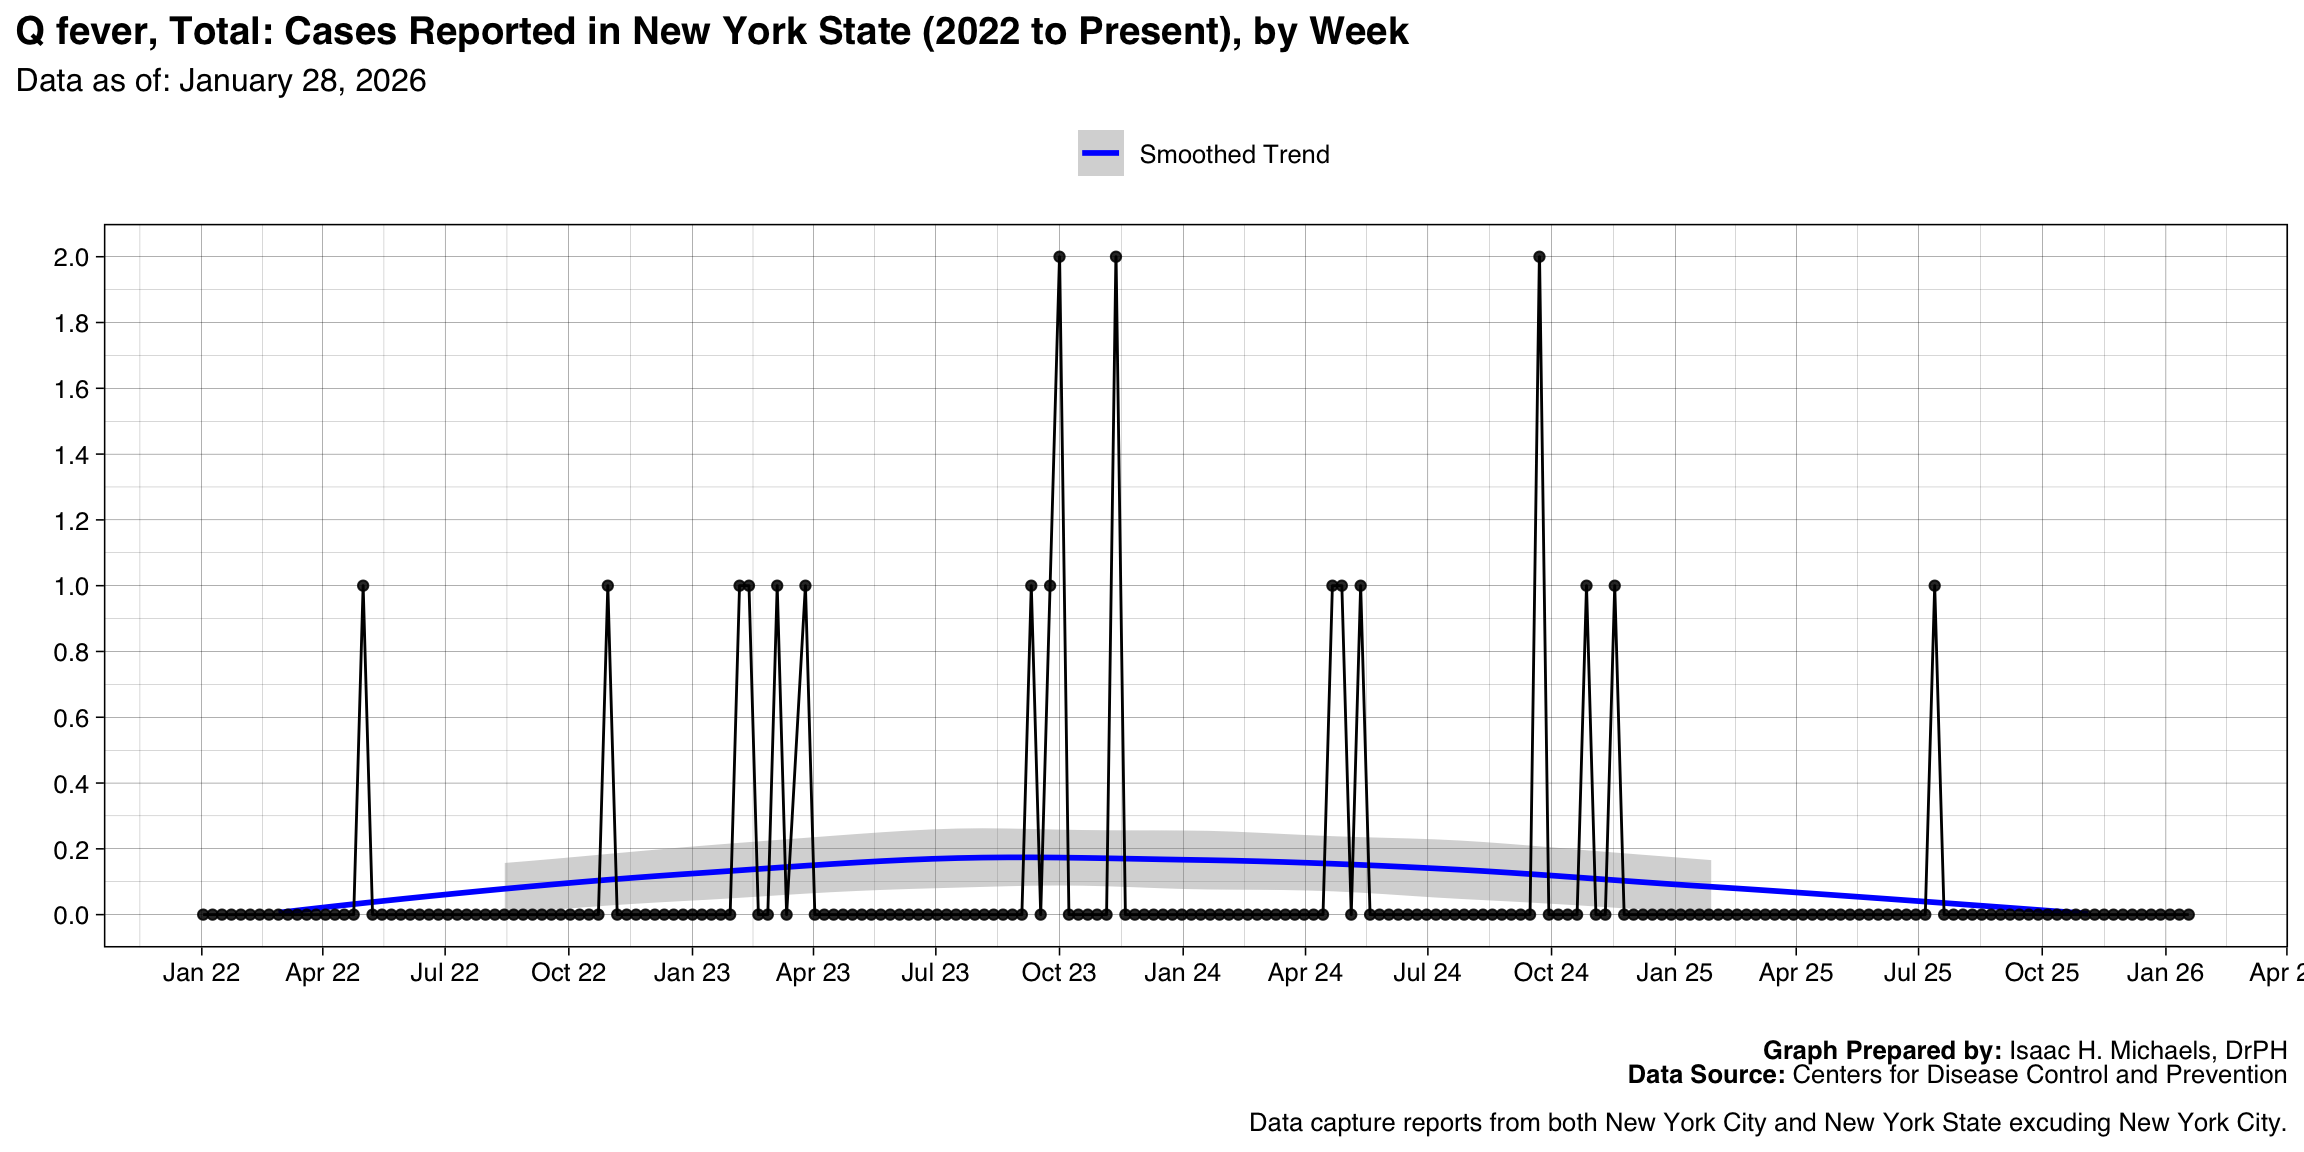
| Q fever, Total | 2022-05-01 | 2026-06-21 | 0 | 23 | |
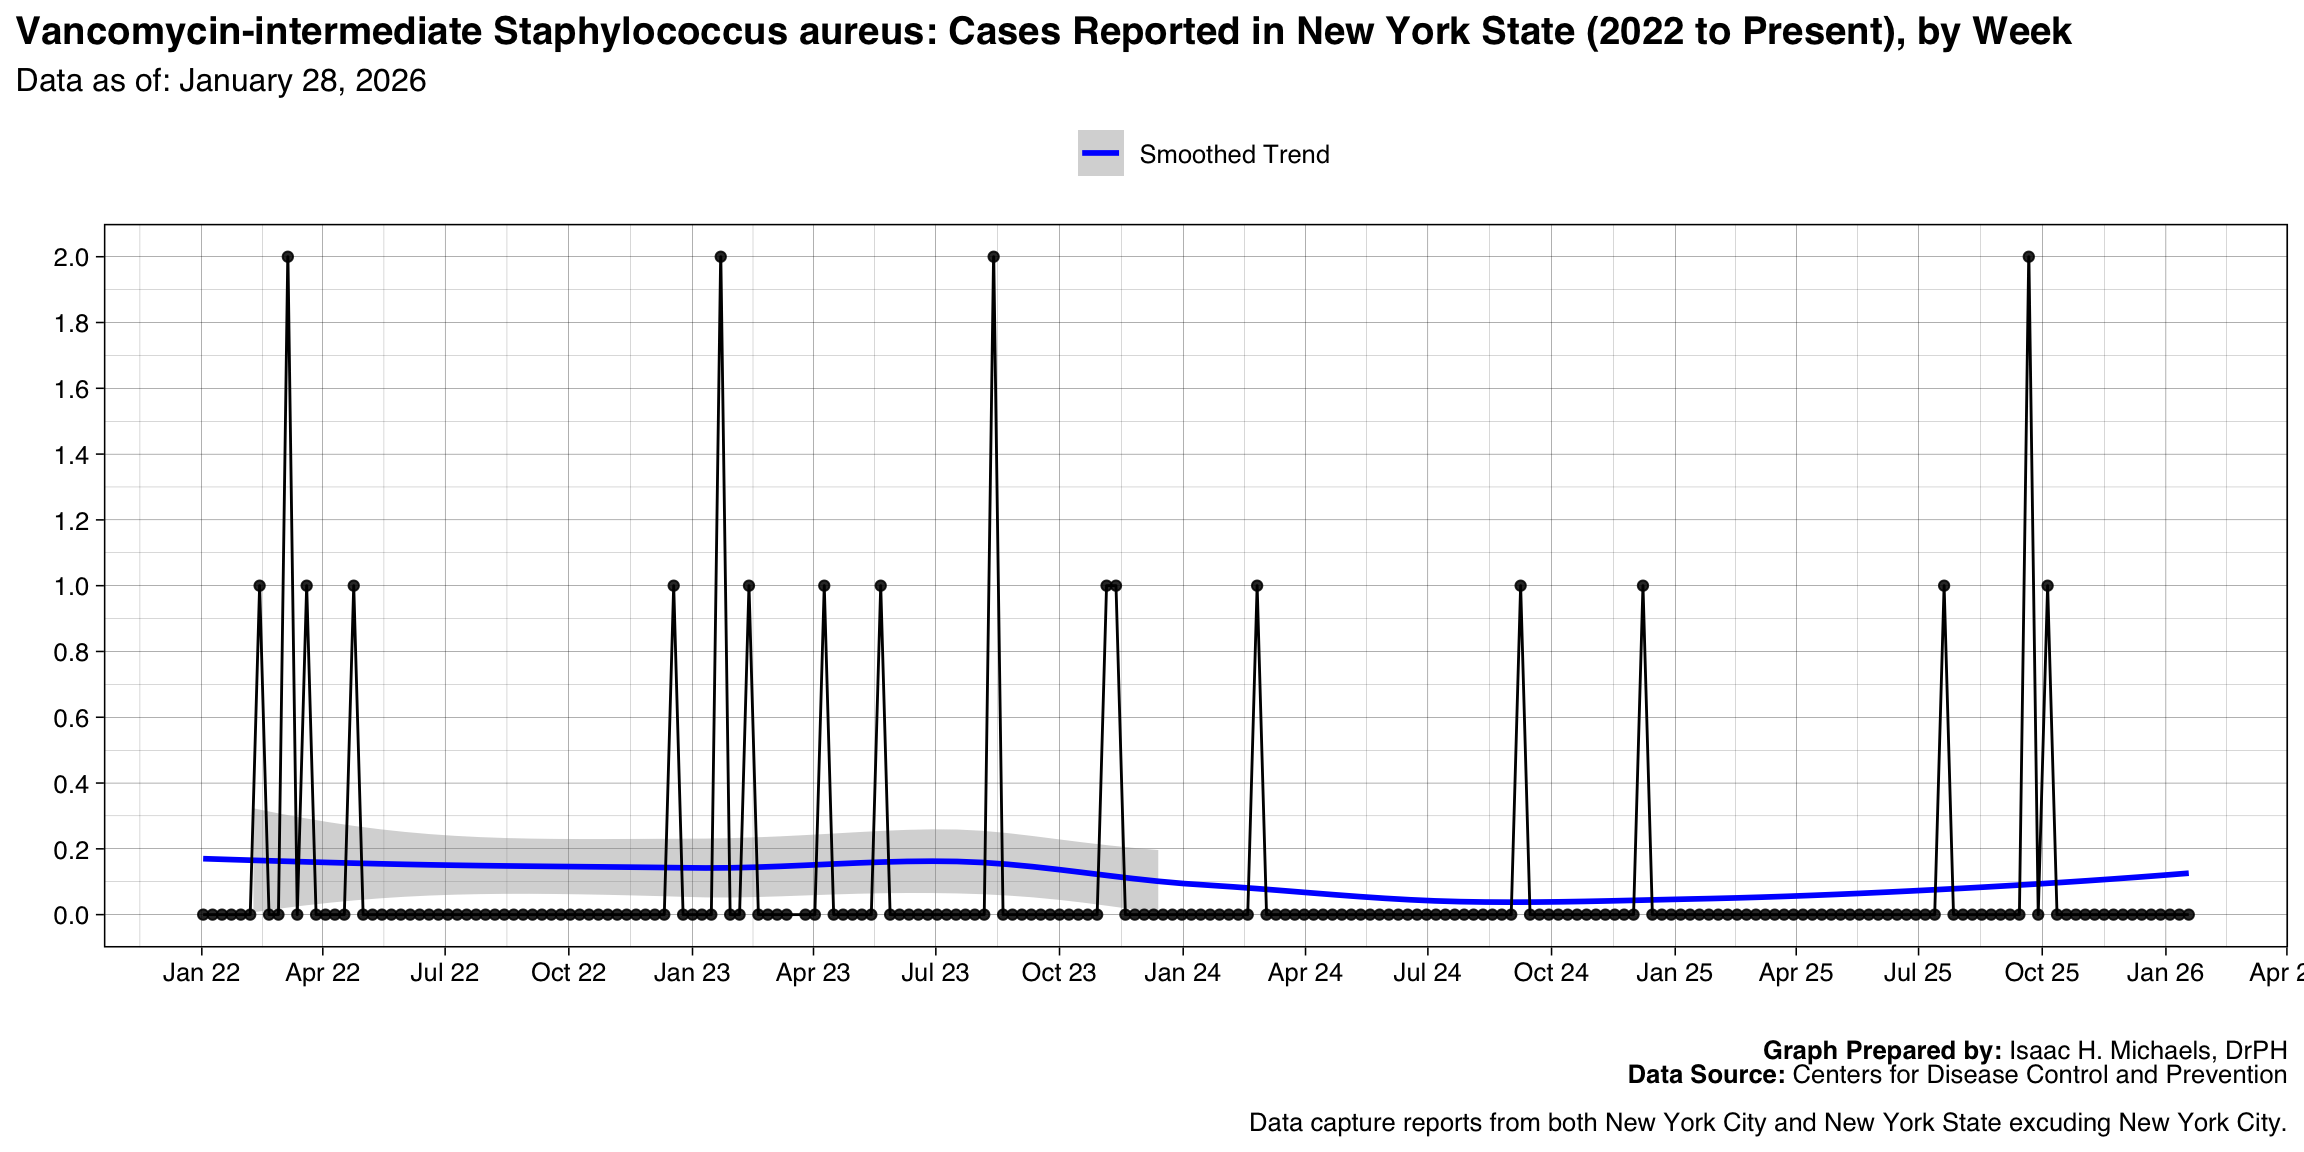
| Vancomycin-intermediate Staphylococcus aureus | 2022-02-13 | 2026-06-28 | 0 | 23 | |
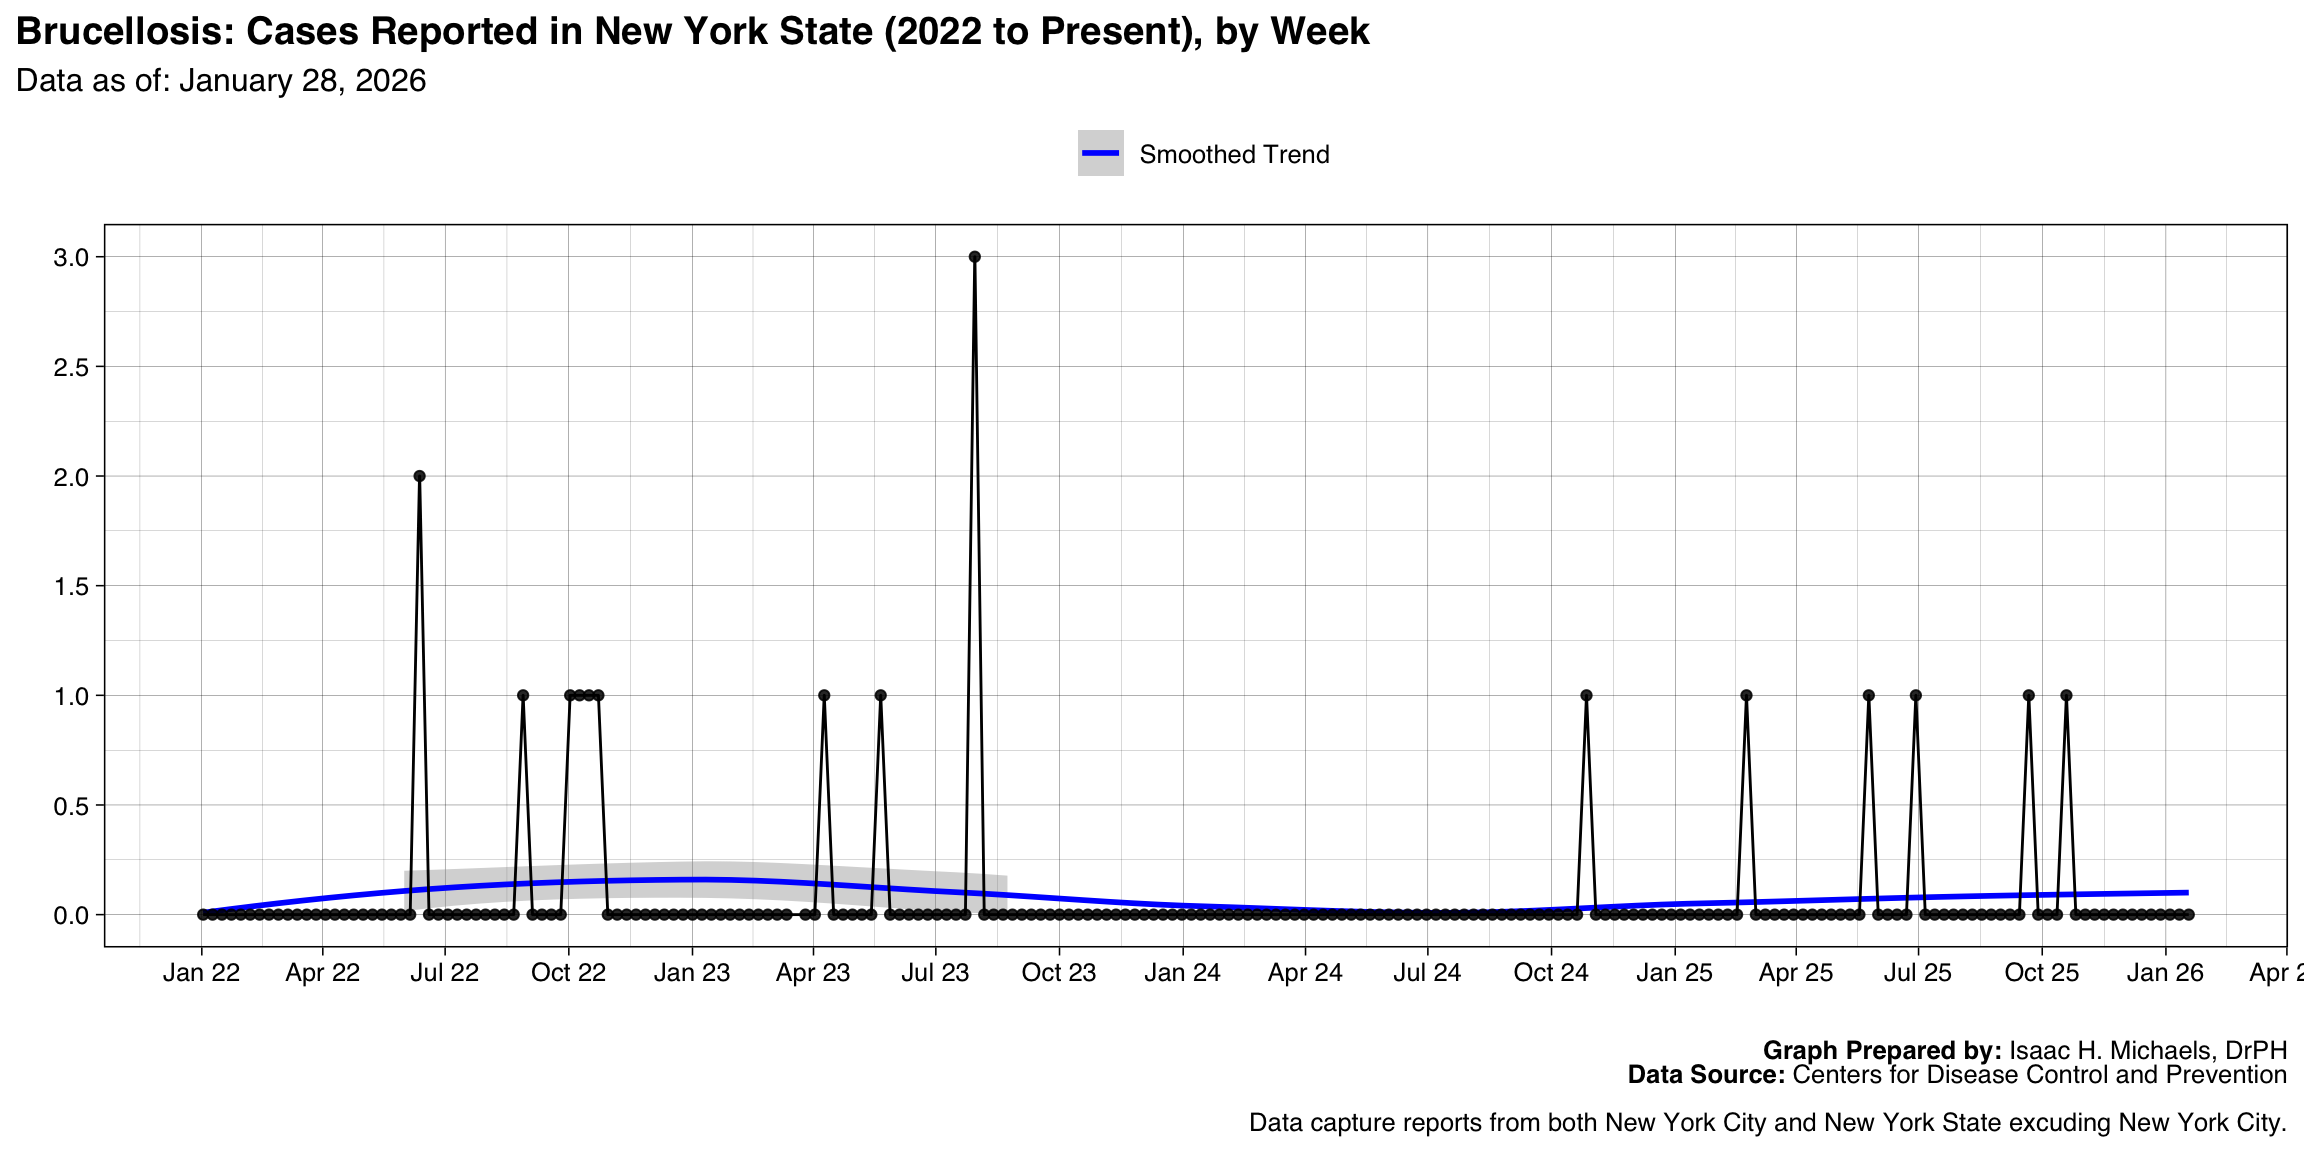
| Brucellosis | 2022-06-12 | 2025-10-19 | 0 | 18 | |
| Tularemia | 2022-11-06 | 2026-06-21 | 0 | 18 | |
| Q fever, Acute | 2022-05-01 | 2026-06-21 | 0 | 17 | |
| Salmonella Paratyphi infection | 2022-08-28 | 2026-06-21 | 0 | 17 | |
| Invasive pneumococcal disease, age <5 years, Probable | 2022-11-27 | 2026-03-01 | 0 | 14 | |
| Measles, Imported | 2024-03-24 | 2026-06-07 | 0 | 14 | |
| Arboviral diseases, Chikungunya virus disease | 2022-10-09 | 2026-04-12 | 0 | 13 | |
| Ehrlichiosis and Anaplasmosis, Undetermined ehrlichiosis/anaplasmosis | 2022-06-05 | 2023-12-03 | NA | 13 | |
| Haemophilus influenzae, invasive disease, Age <5 years, Serotype b | 2022-01-30 | 2026-07-19 | 1 | 12 | |
| Hepatitis C, perinatal infection | 2022-03-06 | 2023-11-12 | NA | 11 | |
| SalmonellaParatyphi infection | 2025-02-23 | 2026-02-15 | NA | 10 | |
| Toxic shock syndrome (other than Streptococcal) | 2022-03-13 | 2026-07-19 | 1 | 10 | |
| Haemophilus influenzae, invasive disease, Age <5 years, Nontypeable | 2022-05-15 | 2026-01-18 | 0 | 9 | |
| Haemophilus influenzae, invasive disease, Age <5 years, Non-b serotype | 2022-01-23 | 2026-05-03 | 0 | 8 | |
| Hemolytic uremic syndrome post-diarrheal | 2023-05-14 | 2026-04-19 | 0 | 8 | |
| Arboviral diseases, Powassan virus disease | 2022-10-02 | 2026-06-07 | 0 | 7 | |
| Meningococcal disease, Serogroup B | 2022-03-20 | 2025-11-23 | 0 | 6 | |
| Q fever, Chronic | 2023-02-12 | 2024-11-17 | 0 | 6 | |
| Botulism, Infant | 2023-02-05 | 2025-11-09 | 0 | 5 | |
| Hansen's disease | 2022-10-30 | 2024-12-22 | NA | 4 | |
| Hepatitis C, perinatal, Confirmed | 2023-11-12 | 2024-12-15 | 0 | 4 | |
| Meningococcal disease, Serogroups ACWY | 2023-04-02 | 2025-04-13 | 0 | 4 | |
| Arboviral diseases, Eastern equine encephalitis virus disease | 2024-09-22 | 2025-09-21 | 0 | 3 | |
| Ehrlichiosis and Anaplasmosis, Ehrlichia ewingii infection | 2022-07-24 | 2023-12-17 | NA | 3 | |
| Hepatitis B, acute | 2023-11-05 | 2023-11-26 | NA | 3 | |
| Hepatitis B, perinatal, Confirmed | 2025-05-11 | 2026-06-21 | 0 | 3 | |
| Leprosy (Hansen's disease) | 2026-03-22 | 2026-07-05 | 0 | 3 | |
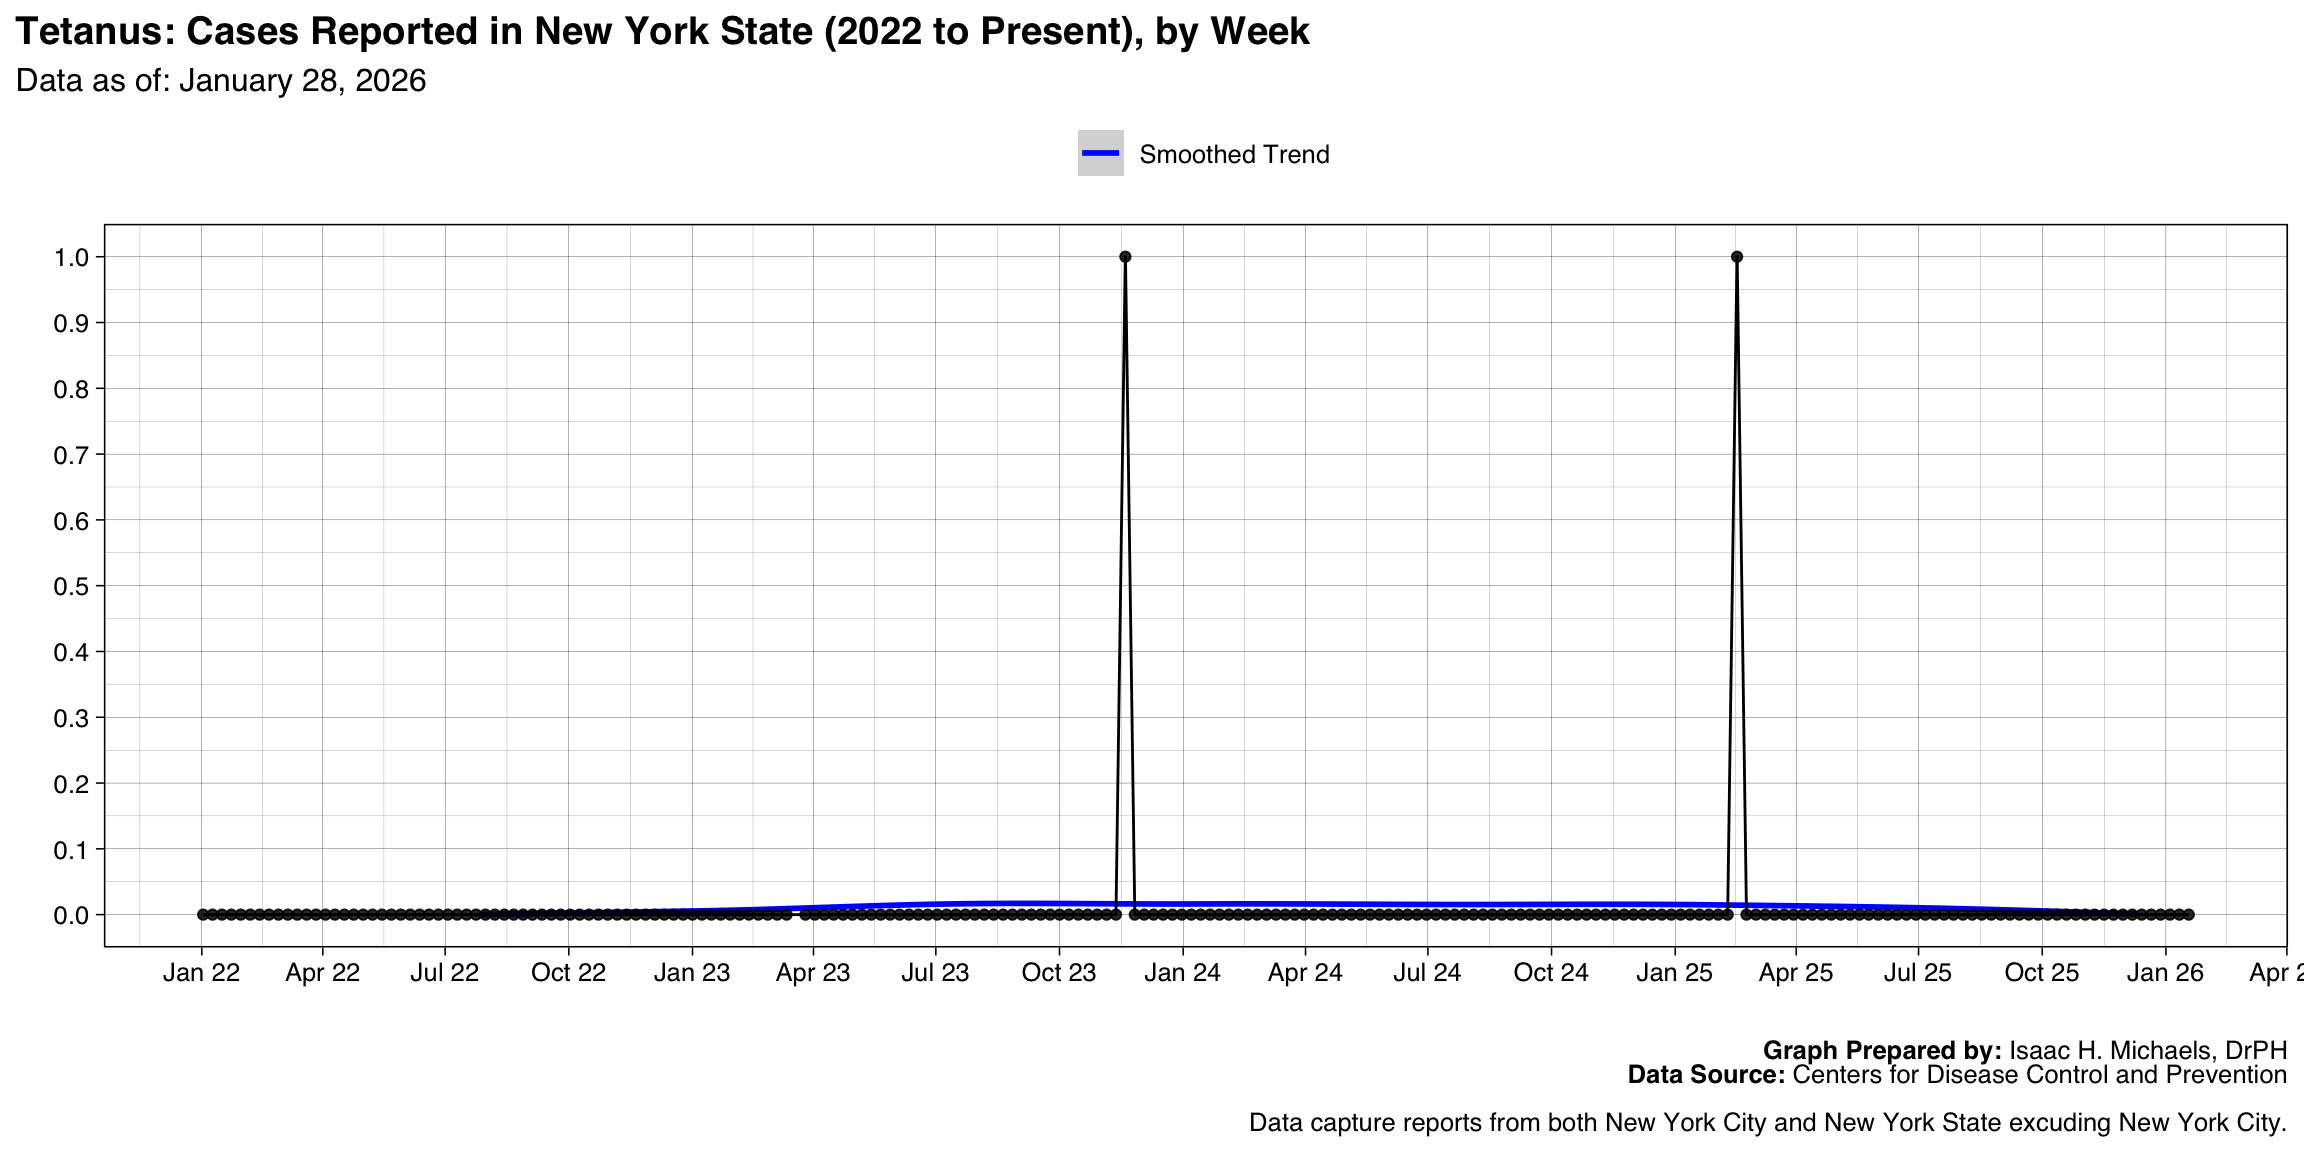
| Tetanus | 2023-11-19 | 2025-02-16 | 0 | 2 | |
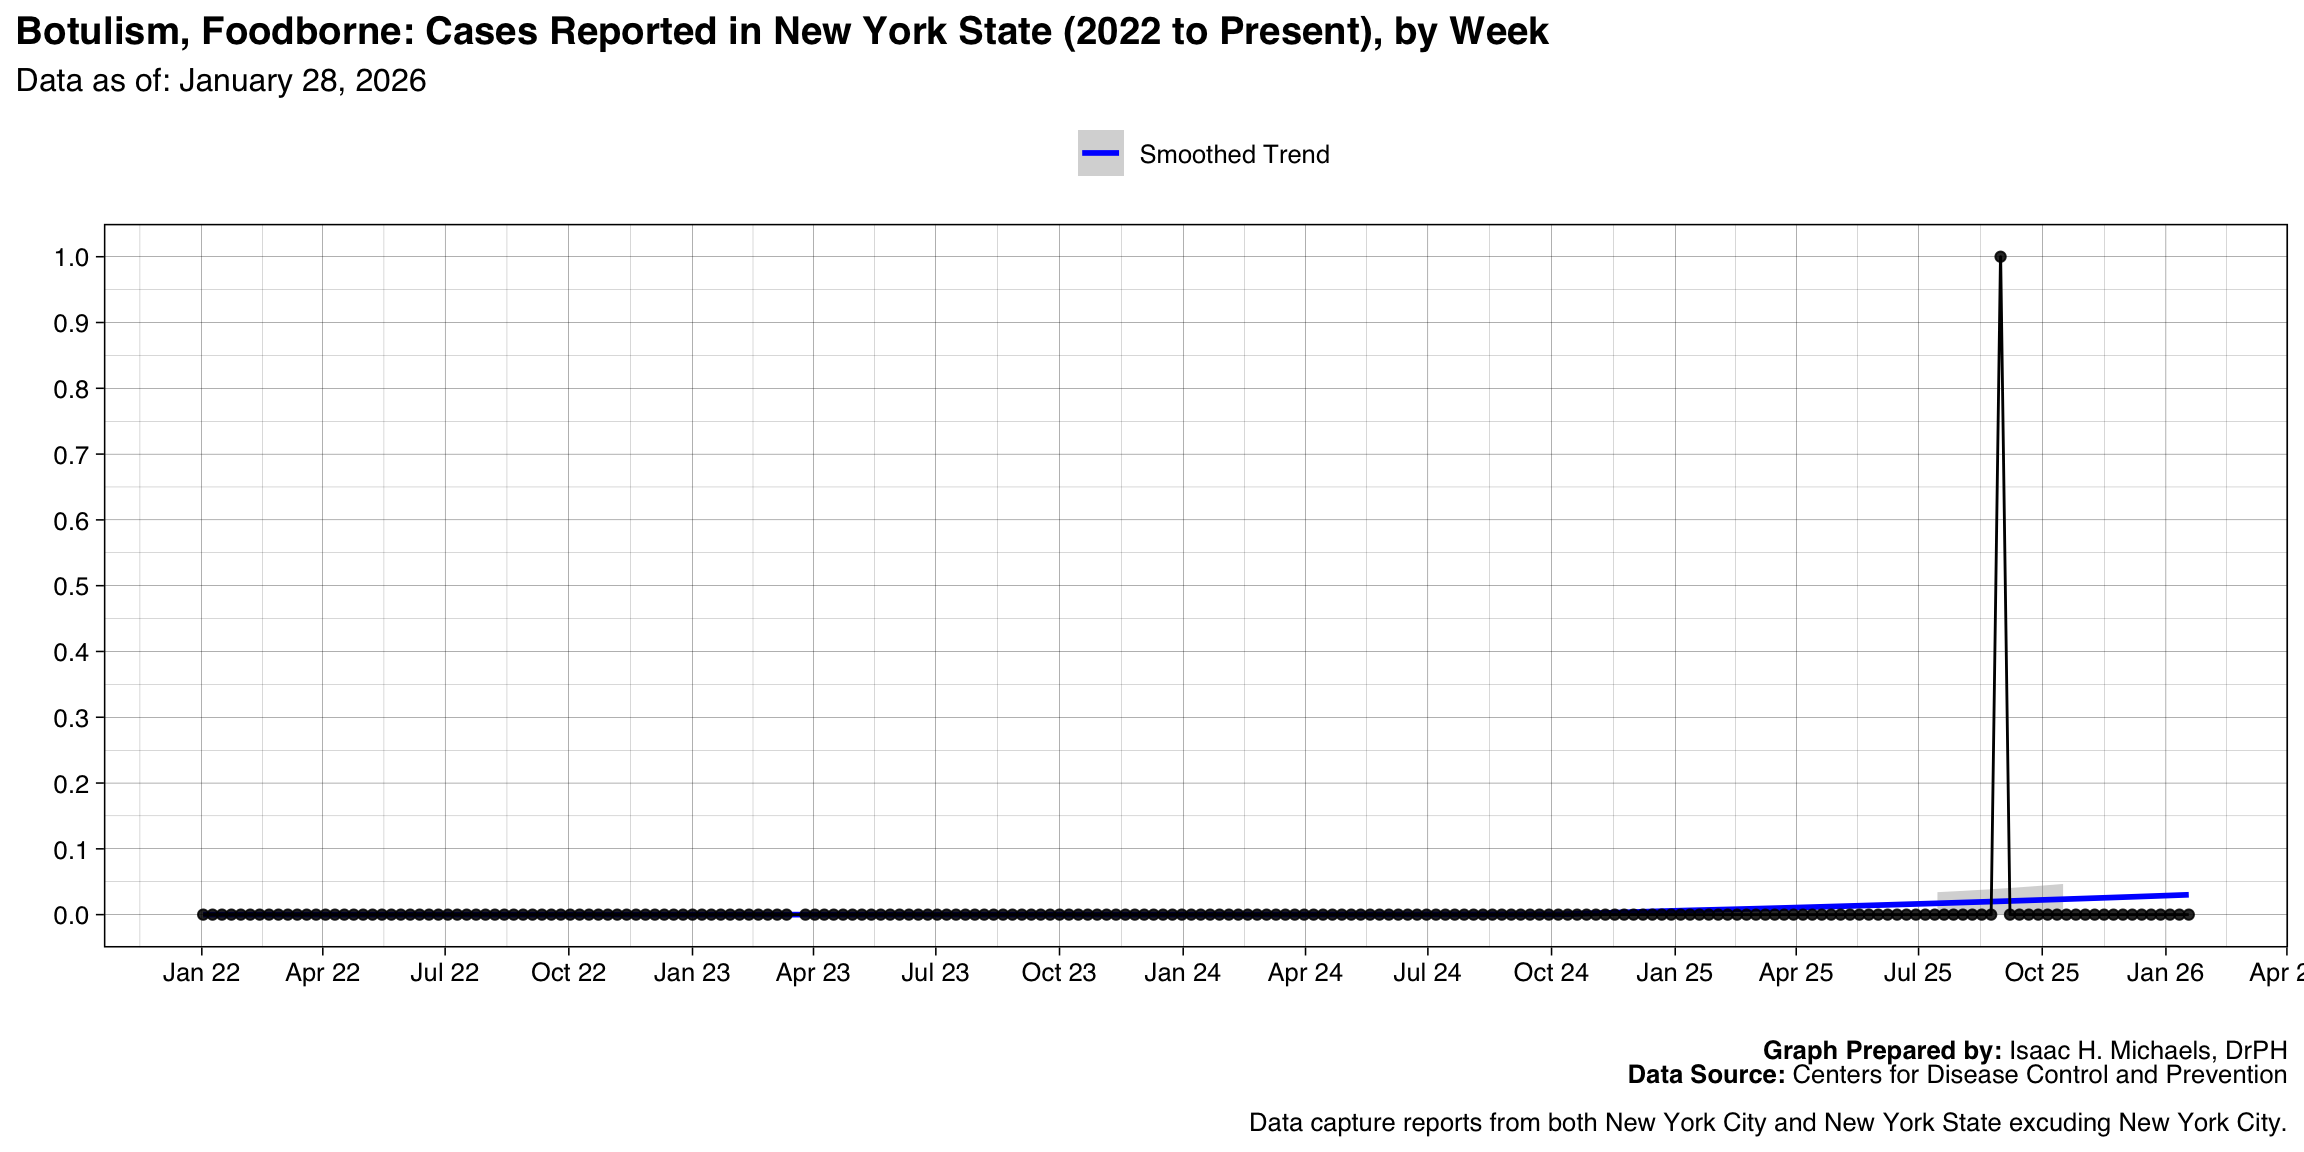
| Botulism, Foodborne | 2025-08-31 | 2025-08-31 | 0 | 1 | |
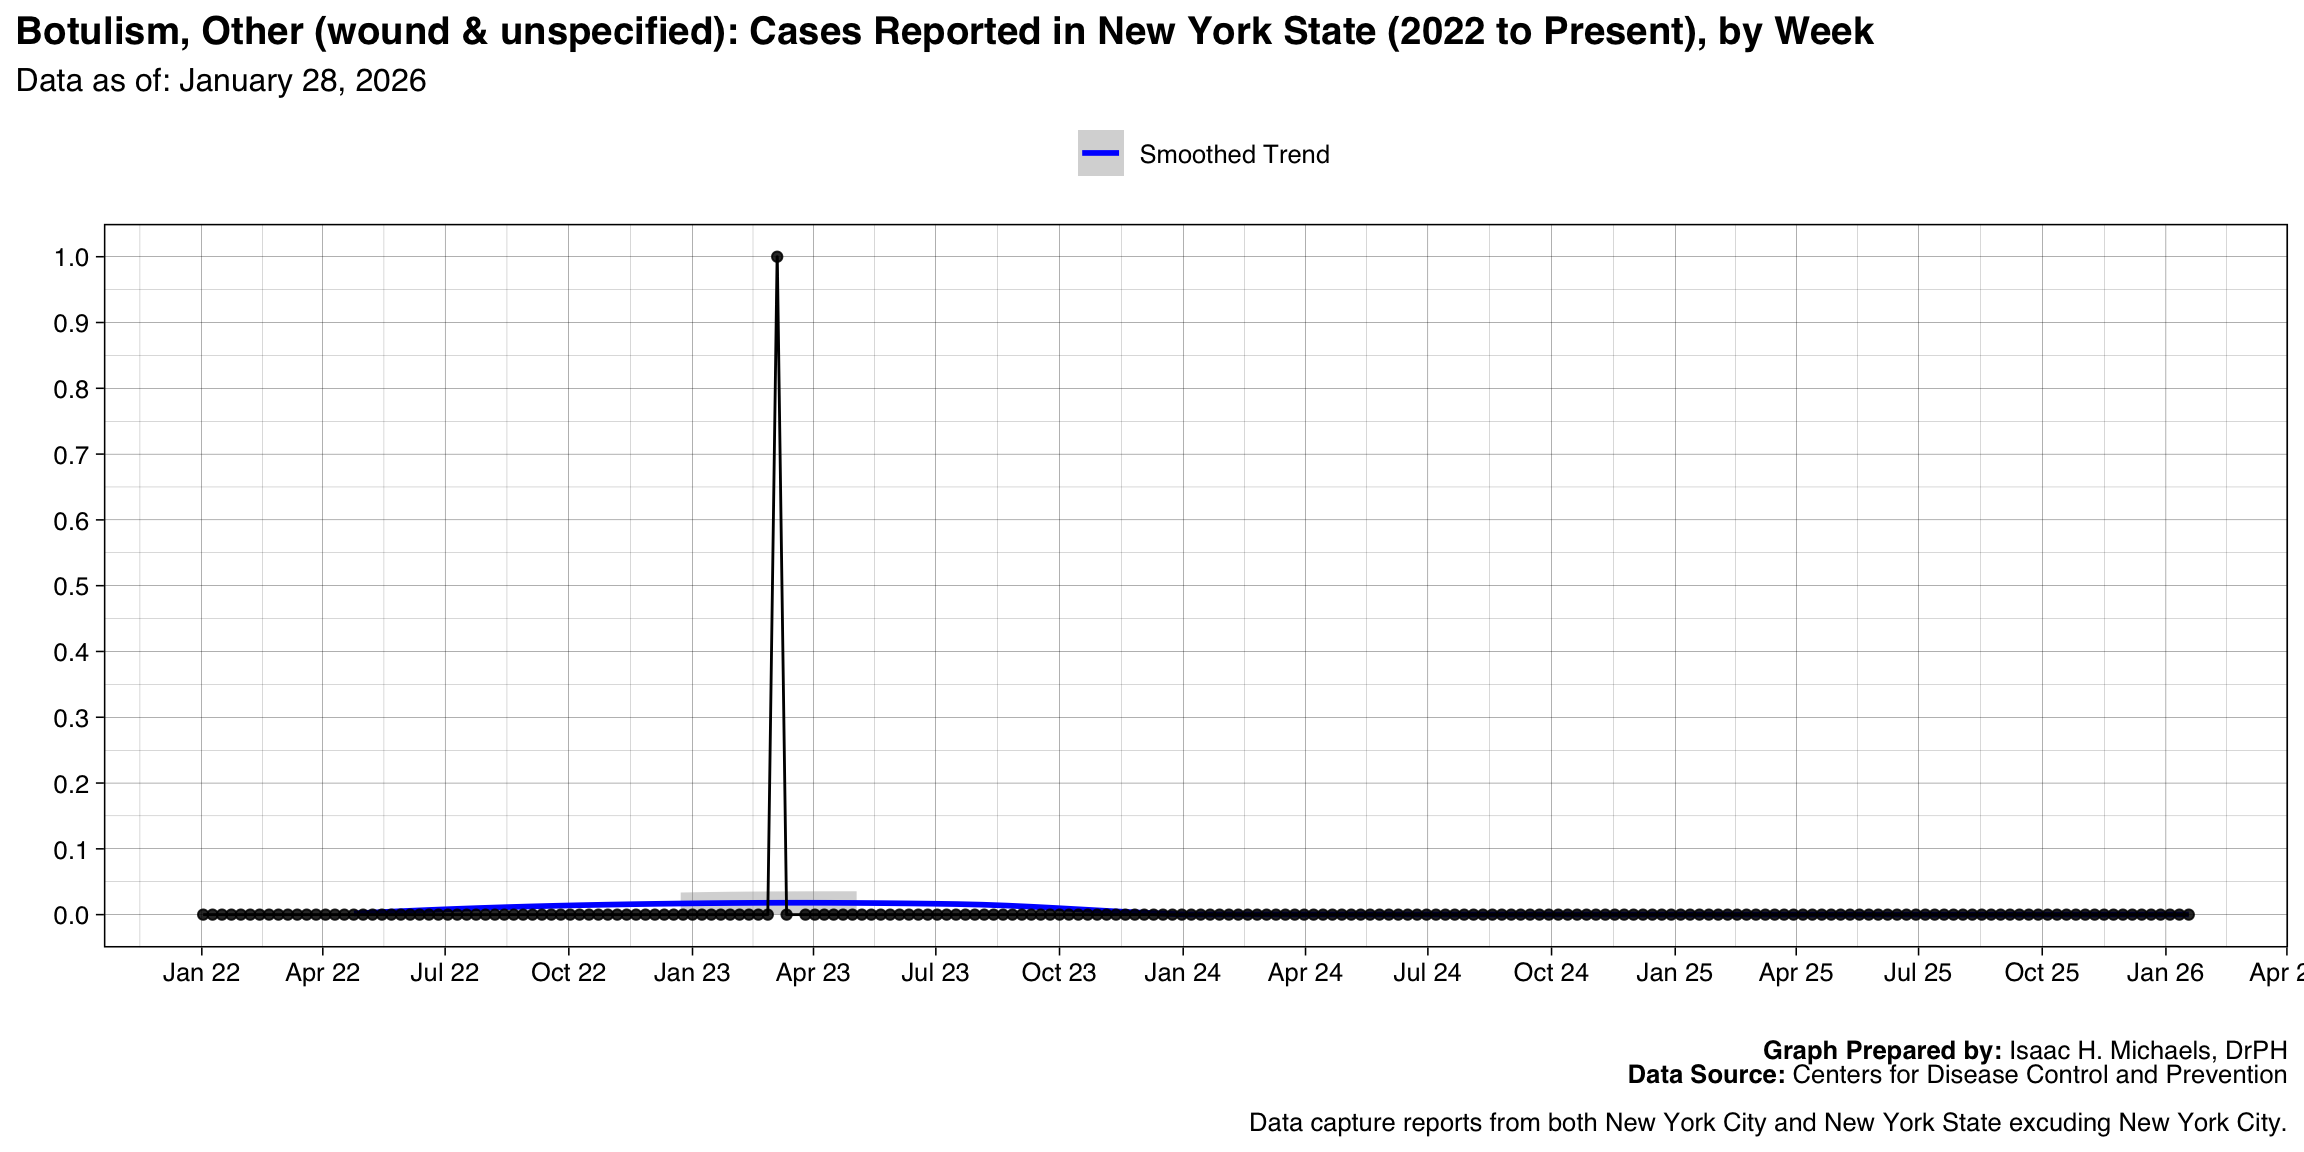
| Botulism, Other (wound & unspecified) | 2023-03-05 | 2023-03-05 | 0 | 1 | |
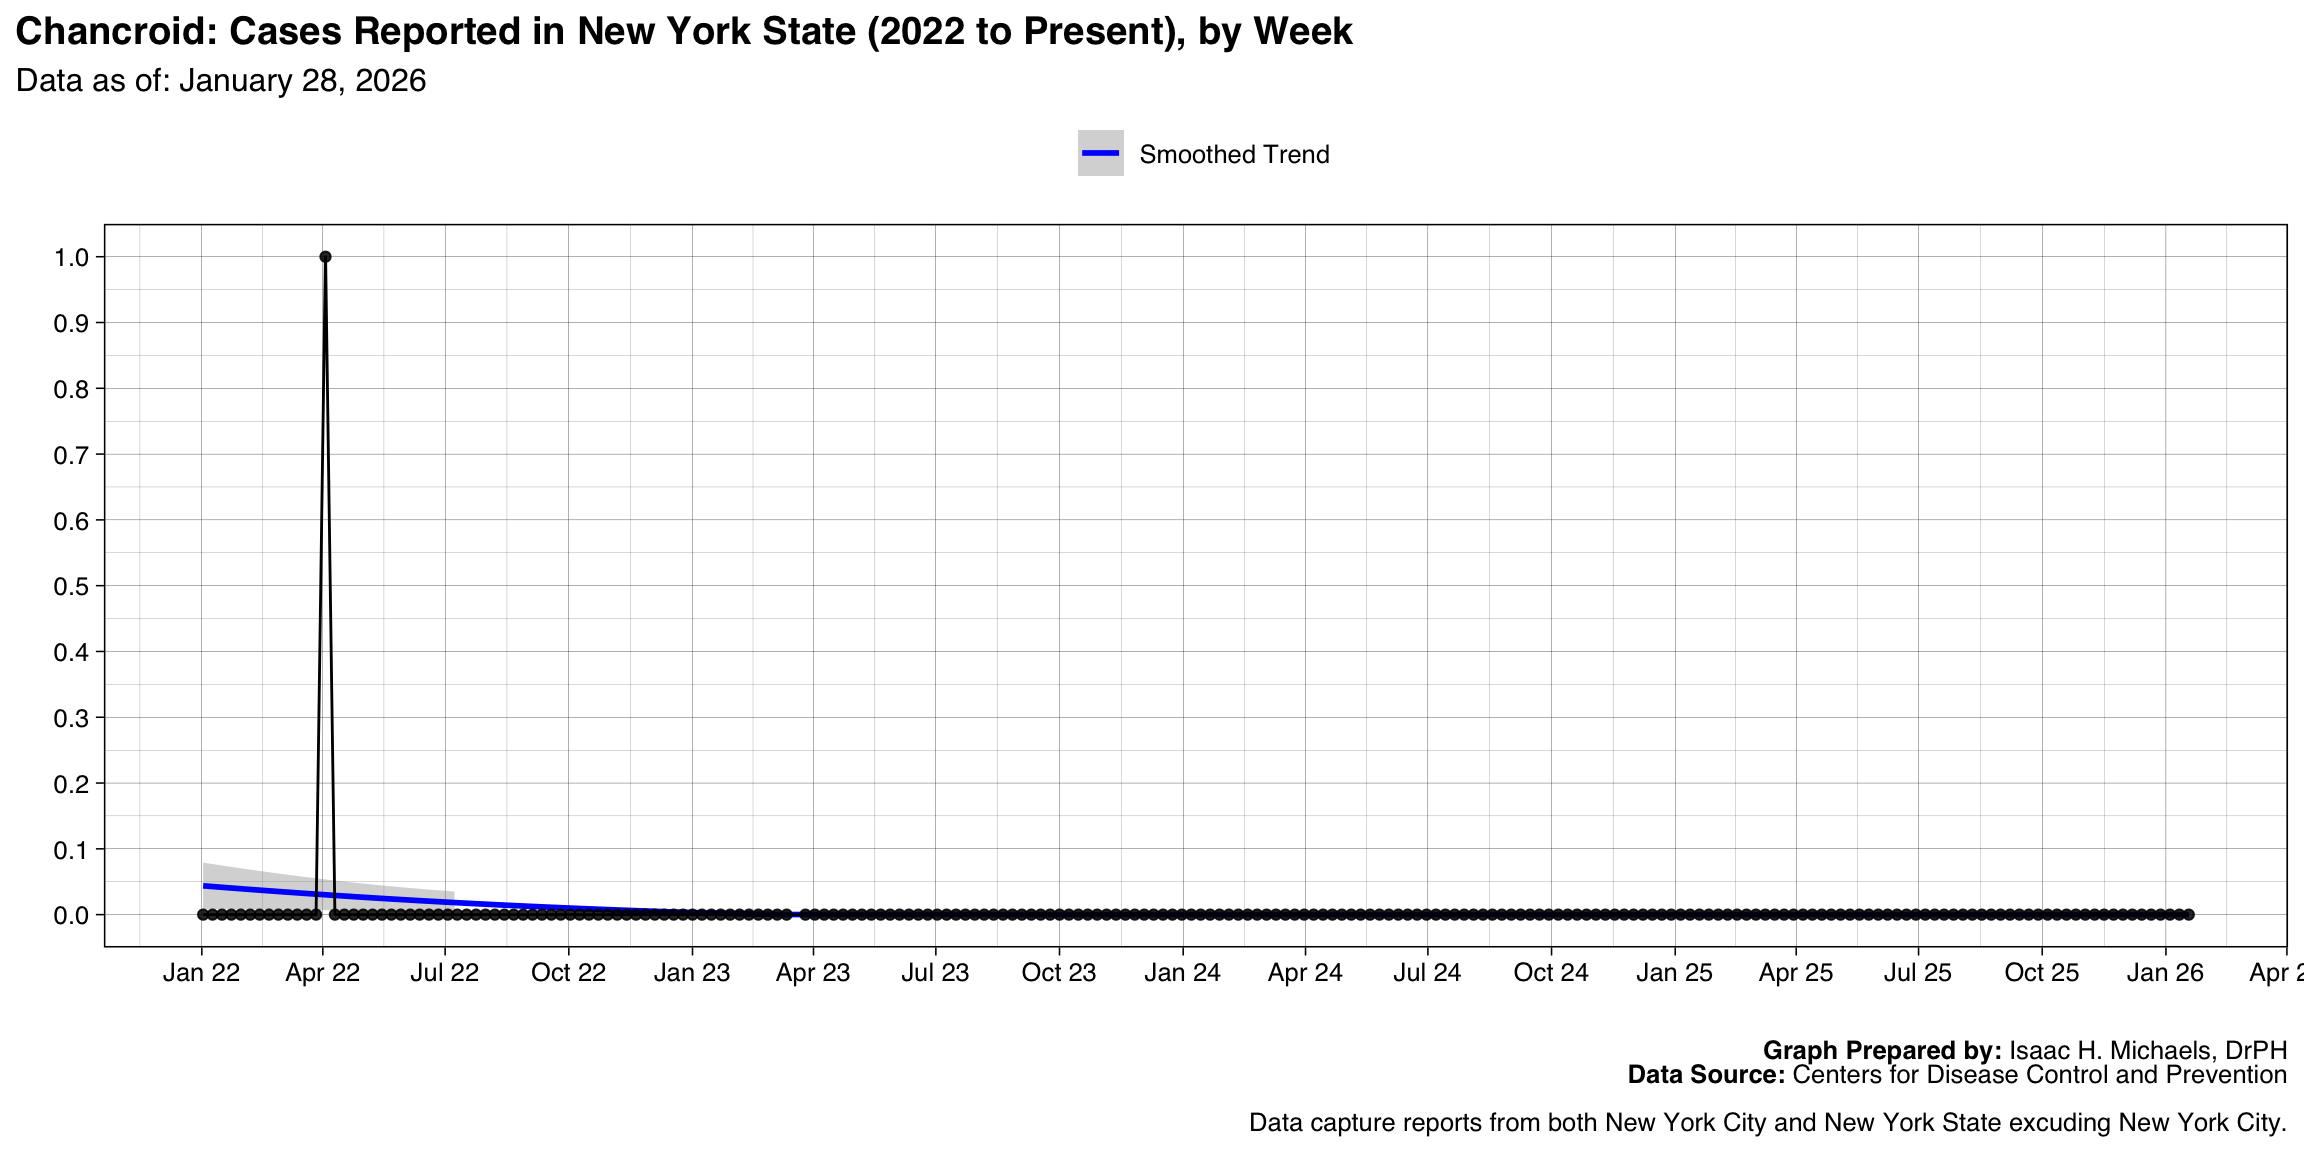
| Chancroid | 2022-04-03 | 2022-04-03 | 0 | 1 | |
| Hantavirus pulmonary syndrome | 2026-03-08 | 2026-03-08 | 0 | 1 | |
| Hepatitis B, perinatal infection | 2022-10-30 | 2022-10-30 | NA | 1 | |
| Meningococcal disease, Other serogroups | 2026-03-22 | 2026-03-22 | 0 | 1 | |
| Rubella | 2023-04-09 | 2023-04-09 | 0 | 1 | |
| Latest MMWR Week Reported: July 19, 2026 | |||||
| Data as of: July 29, 2026 | |||||
Table Prepared By: Isaac H. Michaels, DrPH
Data Source: U.S. Centers for Disease Control and Prevention
Longitudinal Trends
Chlamydia trachomatis infection
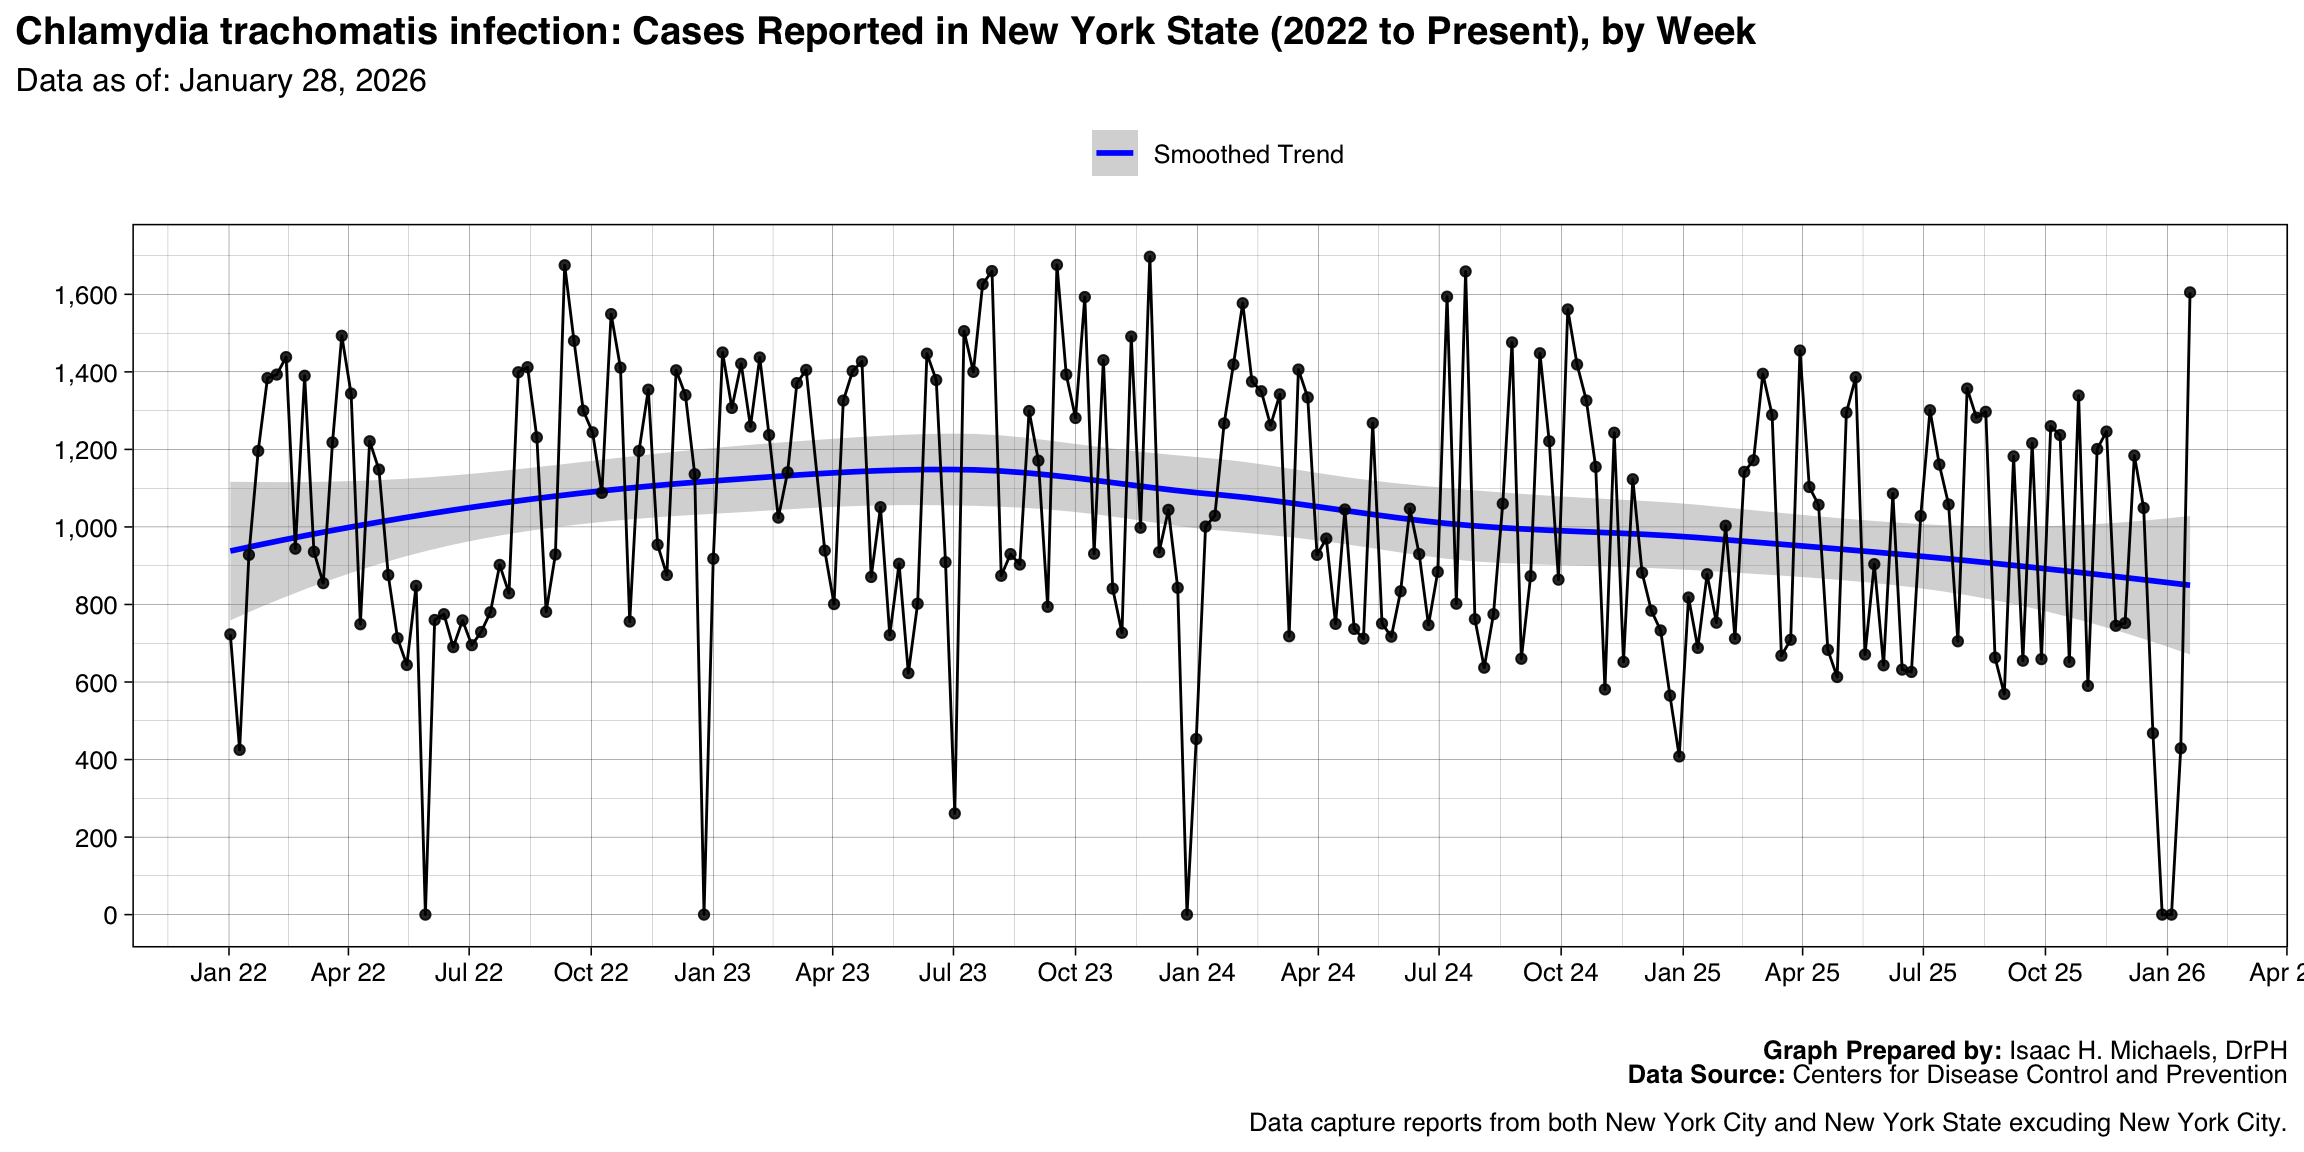
Graph Prepared By: Isaac H. Michaels, DrPH
Death Data Source: U.S. Centers for Disease Control and Prevention
Gonorrhea
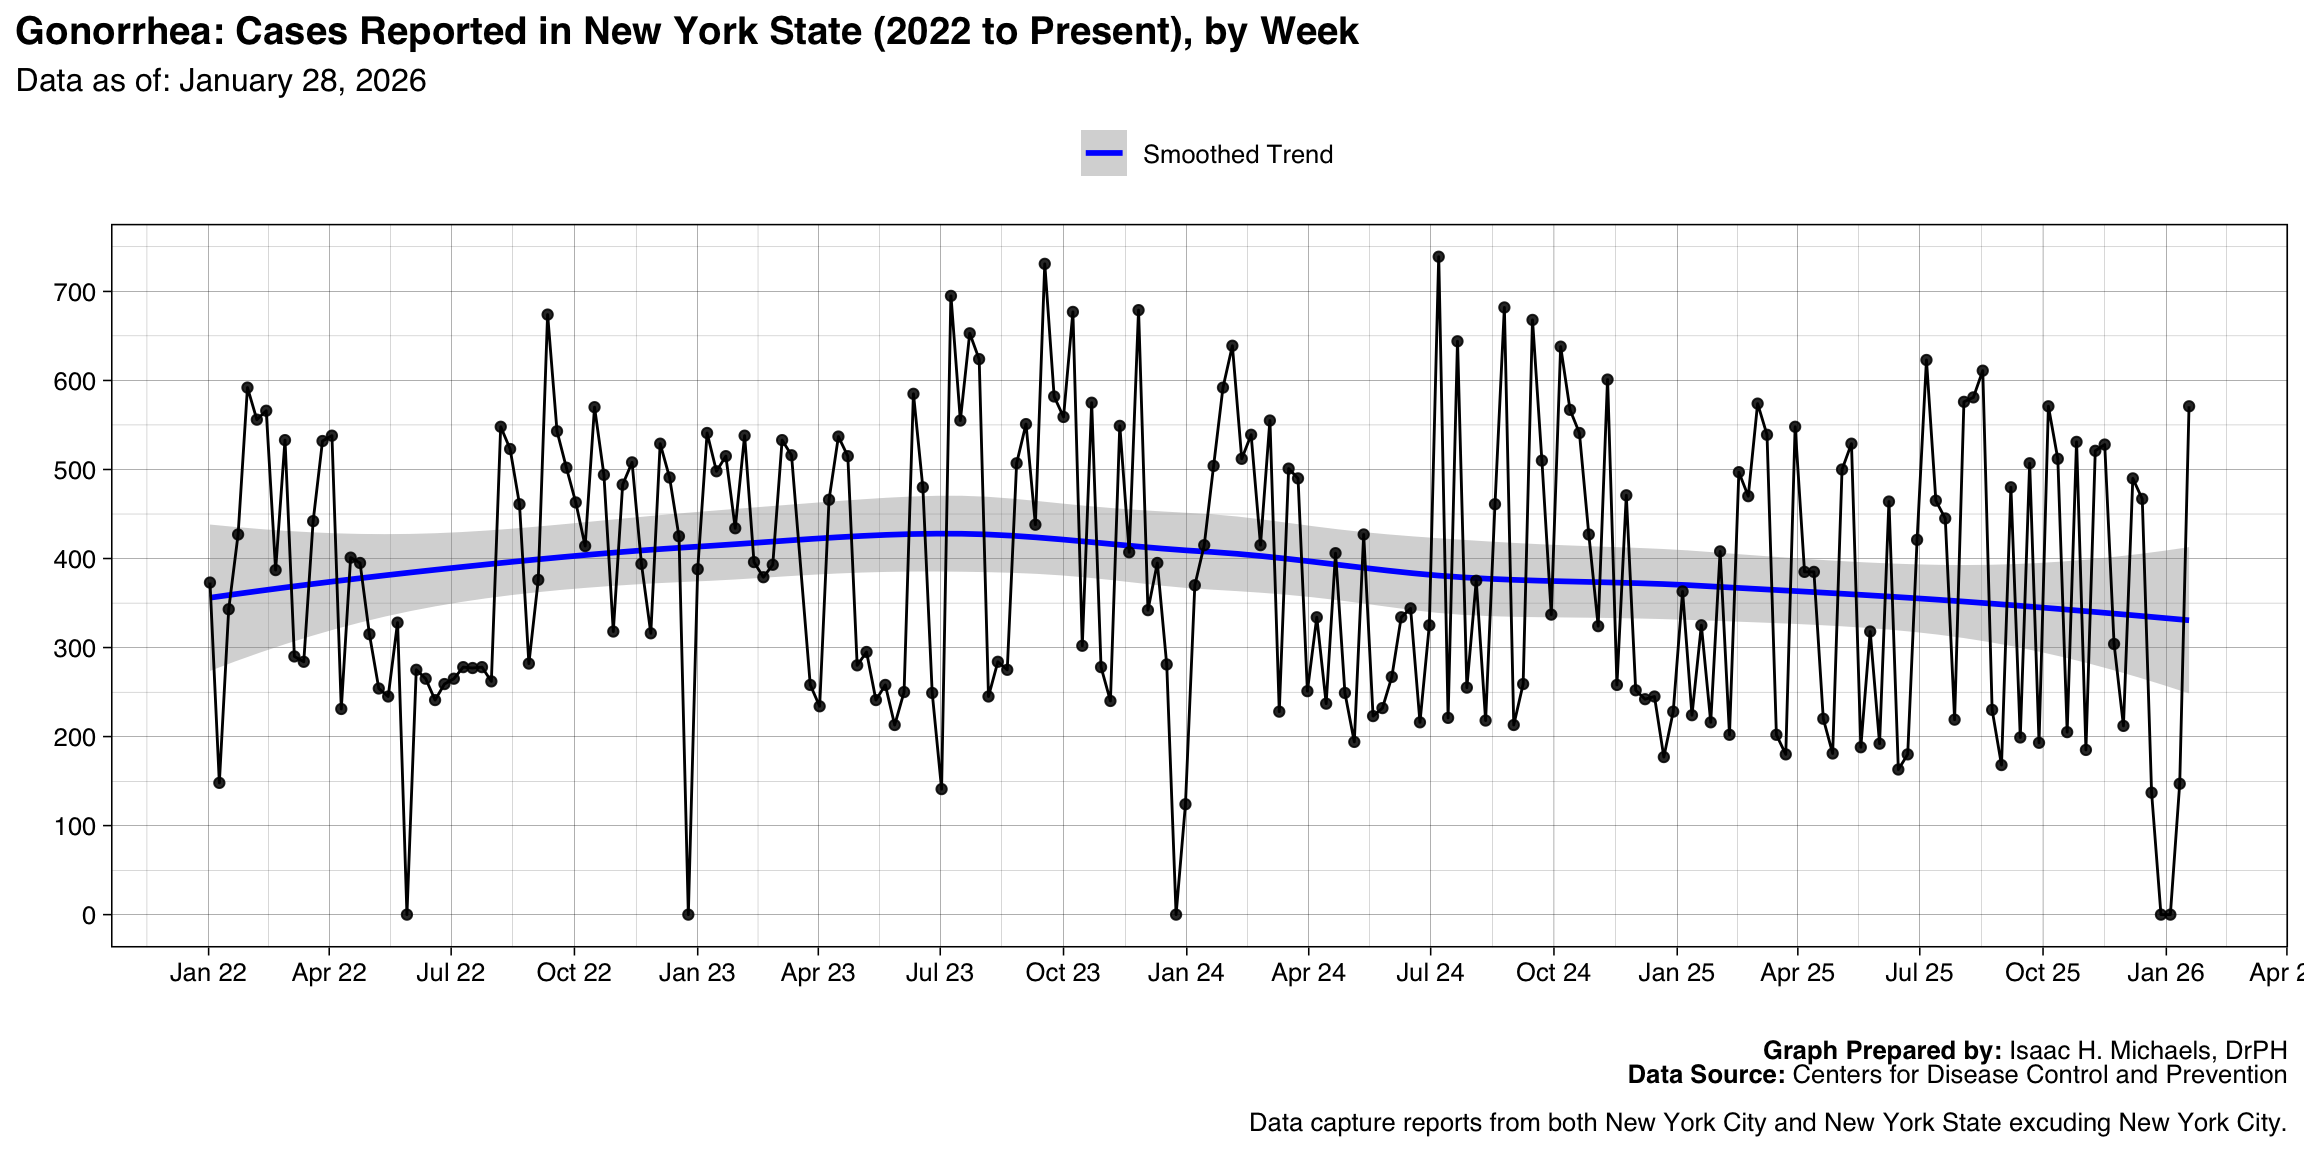
Graph Prepared By: Isaac H. Michaels, DrPH
Death Data Source: U.S. Centers for Disease Control and Prevention
Campylobacteriosis
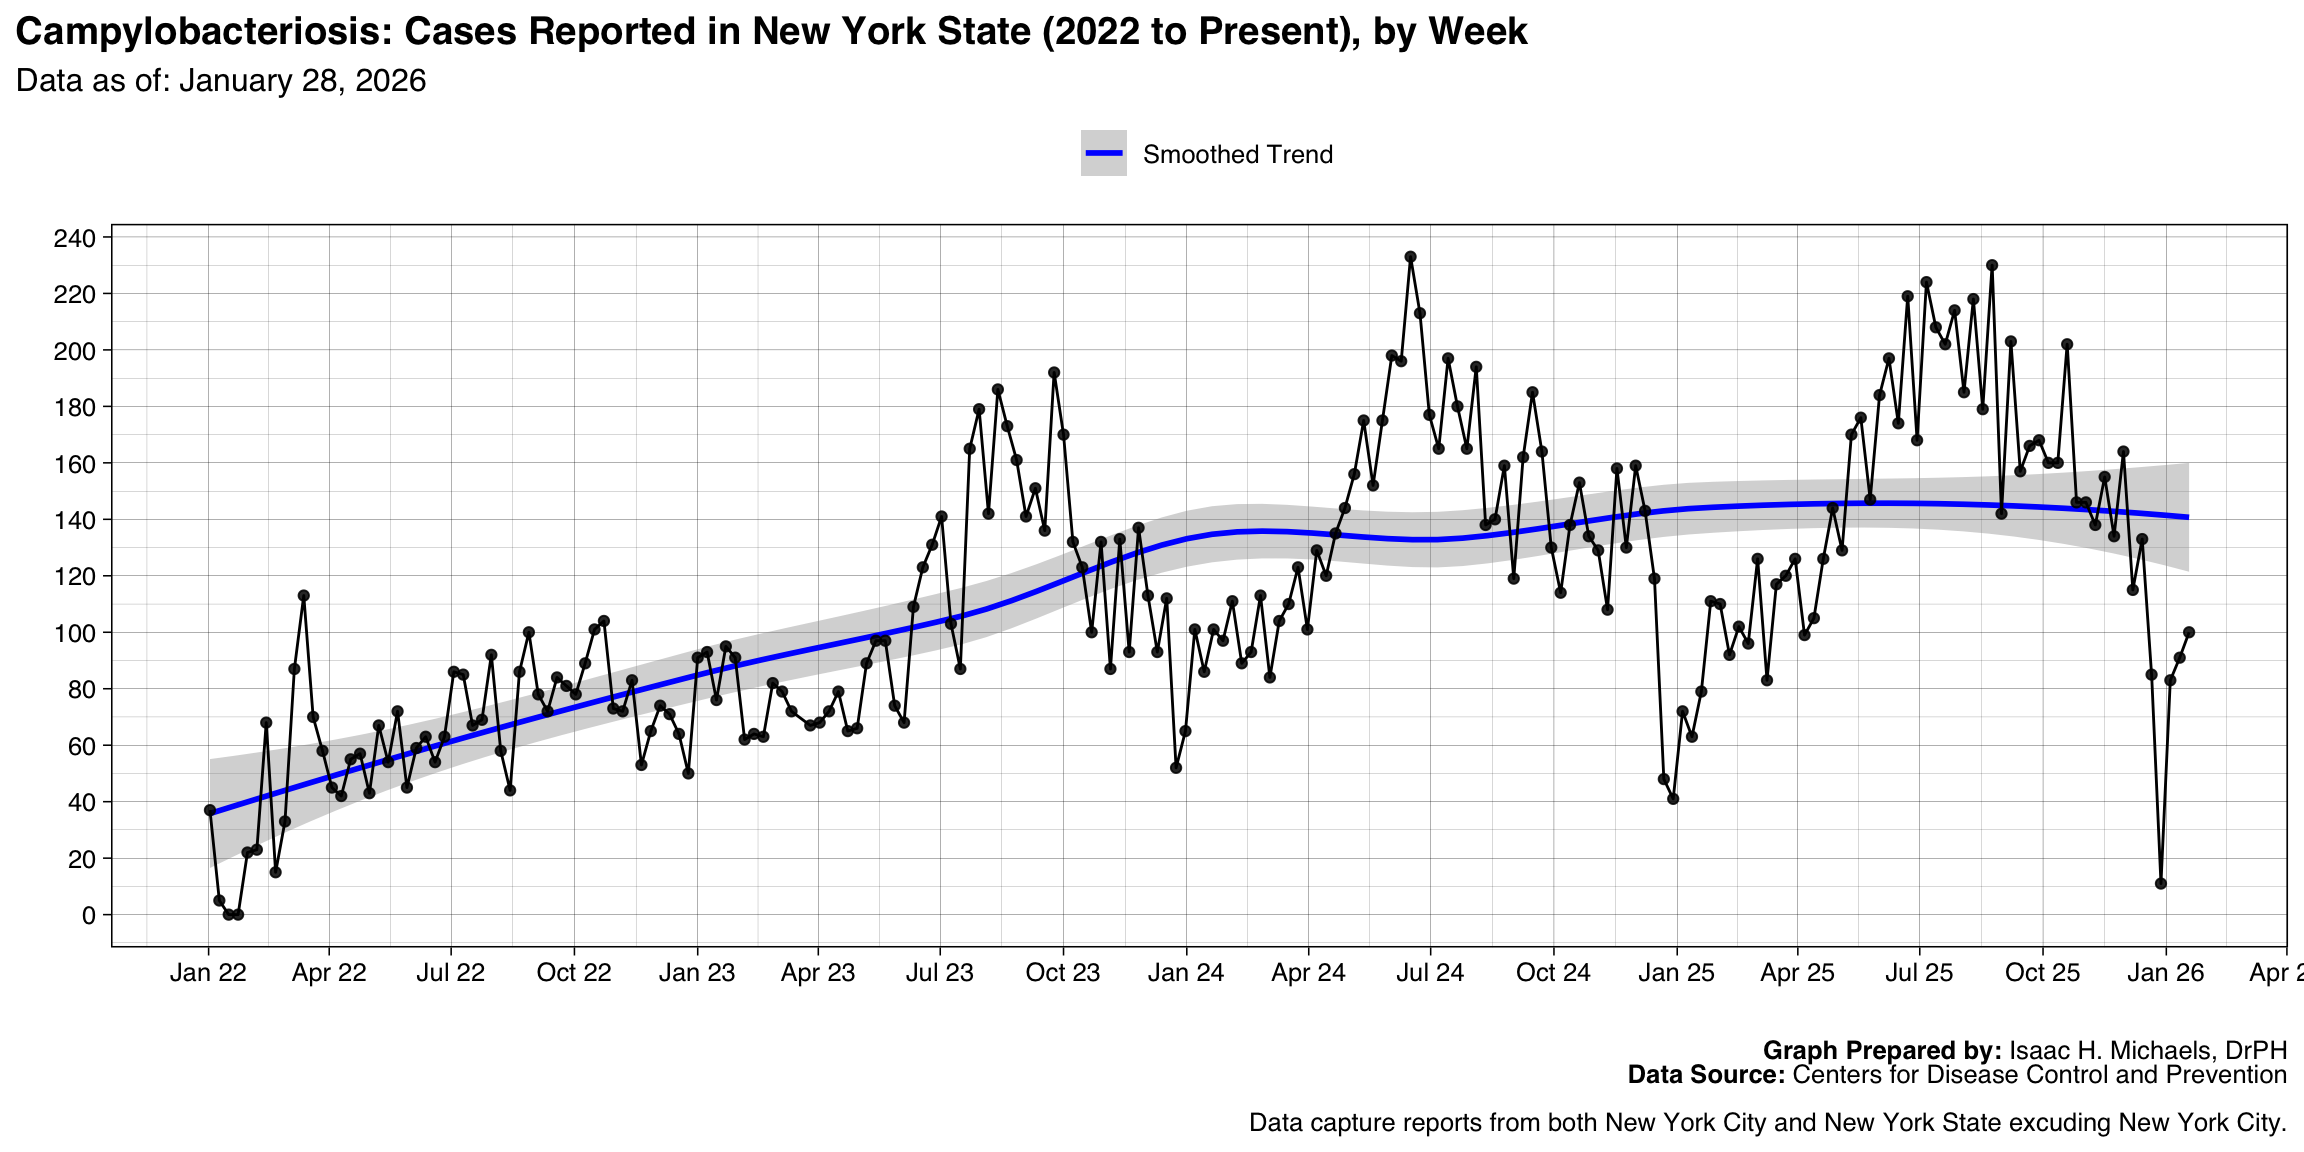
Graph Prepared By: Isaac H. Michaels, DrPH
Death Data Source: U.S. Centers for Disease Control and Prevention
Salmonellosis (excluding Salmonella Typhi infection and Salmonella Paratyphi infection)

Graph Prepared By: Isaac H. Michaels, DrPH
Death Data Source: U.S. Centers for Disease Control and Prevention
Hepatitis B, chronic, Confirmed
Graph Prepared By: Isaac H. Michaels, DrPH
Death Data Source: U.S. Centers for Disease Control and Prevention
Shigellosis
Graph Prepared By: Isaac H. Michaels, DrPH
Death Data Source: U.S. Centers for Disease Control and Prevention
Giardiasis
Graph Prepared By: Isaac H. Michaels, DrPH
Death Data Source: U.S. Centers for Disease Control and Prevention
Hepatitis C, chronic, Probable
Graph Prepared By: Isaac H. Michaels, DrPH
Death Data Source: U.S. Centers for Disease Control and Prevention
Invasive pneumococcal disease, all ages, Confirmed
Graph Prepared By: Isaac H. Michaels, DrPH
Death Data Source: U.S. Centers for Disease Control and Prevention
Hepatitis C, chronic, Confirmed
Graph Prepared By: Isaac H. Michaels, DrPH
Death Data Source: U.S. Centers for Disease Control and Prevention
Shiga toxin-producing Escherichia coli (STEC)
Graph Prepared By: Isaac H. Michaels, DrPH
Death Data Source: U.S. Centers for Disease Control and Prevention
Syphilis, Primary and secondary
Graph Prepared By: Isaac H. Michaels, DrPH
Death Data Source: U.S. Centers for Disease Control and Prevention
Ehrlichiosis and Anaplasmosis, Anaplasma phagocytophilum infection
Graph Prepared By: Isaac H. Michaels, DrPH
Death Data Source: U.S. Centers for Disease Control and Prevention
Pertussis
Graph Prepared By: Isaac H. Michaels, DrPH
Death Data Source: U.S. Centers for Disease Control and Prevention
Tuberculosis
Graph Prepared By: Isaac H. Michaels, DrPH
Death Data Source: U.S. Centers for Disease Control and Prevention
Legionellosis
Graph Prepared By: Isaac H. Michaels, DrPH
Death Data Source: U.S. Centers for Disease Control and Prevention
Hepatitis B, chronic, Probable
Graph Prepared By: Isaac H. Michaels, DrPH
Death Data Source: U.S. Centers for Disease Control and Prevention
Babesiosis
Graph Prepared By: Isaac H. Michaels, DrPH
Death Data Source: U.S. Centers for Disease Control and Prevention
Cryptosporidiosis
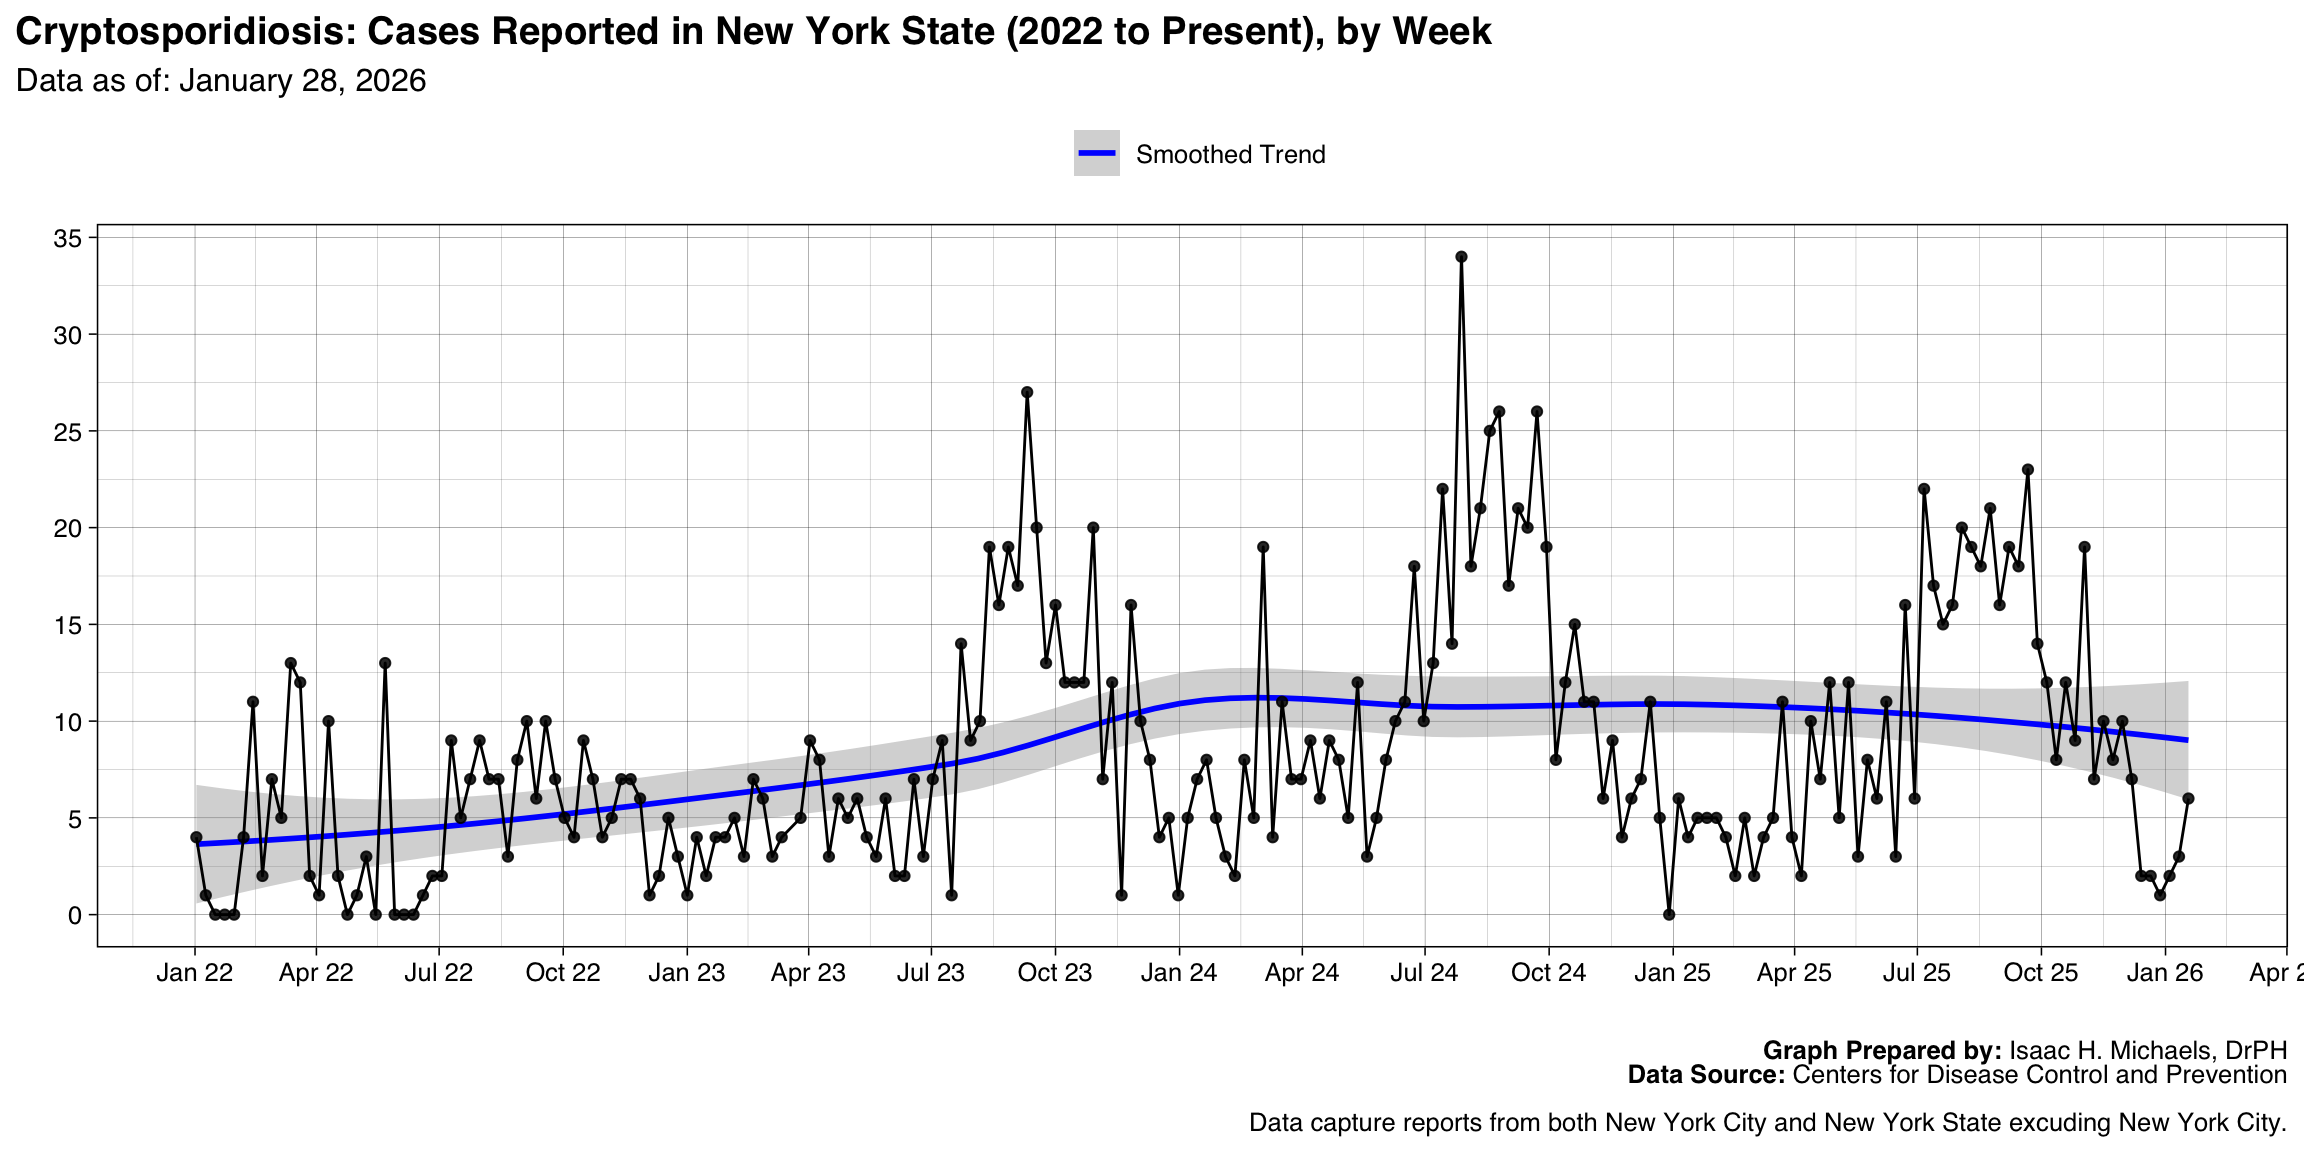
Graph Prepared By: Isaac H. Michaels, DrPH
Death Data Source: U.S. Centers for Disease Control and Prevention
Haemophilus influenzae, invasive disease, All ages, all serotypes
Graph Prepared By: Isaac H. Michaels, DrPH
Death Data Source: U.S. Centers for Disease Control and Prevention
Cyclosporiasis
Graph Prepared By: Isaac H. Michaels, DrPH
Death Data Source: U.S. Centers for Disease Control and Prevention
Hepatitis C, acute, Confirmed
Graph Prepared By: Isaac H. Michaels, DrPH
Death Data Source: U.S. Centers for Disease Control and Prevention
Vibriosis (any species of the family Vibrionaceae, other than toxigenic Vibrio cholerae O1 or O139), Probable
Graph Prepared By: Isaac H. Michaels, DrPH
Death Data Source: U.S. Centers for Disease Control and Prevention
Mpox
Graph Prepared By: Isaac H. Michaels, DrPH
Death Data Source: U.S. Centers for Disease Control and Prevention
Invasive pneumococcal disease, all ages, Probable
Graph Prepared By: Isaac H. Michaels, DrPH
Death Data Source: U.S. Centers for Disease Control and Prevention
Ehrlichiosis and Anaplasmosis, Ehrlichia chaffeensis infection
Graph Prepared By: Isaac H. Michaels, DrPH
Death Data Source: U.S. Centers for Disease Control and Prevention
Listeriosis, Confirmed
Graph Prepared By: Isaac H. Michaels, DrPH
Death Data Source: U.S. Centers for Disease Control and Prevention
Malaria
Graph Prepared By: Isaac H. Michaels, DrPH
Death Data Source: U.S. Centers for Disease Control and Prevention
Invasive pneumococcal disease, age <5 years, Confirmed
Graph Prepared By: Isaac H. Michaels, DrPH
Death Data Source: U.S. Centers for Disease Control and Prevention
Rabies, Animal
Graph Prepared By: Isaac H. Michaels, DrPH
Death Data Source: U.S. Centers for Disease Control and Prevention
Hepatitis A, Confirmed
Graph Prepared By: Isaac H. Michaels, DrPH
Death Data Source: U.S. Centers for Disease Control and Prevention
Vibriosis (any species of the family Vibrionaceae, other than toxigenic Vibrio cholerae O1 or O139), Confirmed

Graph Prepared By: Isaac H. Michaels, DrPH
Death Data Source: U.S. Centers for Disease Control and Prevention
Hepatitis B, acute, Confirmed
Graph Prepared By: Isaac H. Michaels, DrPH
Death Data Source: U.S. Centers for Disease Control and Prevention
Meningococcal disease, All serogroups
Graph Prepared By: Isaac H. Michaels, DrPH
Death Data Source: U.S. Centers for Disease Control and Prevention
Meningococcal disease, Unknown serogroup
Graph Prepared By: Isaac H. Michaels, DrPH
Death Data Source: U.S. Centers for Disease Control and Prevention
Hepatitis, A, acute
Graph Prepared By: Isaac H. Michaels, DrPH
Death Data Source: U.S. Centers for Disease Control and Prevention
Dengue virus infections, Dengue
Graph Prepared By: Isaac H. Michaels, DrPH
Death Data Source: U.S. Centers for Disease Control and Prevention
Haemophilus influenzae, invasive disease, Age <5 years, Unknown serotype
Graph Prepared By: Isaac H. Michaels, DrPH
Death Data Source: U.S. Centers for Disease Control and Prevention
Streptococcal toxic shock syndrome
Graph Prepared By: Isaac H. Michaels, DrPH
Death Data Source: U.S. Centers for Disease Control and Prevention
Salmonella Typhi infection
Graph Prepared By: Isaac H. Michaels, DrPH
Death Data Source: U.S. Centers for Disease Control and Prevention
Hepatitis, B, acute
Graph Prepared By: Isaac H. Michaels, DrPH
Death Data Source: U.S. Centers for Disease Control and Prevention
Hepatitis C, acute, Probable
Graph Prepared By: Isaac H. Michaels, DrPH
Death Data Source: U.S. Centers for Disease Control and Prevention
Arboviral diseases, West Nile virus disease
Graph Prepared By: Isaac H. Michaels, DrPH
Death Data Source: U.S. Centers for Disease Control and Prevention
Listeriosis, Probable
Graph Prepared By: Isaac H. Michaels, DrPH
Death Data Source: U.S. Centers for Disease Control and Prevention
Mumps
Graph Prepared By: Isaac H. Michaels, DrPH
Death Data Source: U.S. Centers for Disease Control and Prevention
Influenza-associated pediatric mortality
Graph Prepared By: Isaac H. Michaels, DrPH
Death Data Source: U.S. Centers for Disease Control and Prevention
Hepatitis B, acute, Probable
Graph Prepared By: Isaac H. Michaels, DrPH
Death Data Source: U.S. Centers for Disease Control and Prevention
Leptospirosis
Graph Prepared By: Isaac H. Michaels, DrPH
Death Data Source: U.S. Centers for Disease Control and Prevention
Measles, Indigenous
Graph Prepared By: Isaac H. Michaels, DrPH
Death Data Source: U.S. Centers for Disease Control and Prevention
Q fever, Total
Graph Prepared By: Isaac H. Michaels, DrPH
Death Data Source: U.S. Centers for Disease Control and Prevention
Vancomycin-intermediate Staphylococcus aureus
Graph Prepared By: Isaac H. Michaels, DrPH
Death Data Source: U.S. Centers for Disease Control and Prevention
Brucellosis
Graph Prepared By: Isaac H. Michaels, DrPH
Death Data Source: U.S. Centers for Disease Control and Prevention
Tularemia
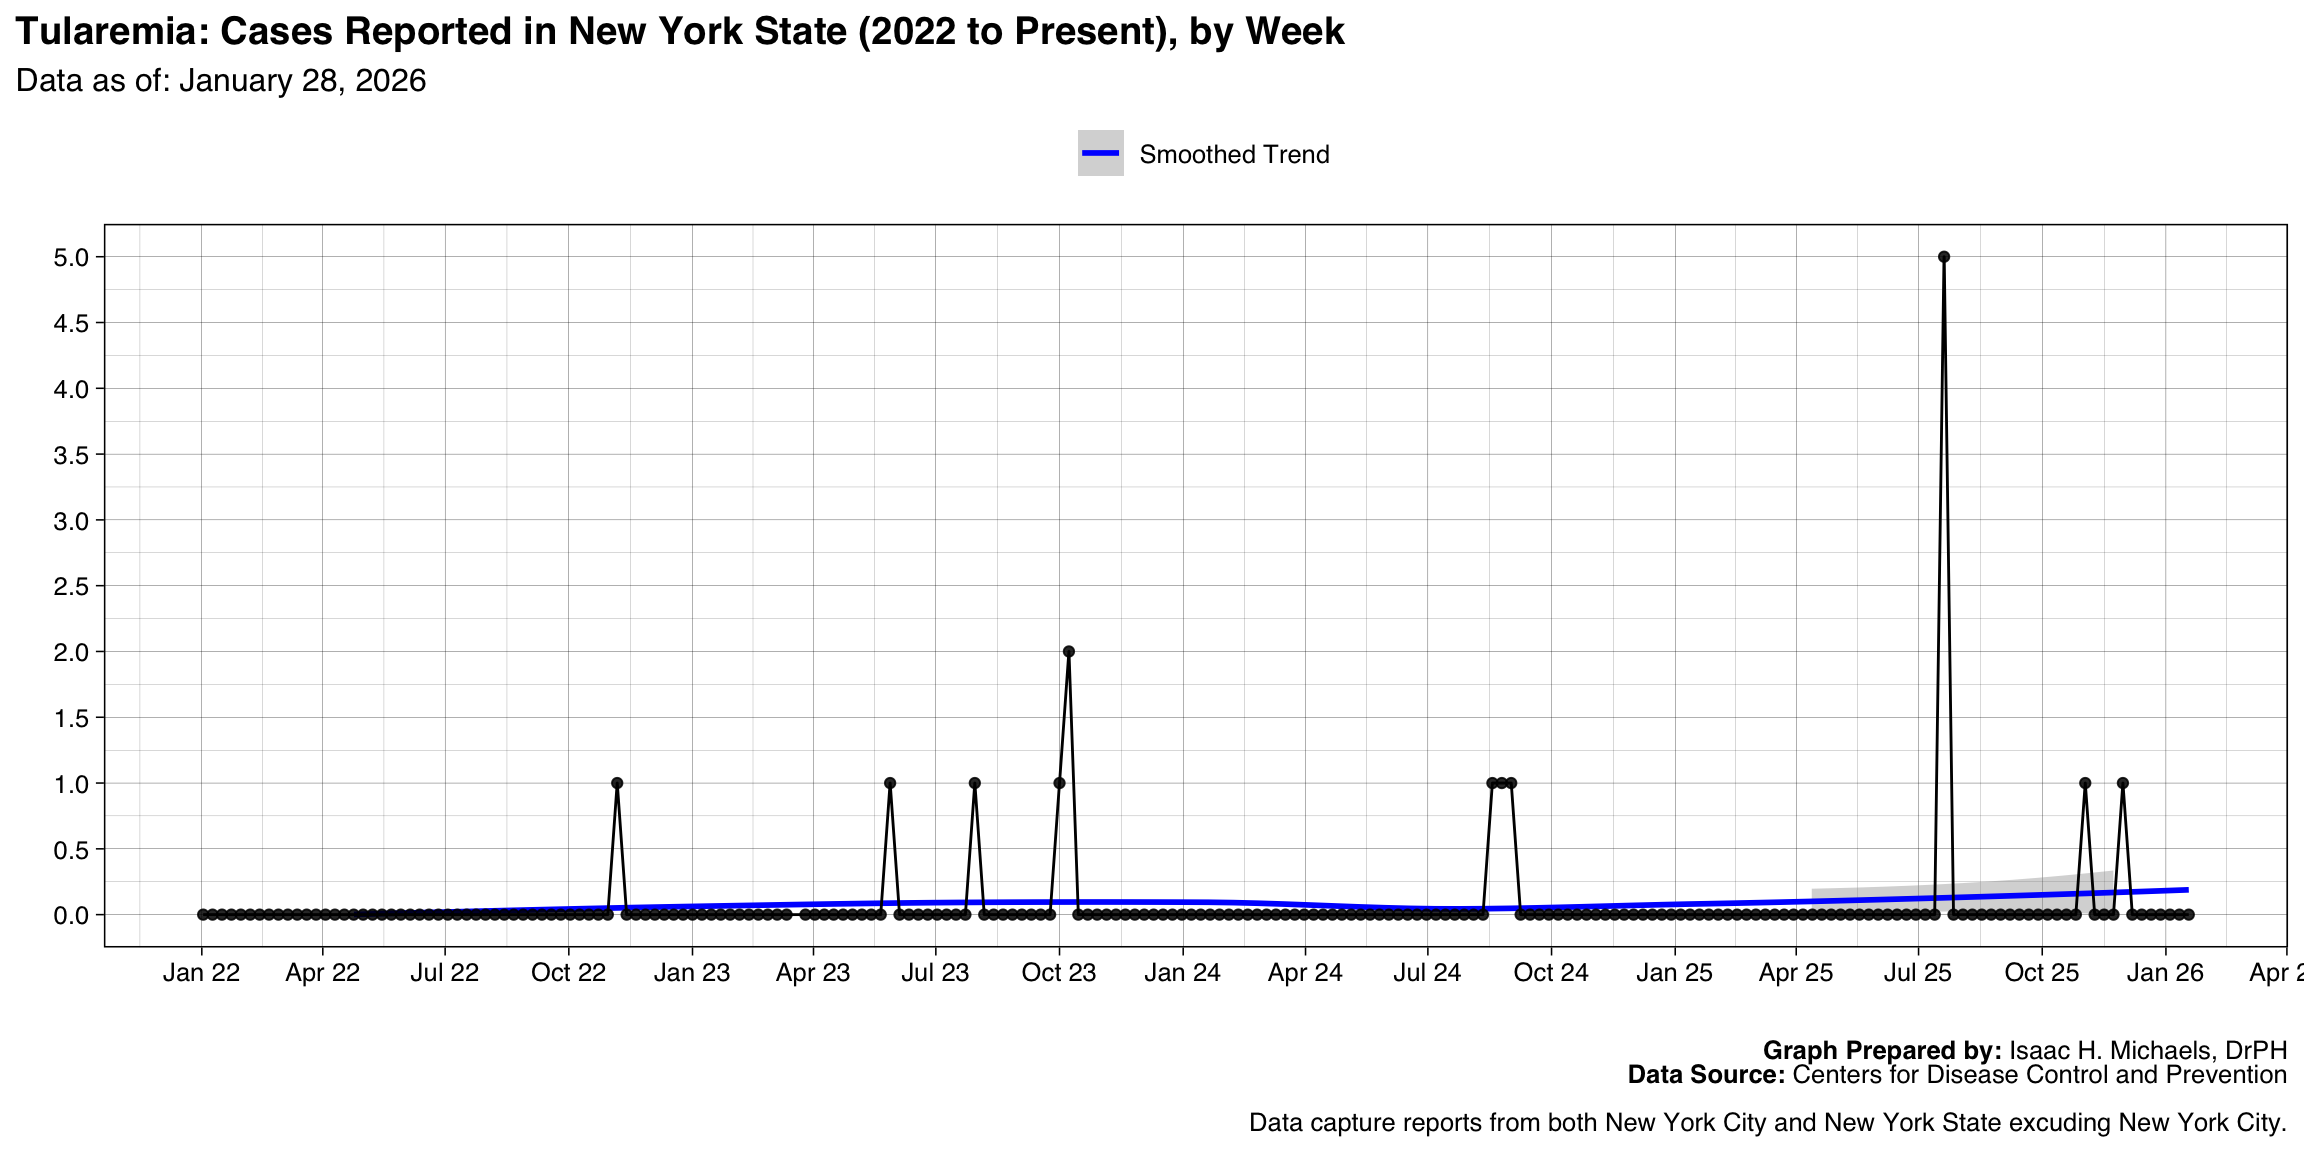
Graph Prepared By: Isaac H. Michaels, DrPH
Death Data Source: U.S. Centers for Disease Control and Prevention
Q fever, Acute
Graph Prepared By: Isaac H. Michaels, DrPH
Death Data Source: U.S. Centers for Disease Control and Prevention
Salmonella Paratyphi infection
Graph Prepared By: Isaac H. Michaels, DrPH
Death Data Source: U.S. Centers for Disease Control and Prevention
Invasive pneumococcal disease, age <5 years, Probable
Graph Prepared By: Isaac H. Michaels, DrPH
Death Data Source: U.S. Centers for Disease Control and Prevention
Measles, Imported
Graph Prepared By: Isaac H. Michaels, DrPH
Death Data Source: U.S. Centers for Disease Control and Prevention
Arboviral diseases, Chikungunya virus disease
Graph Prepared By: Isaac H. Michaels, DrPH
Death Data Source: U.S. Centers for Disease Control and Prevention
Ehrlichiosis and Anaplasmosis, Undetermined ehrlichiosis/anaplasmosis
Graph Prepared By: Isaac H. Michaels, DrPH
Death Data Source: U.S. Centers for Disease Control and Prevention
Haemophilus influenzae, invasive disease, Age <5 years, Serotype b
Graph Prepared By: Isaac H. Michaels, DrPH
Death Data Source: U.S. Centers for Disease Control and Prevention
Hepatitis C, perinatal infection
Graph Prepared By: Isaac H. Michaels, DrPH
Death Data Source: U.S. Centers for Disease Control and Prevention
SalmonellaParatyphi infection
Graph Prepared By: Isaac H. Michaels, DrPH
Death Data Source: U.S. Centers for Disease Control and Prevention
Toxic shock syndrome (other than Streptococcal)
Graph Prepared By: Isaac H. Michaels, DrPH
Death Data Source: U.S. Centers for Disease Control and Prevention
Haemophilus influenzae, invasive disease, Age <5 years, Nontypeable

Graph Prepared By: Isaac H. Michaels, DrPH
Death Data Source: U.S. Centers for Disease Control and Prevention
Haemophilus influenzae, invasive disease, Age <5 years, Non-b serotype
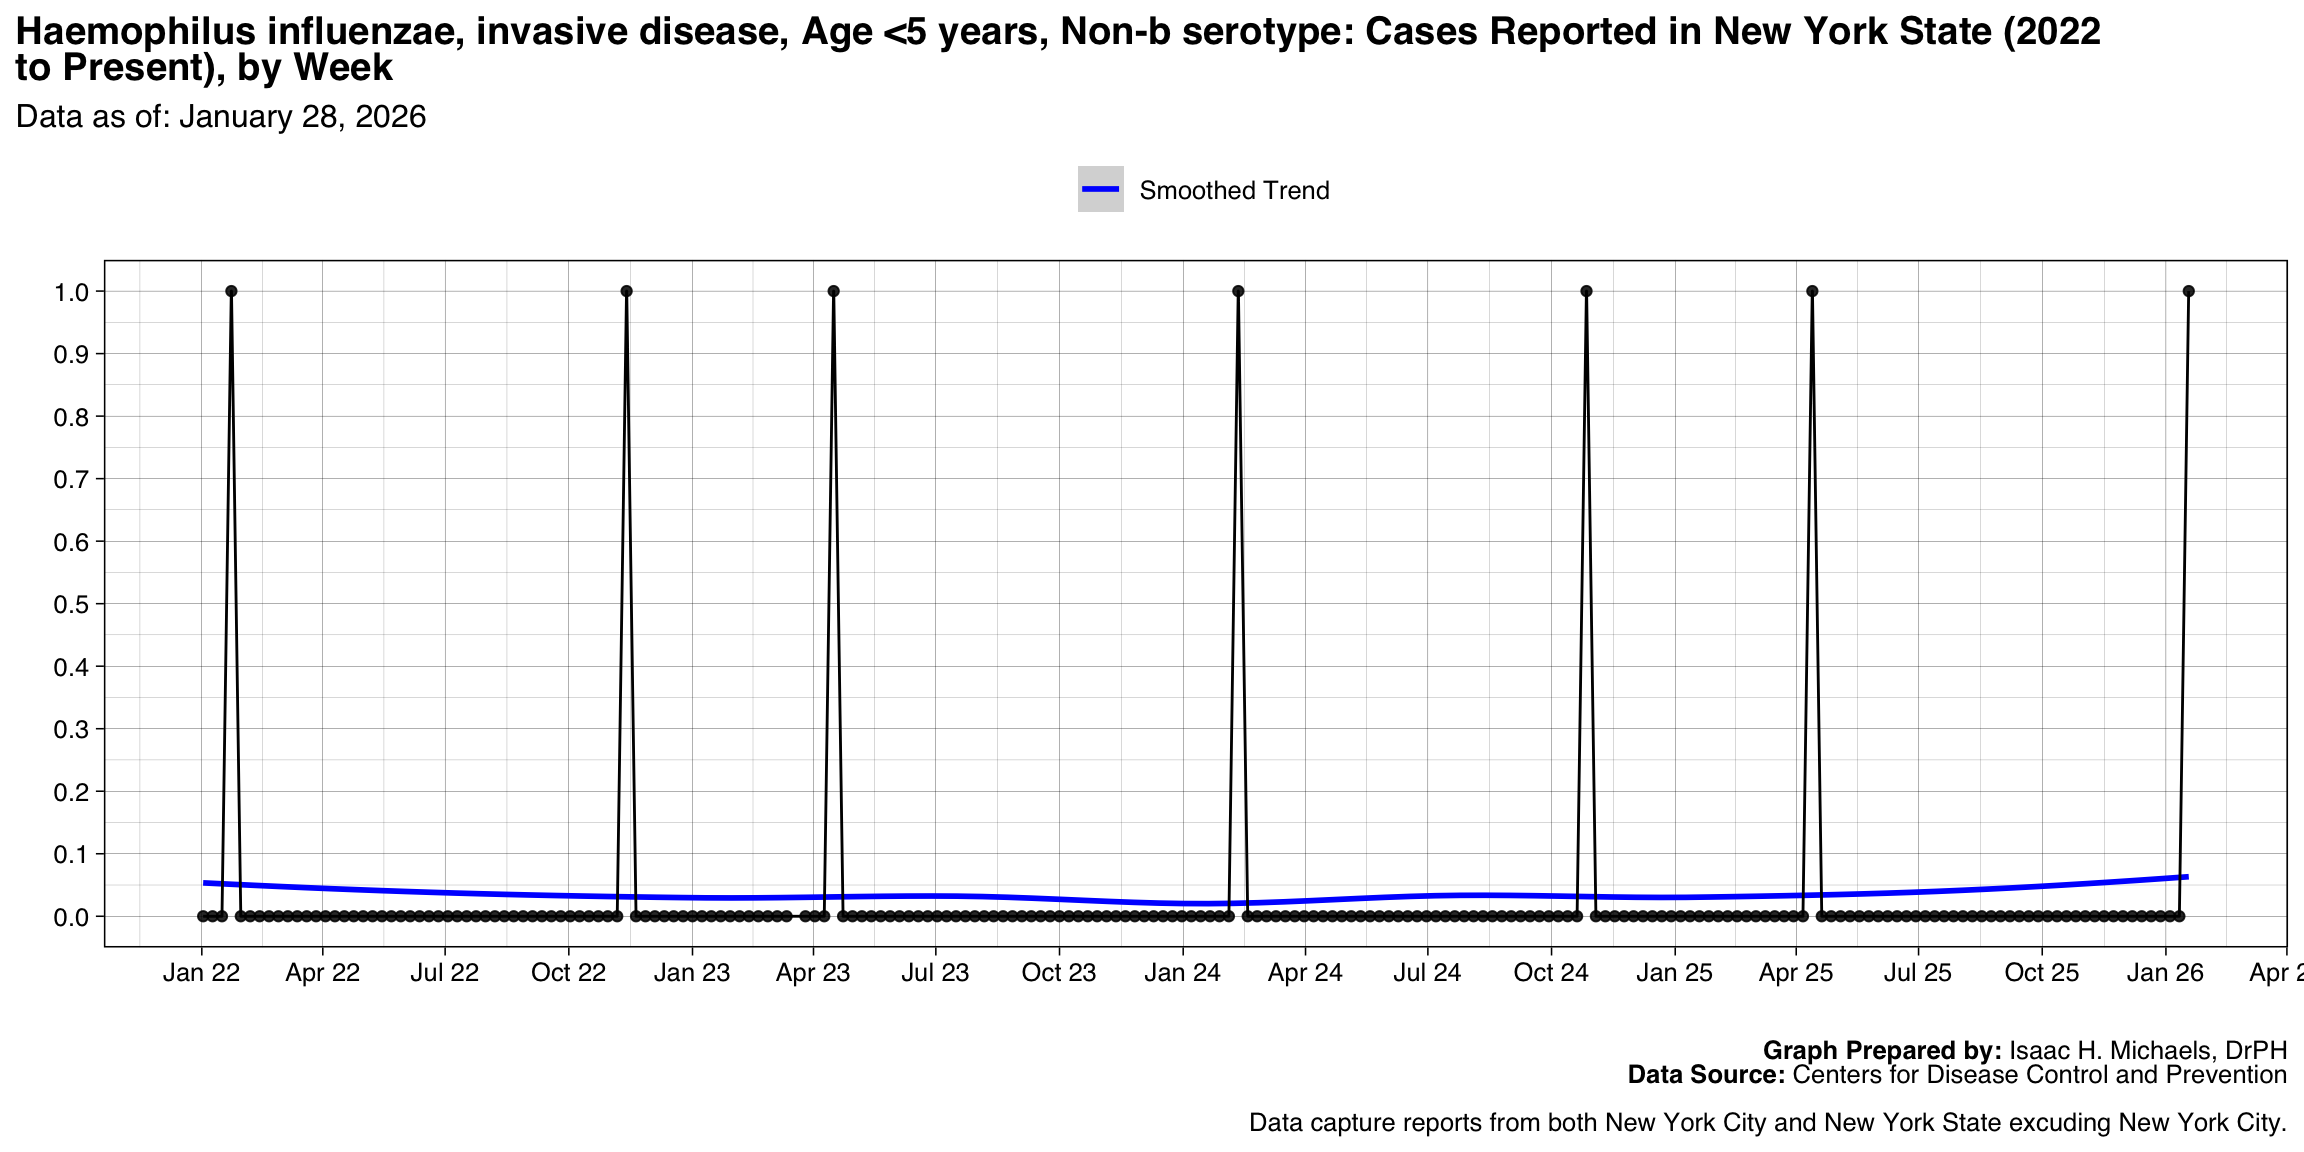
Graph Prepared By: Isaac H. Michaels, DrPH
Death Data Source: U.S. Centers for Disease Control and Prevention
Hemolytic uremic syndrome post-diarrheal
Graph Prepared By: Isaac H. Michaels, DrPH
Death Data Source: U.S. Centers for Disease Control and Prevention
Arboviral diseases, Powassan virus disease
Graph Prepared By: Isaac H. Michaels, DrPH
Death Data Source: U.S. Centers for Disease Control and Prevention
Meningococcal disease, Serogroup B
Graph Prepared By: Isaac H. Michaels, DrPH
Death Data Source: U.S. Centers for Disease Control and Prevention
Q fever, Chronic
Graph Prepared By: Isaac H. Michaels, DrPH
Death Data Source: U.S. Centers for Disease Control and Prevention
Botulism, Infant
Graph Prepared By: Isaac H. Michaels, DrPH
Death Data Source: U.S. Centers for Disease Control and Prevention
Hansen’s disease
Graph Prepared By: Isaac H. Michaels, DrPH
Death Data Source: U.S. Centers for Disease Control and Prevention
Hepatitis C, perinatal, Confirmed
Graph Prepared By: Isaac H. Michaels, DrPH
Death Data Source: U.S. Centers for Disease Control and Prevention
Meningococcal disease, Serogroups ACWY
Graph Prepared By: Isaac H. Michaels, DrPH
Death Data Source: U.S. Centers for Disease Control and Prevention
Arboviral diseases, Eastern equine encephalitis virus disease
Graph Prepared By: Isaac H. Michaels, DrPH
Death Data Source: U.S. Centers for Disease Control and Prevention
Ehrlichiosis and Anaplasmosis, Ehrlichia ewingii infection
Graph Prepared By: Isaac H. Michaels, DrPH
Death Data Source: U.S. Centers for Disease Control and Prevention
Hepatitis B, acute
Graph Prepared By: Isaac H. Michaels, DrPH
Death Data Source: U.S. Centers for Disease Control and Prevention
Hepatitis B, perinatal, Confirmed
Graph Prepared By: Isaac H. Michaels, DrPH
Death Data Source: U.S. Centers for Disease Control and Prevention
Leprosy (Hansen’s disease)
Graph Prepared By: Isaac H. Michaels, DrPH
Death Data Source: U.S. Centers for Disease Control and Prevention
Tetanus
Graph Prepared By: Isaac H. Michaels, DrPH
Death Data Source: U.S. Centers for Disease Control and Prevention
Botulism, Foodborne
Graph Prepared By: Isaac H. Michaels, DrPH
Death Data Source: U.S. Centers for Disease Control and Prevention
Botulism, Other (wound & unspecified)
Graph Prepared By: Isaac H. Michaels, DrPH
Death Data Source: U.S. Centers for Disease Control and Prevention
Chancroid
Graph Prepared By: Isaac H. Michaels, DrPH
Death Data Source: U.S. Centers for Disease Control and Prevention
Hantavirus pulmonary syndrome
Graph Prepared By: Isaac H. Michaels, DrPH
Death Data Source: U.S. Centers for Disease Control and Prevention
Hepatitis B, perinatal infection

Graph Prepared By: Isaac H. Michaels, DrPH
Death Data Source: U.S. Centers for Disease Control and Prevention
Meningococcal disease, Other serogroups

Graph Prepared By: Isaac H. Michaels, DrPH
Death Data Source: U.S. Centers for Disease Control and Prevention
Rubella

Graph Prepared By: Isaac H. Michaels, DrPH
Death Data Source: U.S. Centers for Disease Control and Prevention
This executive summary was generated by an AI summarizer agent and reviewed by an editor agent. I review any summaries flagged for revision.↩︎