Published: October 4, 2023
Updated: August 02, 2026 at 05:00PM
Welcome
The Department of Homeless Services (DHS) Daily Report provides a near real-time census of people and families living in New York City’s shelter system. This page presents a concise, transparent analysis of those daily counts from August 08, 2013 through the present. It emphasizes long-term trends, recent changes, and weekly patterns that are relevant to program planning and public health practice.
Data Overview
The data are a daily administrative census compiled by the New York City Department of Homeless Services and include counts of single adults, adults and children in families, and household-level counts such as families with children and adult-only families. The dataset begins on August 08, 2013 and is updated daily; it contains one observation per calendar date and numeric measures that capture the size and composition of the shelter population. Because the data are an administrative snapshot taken each day, they are well suited to describing the size of the shelter population over time and identifying temporal patterns but do not by themselves explain the causes of changes.
How to Use These Data
Users can employ these data to track the magnitude of shelter population changes, examine seasonal and weekday patterns, and compare recent behavior against long-term trends. The data are useful for operational planning (bed capacity and staffing) and for monitoring the short-term impact of policy or program changes that affect inflow or outflow from the shelter system. Analysts should be mindful that the data reflect counts at the time of census and may be influenced by reporting or administrative changes; therefore, any attribution of cause requires additional information.
Why Are These Data Important?
Counting people in shelter on a daily basis provides an operationally actionable metric for municipal agencies and service providers. The data offer a continuous view of system demand and can highlight emerging pressures on shelter capacity that may affect service delivery and public health interventions. Regular monitoring helps situate short-term fluctuations within broader trends and informs decisions about resource allocation, surge planning, and cross-agency coordination to protect the health and safety of people experiencing homelessness.
What These Data Show
The exhibits below begin with a high-level description of the distribution of daily counts and then move to focused views: the largest single-day census values, recent day-to-day counts, the relationship between adults and children in shelter, and weekly patterns that can guide operational planning. Each figure and table is accompanied by an interpretive paragraph that explains the analytic takeaway and connects that result to the next output for continuity.
What These Data Do Not Show
These counts do not include population-level outcomes outside the shelter census such as unsheltered homelessness, exits to permanent housing, or individual-level characteristics beyond basic age composition. The dataset does not capture reasons for admission or exit, nor does it provide demographic detail needed to assess differential impacts across subgroups. Causal explanations for trends are beyond the scope of these data and would require linkage to programmatic or policy event records.
Implications for Public Health Practice
Regular, transparent reporting of shelter counts supports timely responses to changes in population needs and can inform public health preparedness for seasonal or event-driven pressures. Practitioners and decision-makers should combine these time series with information about shelter capacity, intake procedures, and housing placement activity to produce actionable plans. Monitoring both short-term fluctuations and longer-term trends helps balance immediate operational demands with strategic investments to reduce system reliance.
Analyses
Summary Table — Key Metrics
The table below summarizes central tendency and range for core shelter counts across the full observation period. It shows the typical levels at which the shelter system operates, while also documenting the lowest and highest observed values. These measures provide a concise reference point for understanding both the normal operating range and the scale of variation experienced over time.
| New York City Shelters Census — Key Summary Statistics | |
| Descriptive statistics for daily DHS shelter census, August 21, 2013 through August 01, 2026 | |
| Metric | Value |
|---|---|
| Observations | 4,666 |
| Mean Total Individuals | 63,873 |
| Standard Deviation Total Individuals | 13,622 |
| Median Total Individuals | 59,010 |
| Min Total Individuals | 44,586 |
| Max Total Individuals | 89,558 |
| Mean Total Adults | 40,281 |
| Mean Total Children | 23,592 |
Table Prepared By: Isaac H. Michaels, DrPH
Data Source: New York City Department of Homeless Services
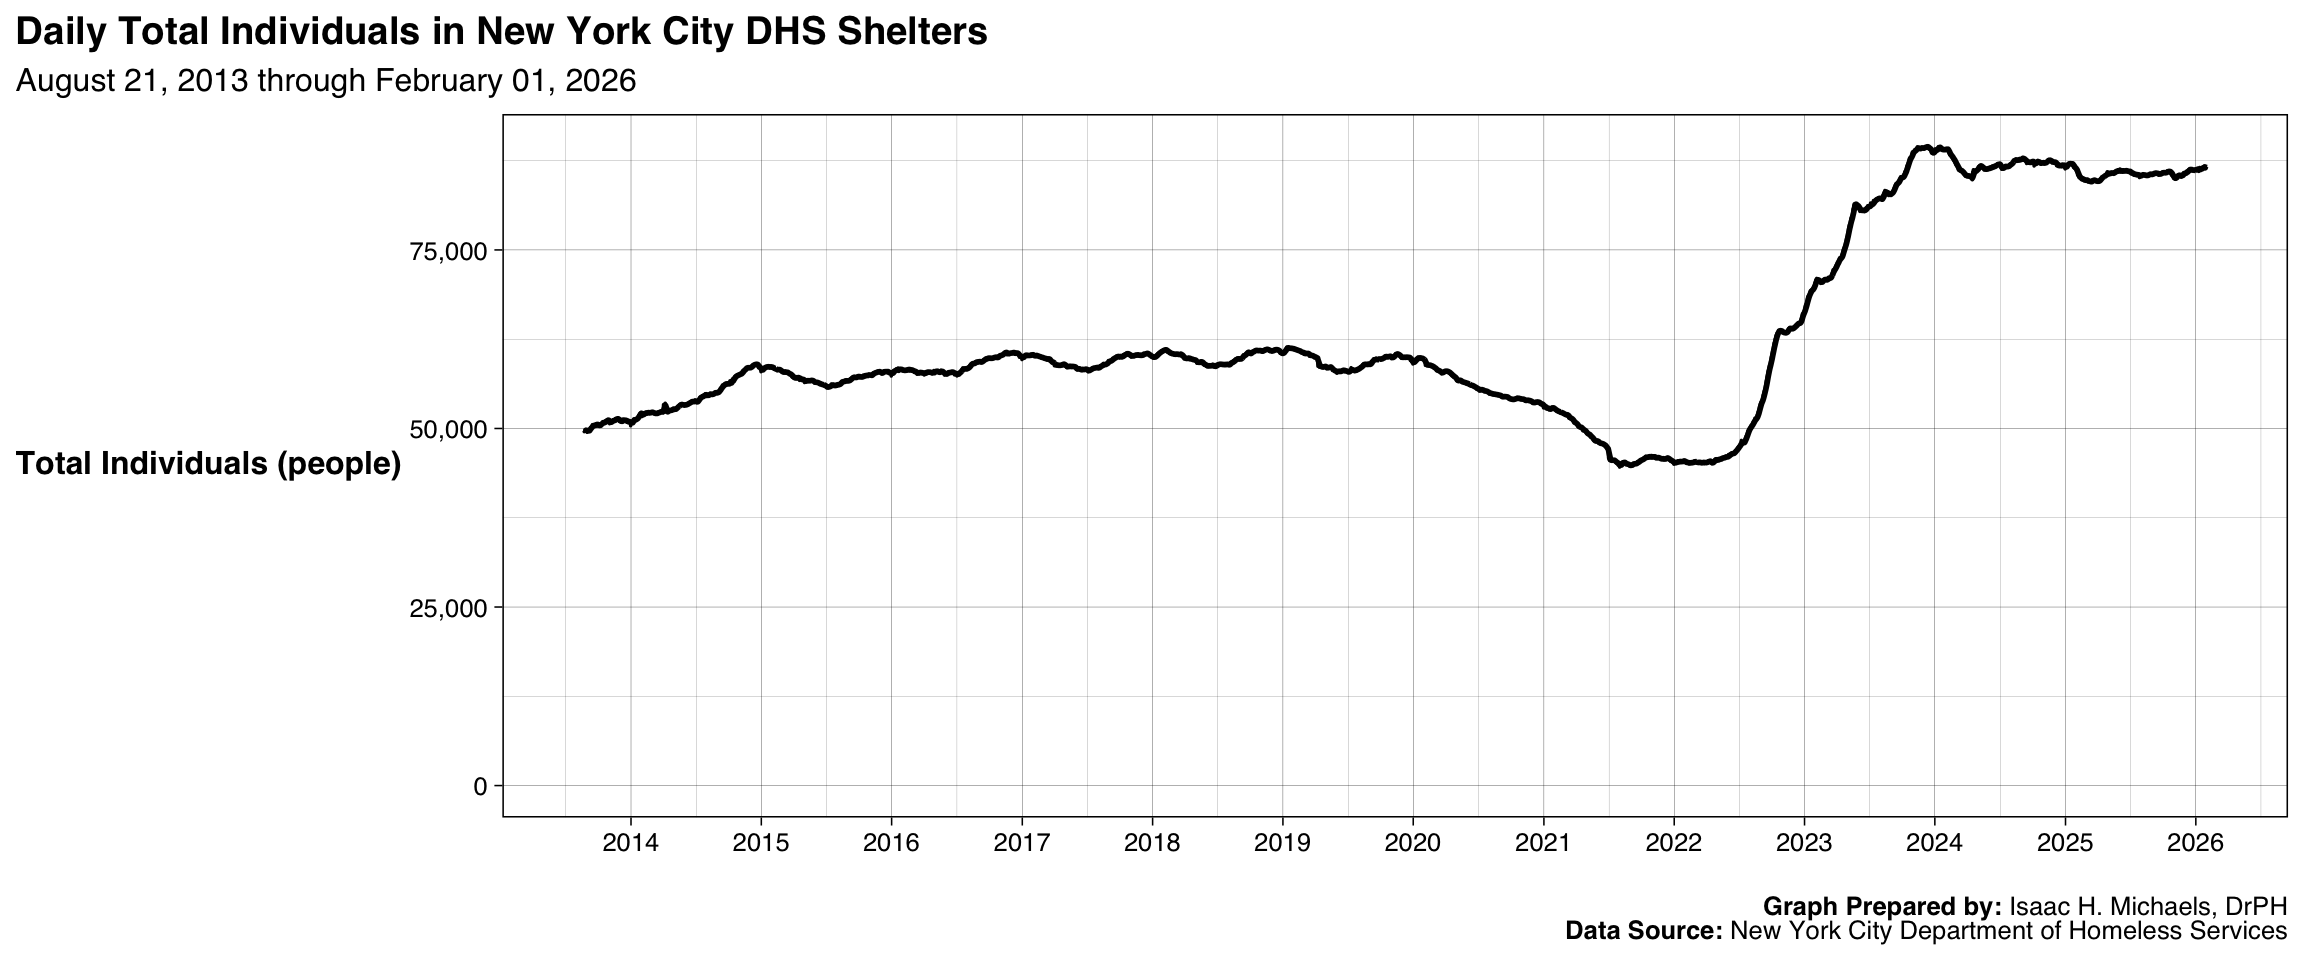
Time Series — Total Individuals in Shelter
This time series plots the daily census of individuals alongside a seven-day rolling average, offering both granular and smoothed perspectives. The visualization makes it possible to distinguish short-term fluctuations from longer structural shifts in the shelter population. By showing the full span of available data, the figure highlights how recent conditions align with, or diverge from, longer-term trends.
Graph Prepared by: Isaac H. Michaels, DrPH
Data Source: New York City Department of Homeless Services
Top Daily Peaks
The table of peak daily values identifies the dates with the largest reported shelter populations. These records capture moments of maximum strain on the system and can help pinpoint when operational capacity may have been most challenged. They also illustrate the extent to which population surges exceed typical levels, underscoring the importance of planning for extreme scenarios.
| Top 10 Highest Daily Shelter Census Counts | |
| Dates with the largest numbers of individuals in shelter | |
| Date | Total Individuals in Shelter |
|---|---|
| December 10, 2023 | 89,558 |
| December 12, 2023 | 89,508 |
| January 11, 2024 | 89,468 |
| December 11, 2023 | 89,460 |
| January 14, 2024 | 89,448 |
| November 13, 2023 | 89,441 |
| December 4, 2023 | 89,441 |
| December 6, 2023 | 89,437 |
| December 3, 2023 | 89,431 |
| December 9, 2023 | 89,421 |
| Data from August 21, 2013 through August 01, 2026 | |
Table Prepared By: Isaac H. Michaels, DrPH
Data Source: New York City Department of Homeless Services
Recent 30 Days — Day-to-Day Counts
This table provides the most recent month of daily census data to support immediate operational awareness. Displaying counts in this way allows for quick assessment of short-term pressures that may not be visible in long-term summaries. It also enables administrators and planners to track whether current numbers are stable, rising, or falling in ways that may affect near-term decisions.
| Past 30 Days — New York City Daily DHS Shelter Census | |||
| Most recent thirty days of daily counts | |||
| Date | Total Individuals in Shelter | Total Adults in Shelter | Total Children in Shelter |
|---|---|---|---|
| August 1, 2026 | 82,912 | 54,773 | 28,139 |
| July 31, 2026 | 82,819 | 54,729 | 28,090 |
| July 30, 2026 | 82,929 | 54,836 | 28,093 |
| July 29, 2026 | 82,703 | 54,713 | 27,990 |
| July 28, 2026 | 82,513 | 54,559 | 27,954 |
| July 27, 2026 | 82,561 | 54,609 | 27,952 |
| July 26, 2026 | 82,513 | 54,564 | 27,949 |
| July 25, 2026 | 82,632 | 54,567 | 28,065 |
| July 24, 2026 | 82,548 | 54,546 | 28,002 |
| July 23, 2026 | 82,606 | 54,601 | 28,005 |
| July 22, 2026 | 82,696 | 54,636 | 28,060 |
| July 21, 2026 | 82,905 | 54,746 | 28,159 |
| July 20, 2026 | 82,824 | 54,641 | 28,183 |
| July 19, 2026 | 82,857 | 54,692 | 28,165 |
| July 18, 2026 | 82,930 | 54,692 | 28,238 |
| July 17, 2026 | 82,855 | 54,620 | 28,235 |
| July 16, 2026 | 82,840 | 54,647 | 28,193 |
| July 15, 2026 | 82,818 | 54,618 | 28,200 |
| July 14, 2026 | 82,849 | 54,646 | 28,203 |
| July 13, 2026 | 83,070 | 54,781 | 28,289 |
| July 12, 2026 | 83,047 | 54,758 | 28,289 |
| July 11, 2026 | 83,136 | 54,773 | 28,363 |
| July 10, 2026 | 83,057 | 54,718 | 28,339 |
| July 9, 2026 | 82,940 | 54,706 | 28,234 |
| July 8, 2026 | 82,729 | 54,538 | 28,191 |
| July 7, 2026 | 82,890 | 54,607 | 28,283 |
| July 6, 2026 | 82,992 | 54,668 | 28,324 |
| July 5, 2026 | 83,043 | 54,620 | 28,423 |
| July 4, 2026 | 83,068 | 54,638 | 28,430 |
| July 3, 2026 | 83,037 | 54,662 | 28,375 |
Table Prepared By: Isaac H. Michaels, DrPH
Data Source: New York City Department of Homeless Services
Adults vs Children — Comparative Trend
The comparative line plot separates shelter populations into adults and children, showing how the balance between these groups has shifted over time. This perspective is valuable for assessing whether changes in overall totals reflect parallel increases across groups or are concentrated in one population. Understanding the composition of the shelter system is critical for aligning services, since adults and children often have distinct needs and require different forms of support.
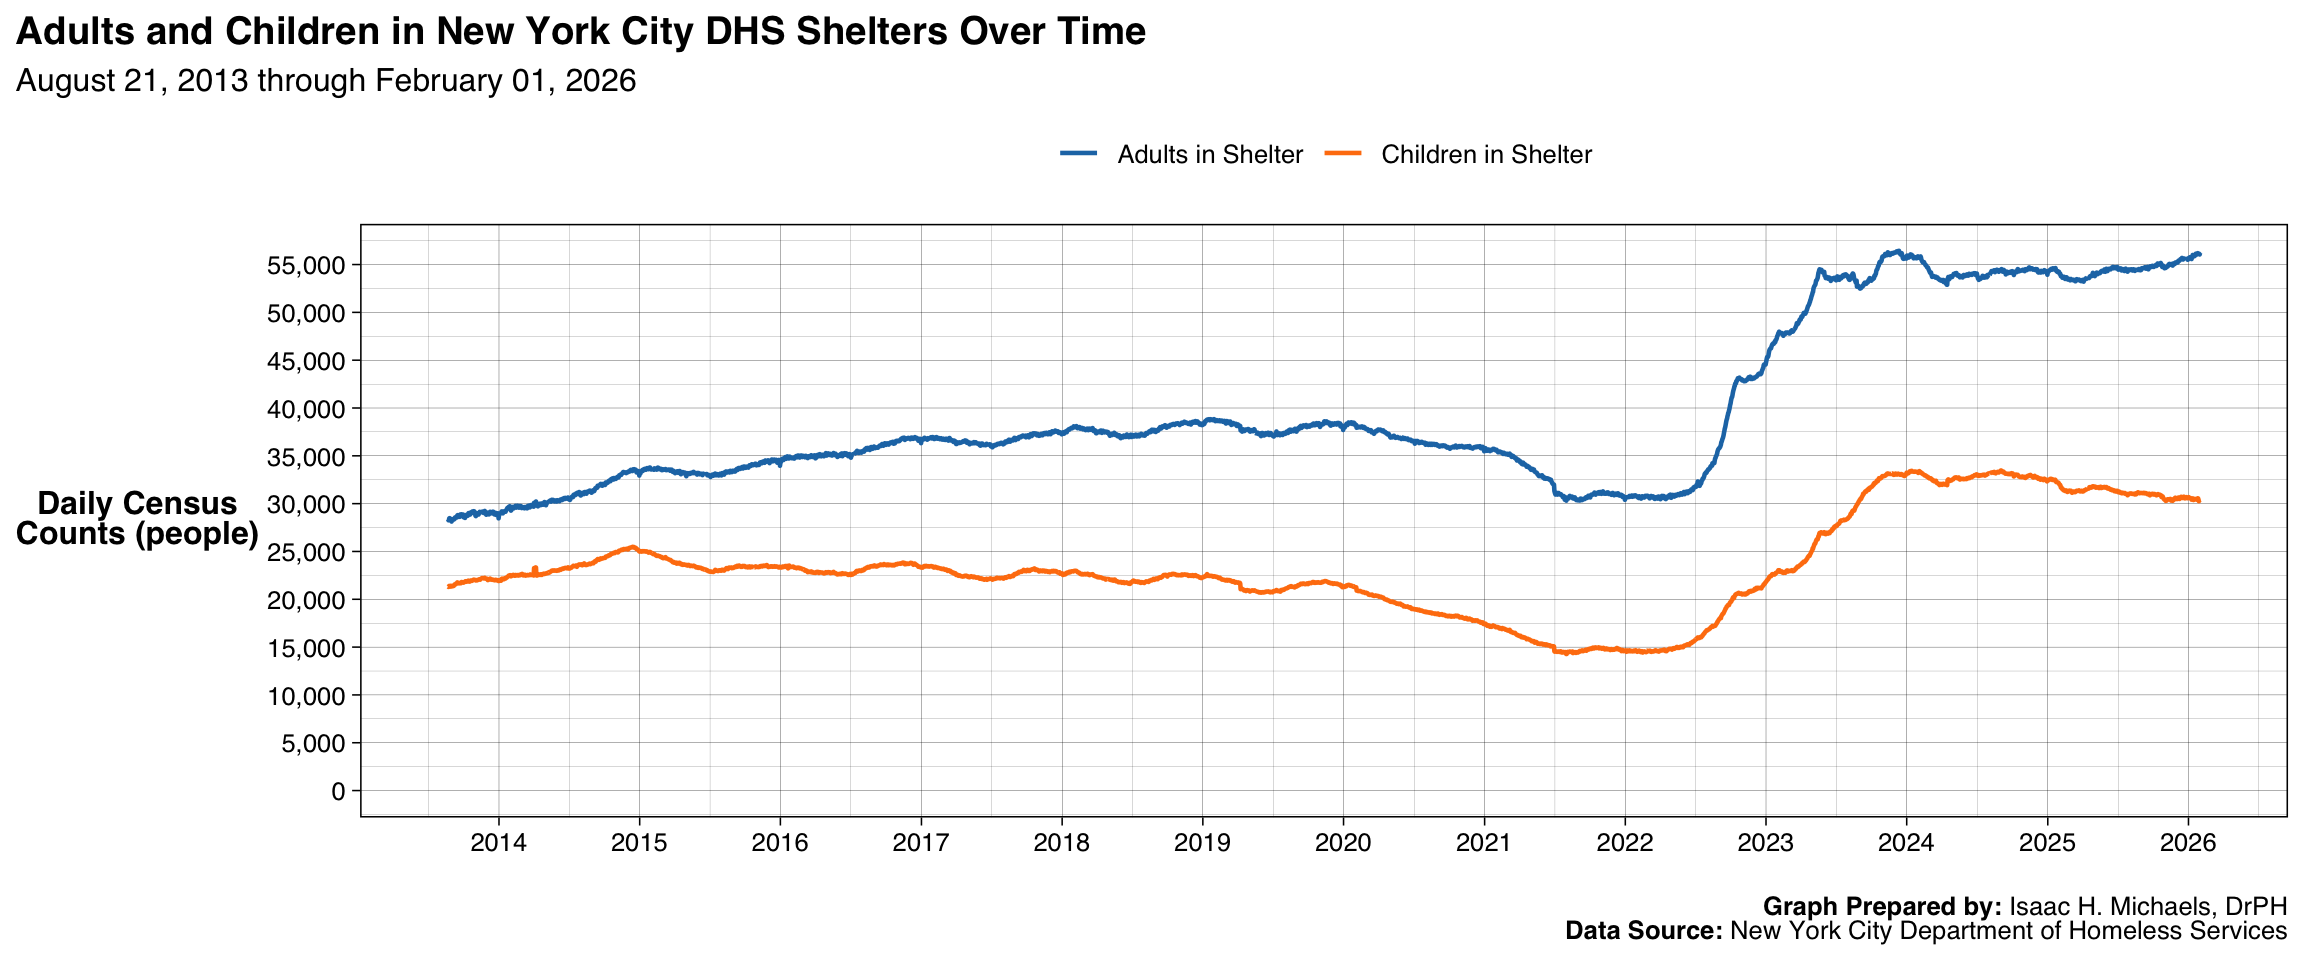
Graph Prepared by: Isaac H. Michaels, DrPH
Data Source: New York City Department of Homeless Services
Weekly Pattern — Weekday Distributions
The weekday dot plots display how shelter counts vary across the seven days of the week, highlighting both central tendency and variability. Patterns of higher or lower counts on specific weekdays can inform staffing and scheduling choices. By presenting distributions across the entire time series, the figure also reveals whether weekday differences are consistent or highly variable over time.
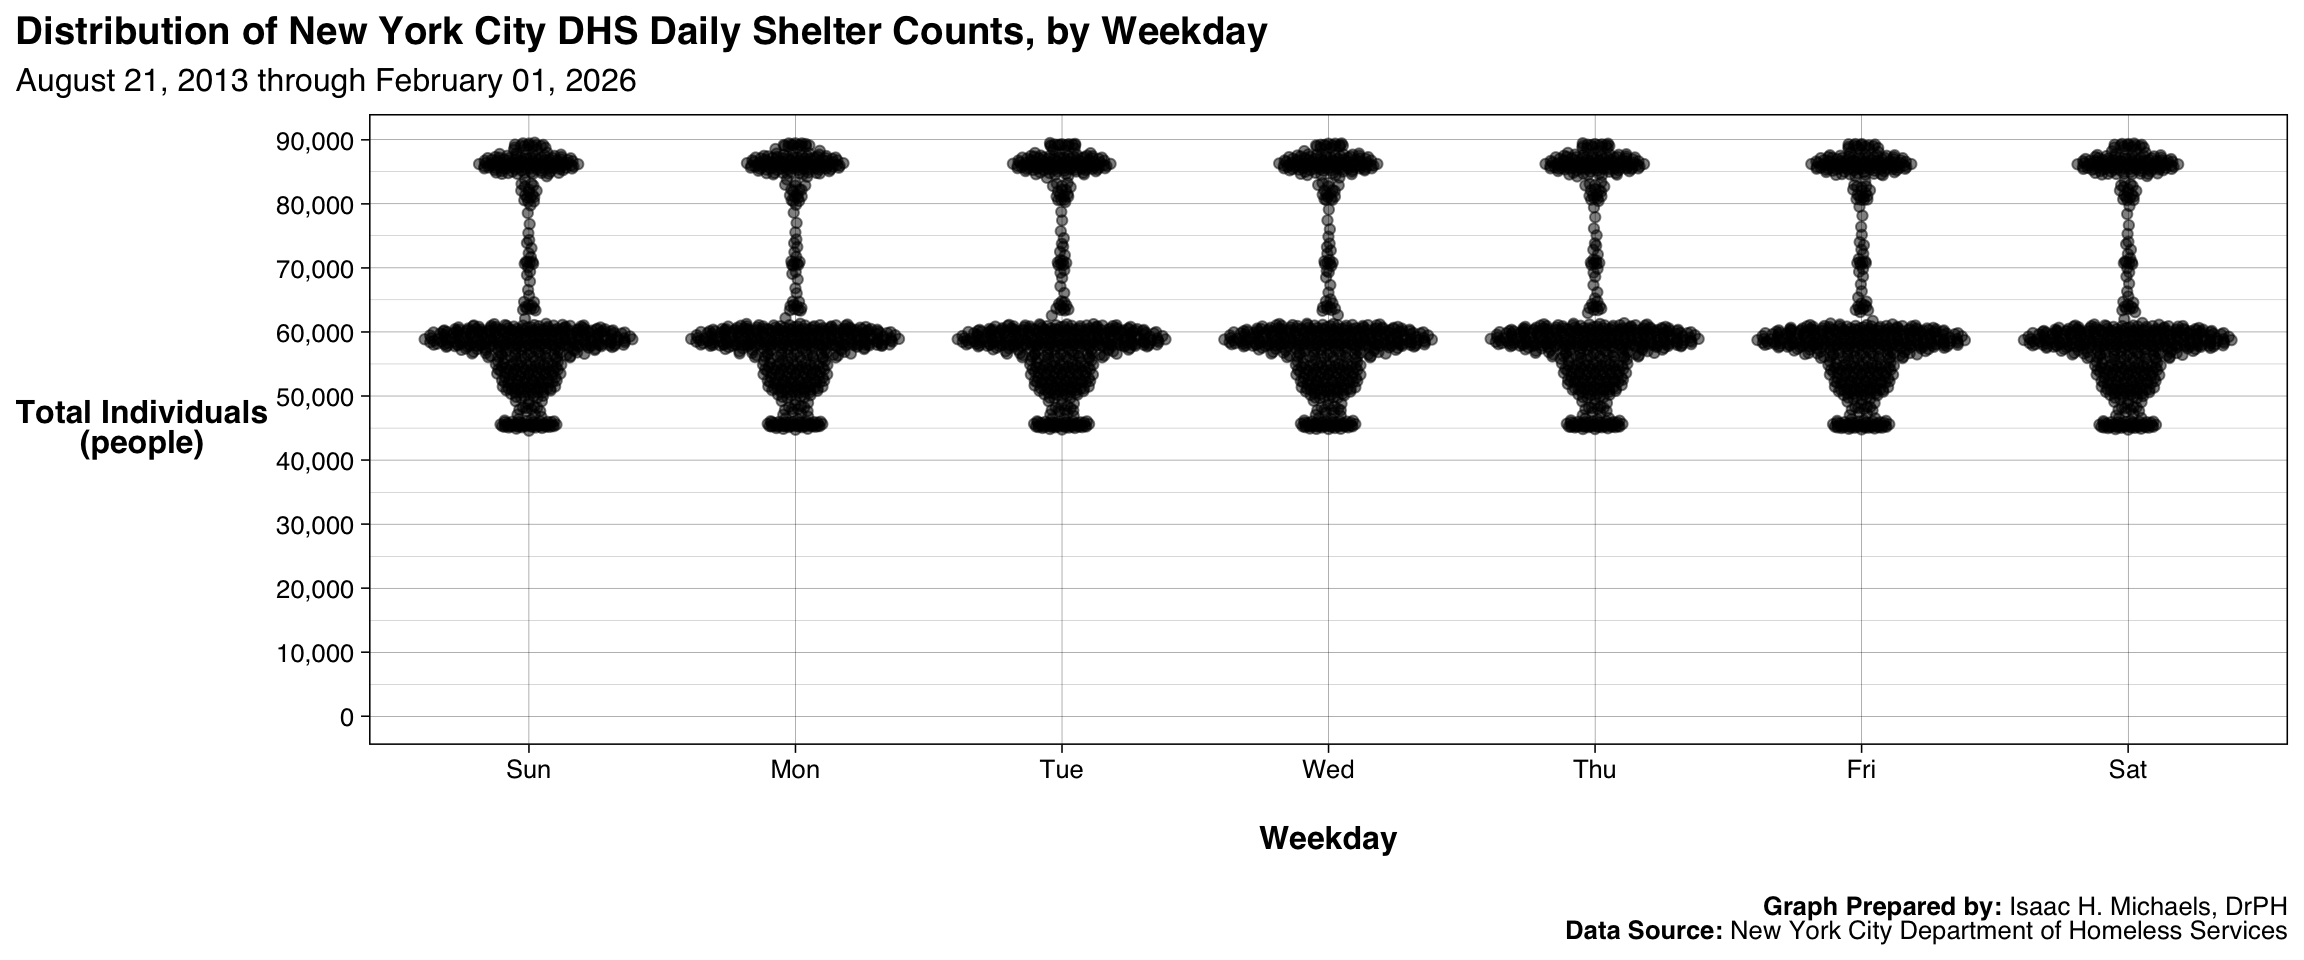
Graph Prepared by: Isaac H. Michaels, DrPH
Data Source: New York City Department of Homeless Services