Published: August 3, 2020
Updated: September 19, 2025 at 12:45AM
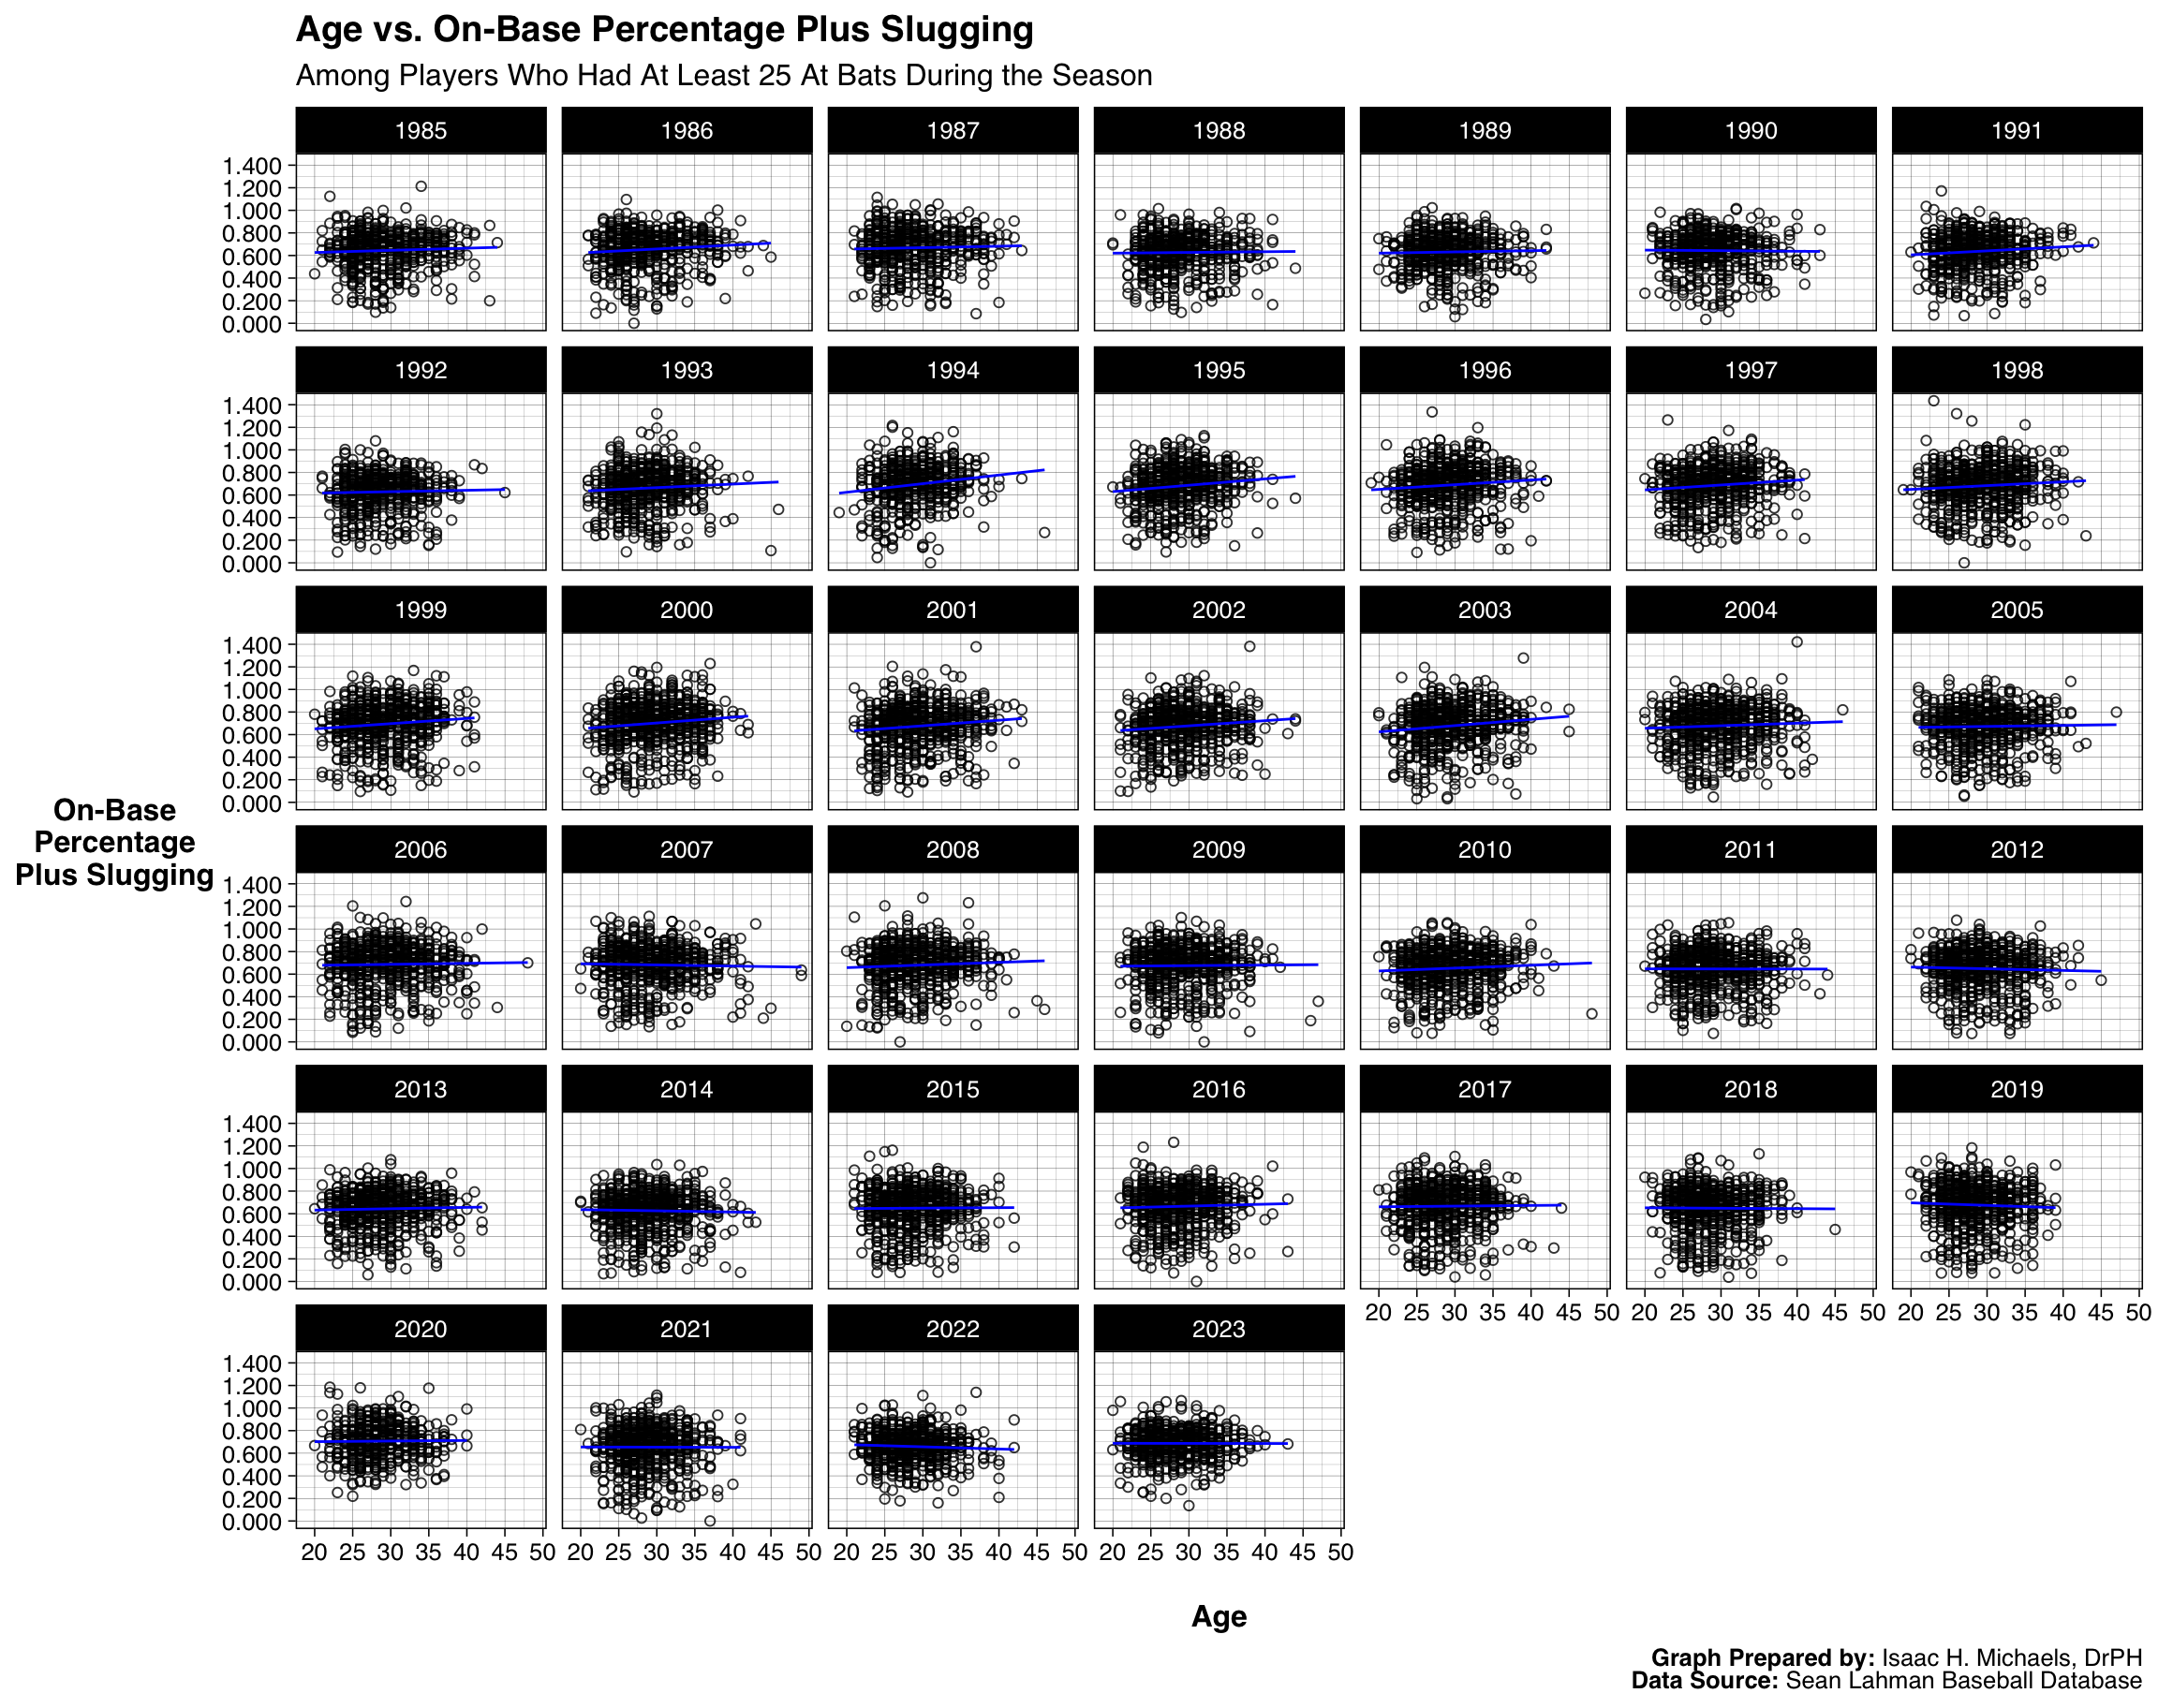
On-Base Plus Slugging Percentage
 Graph Prepared By:
 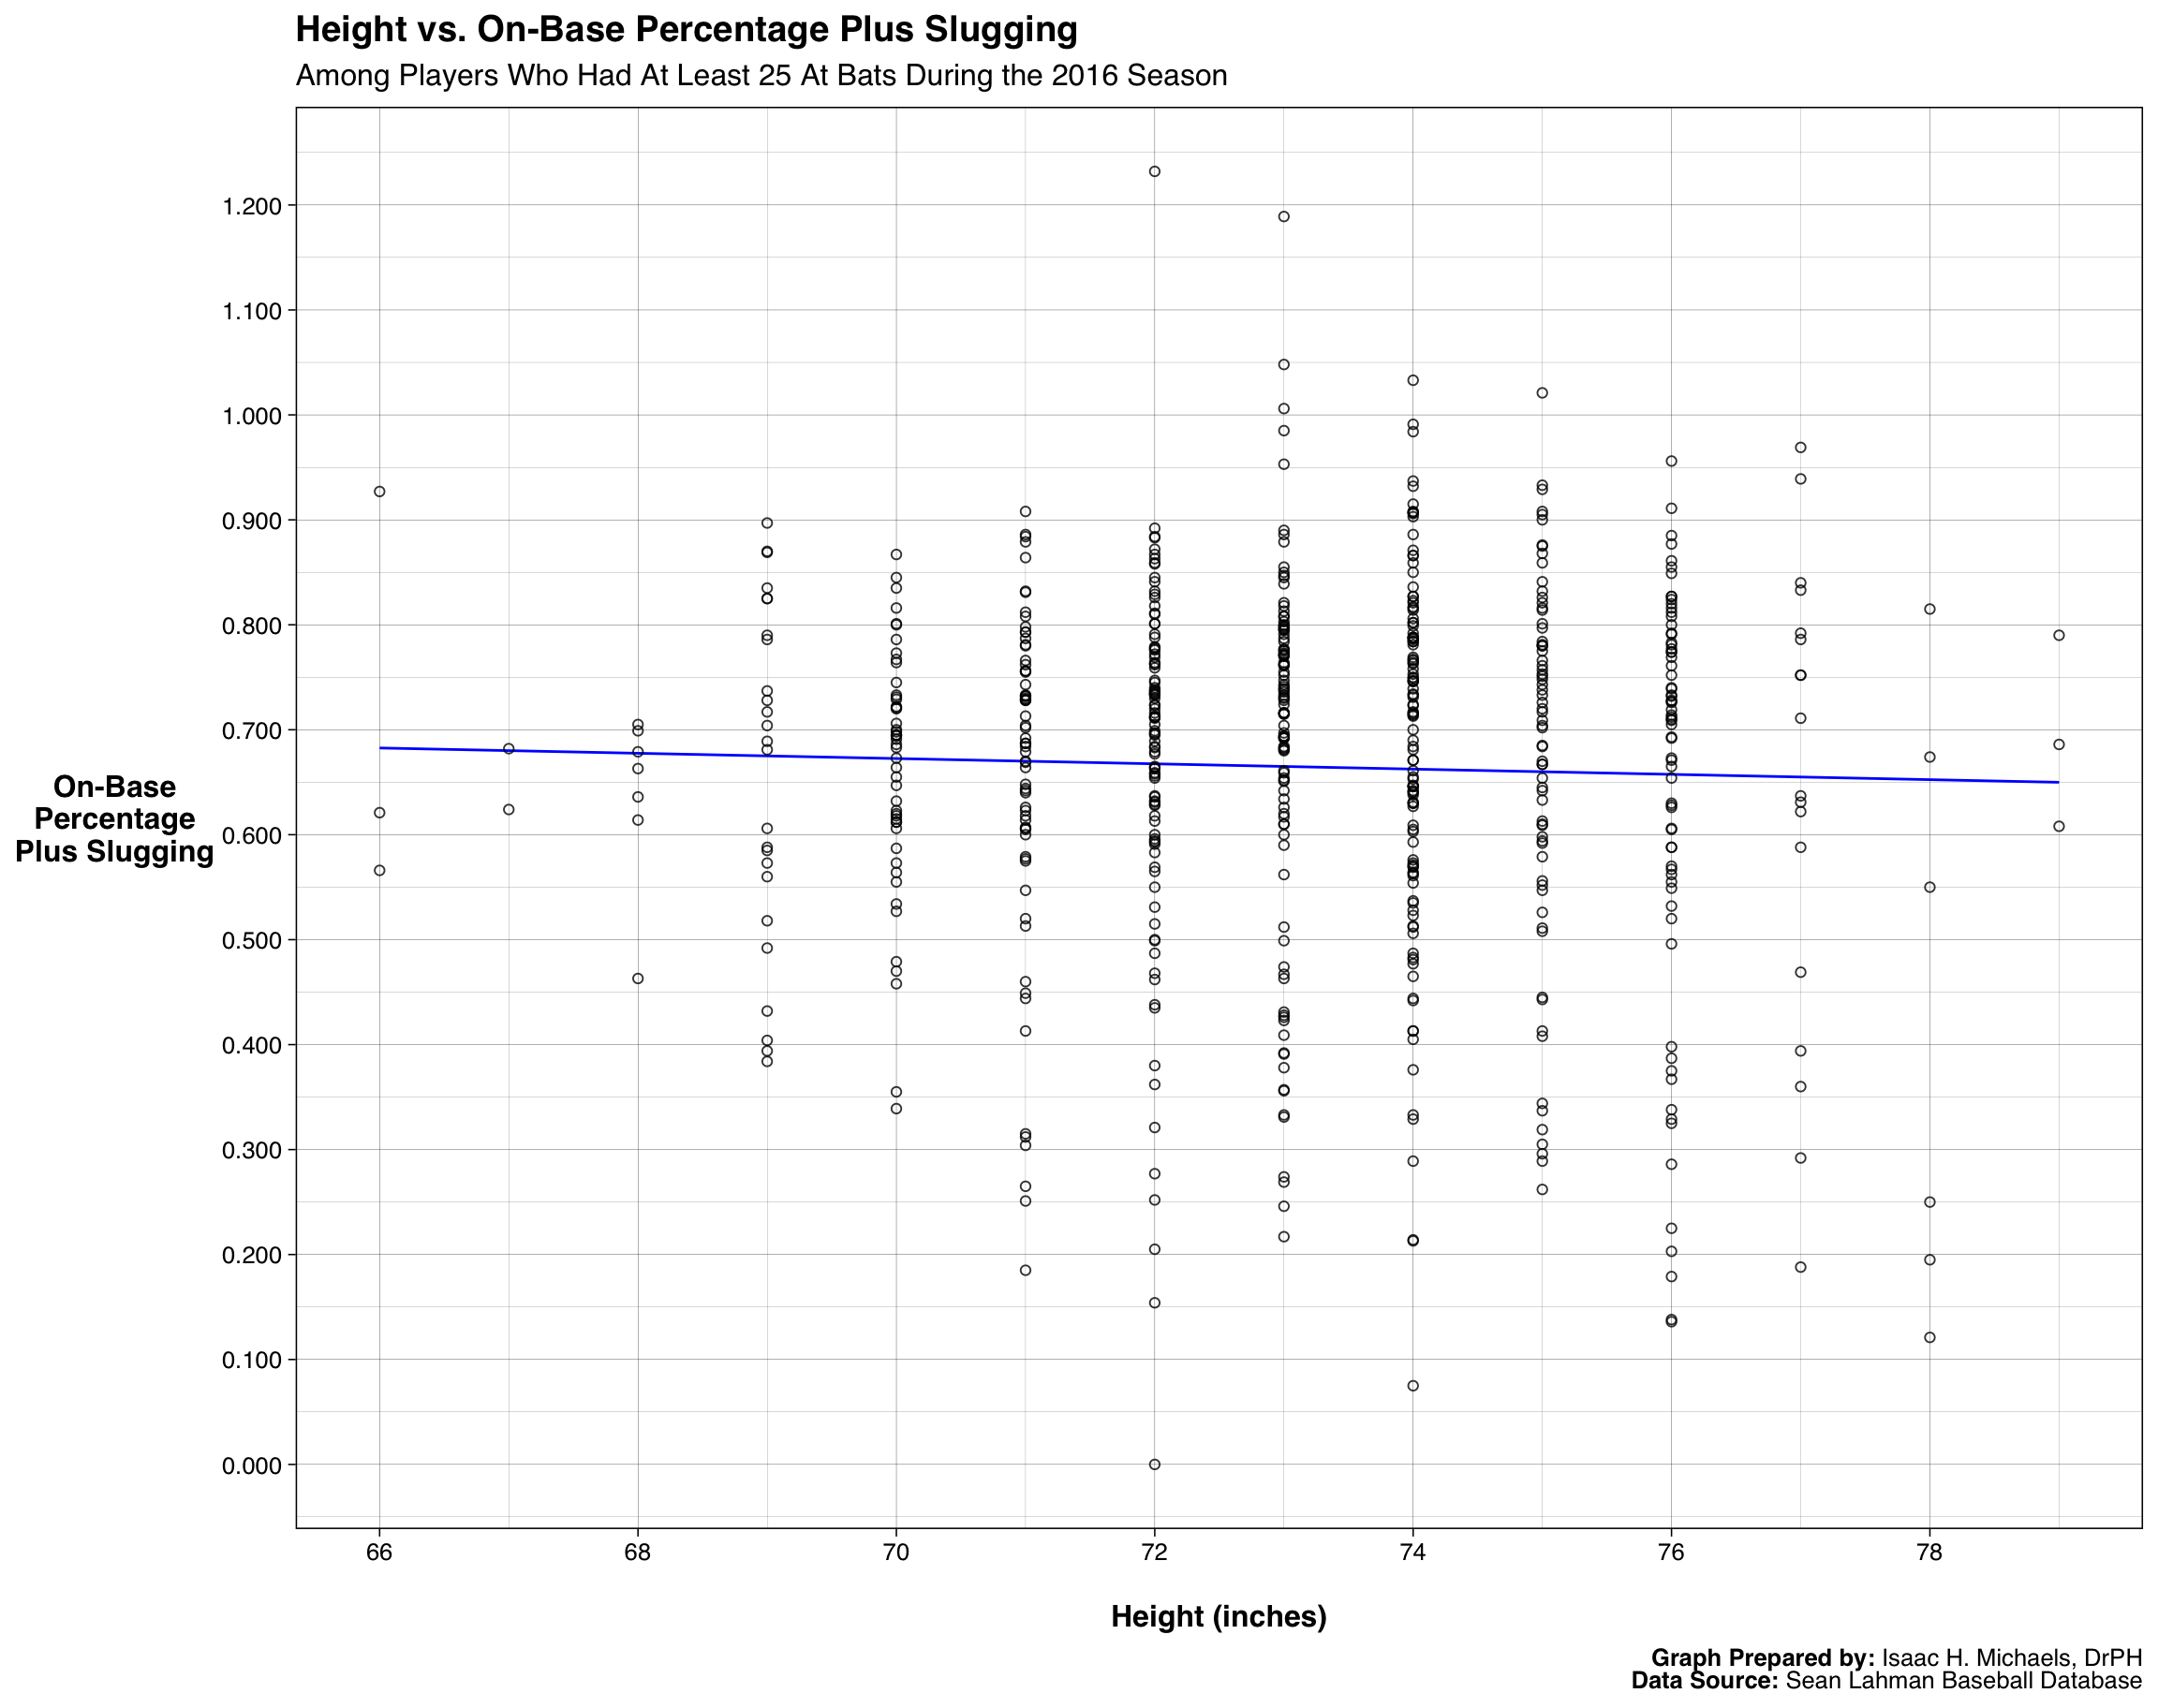 Graph Prepared By:
 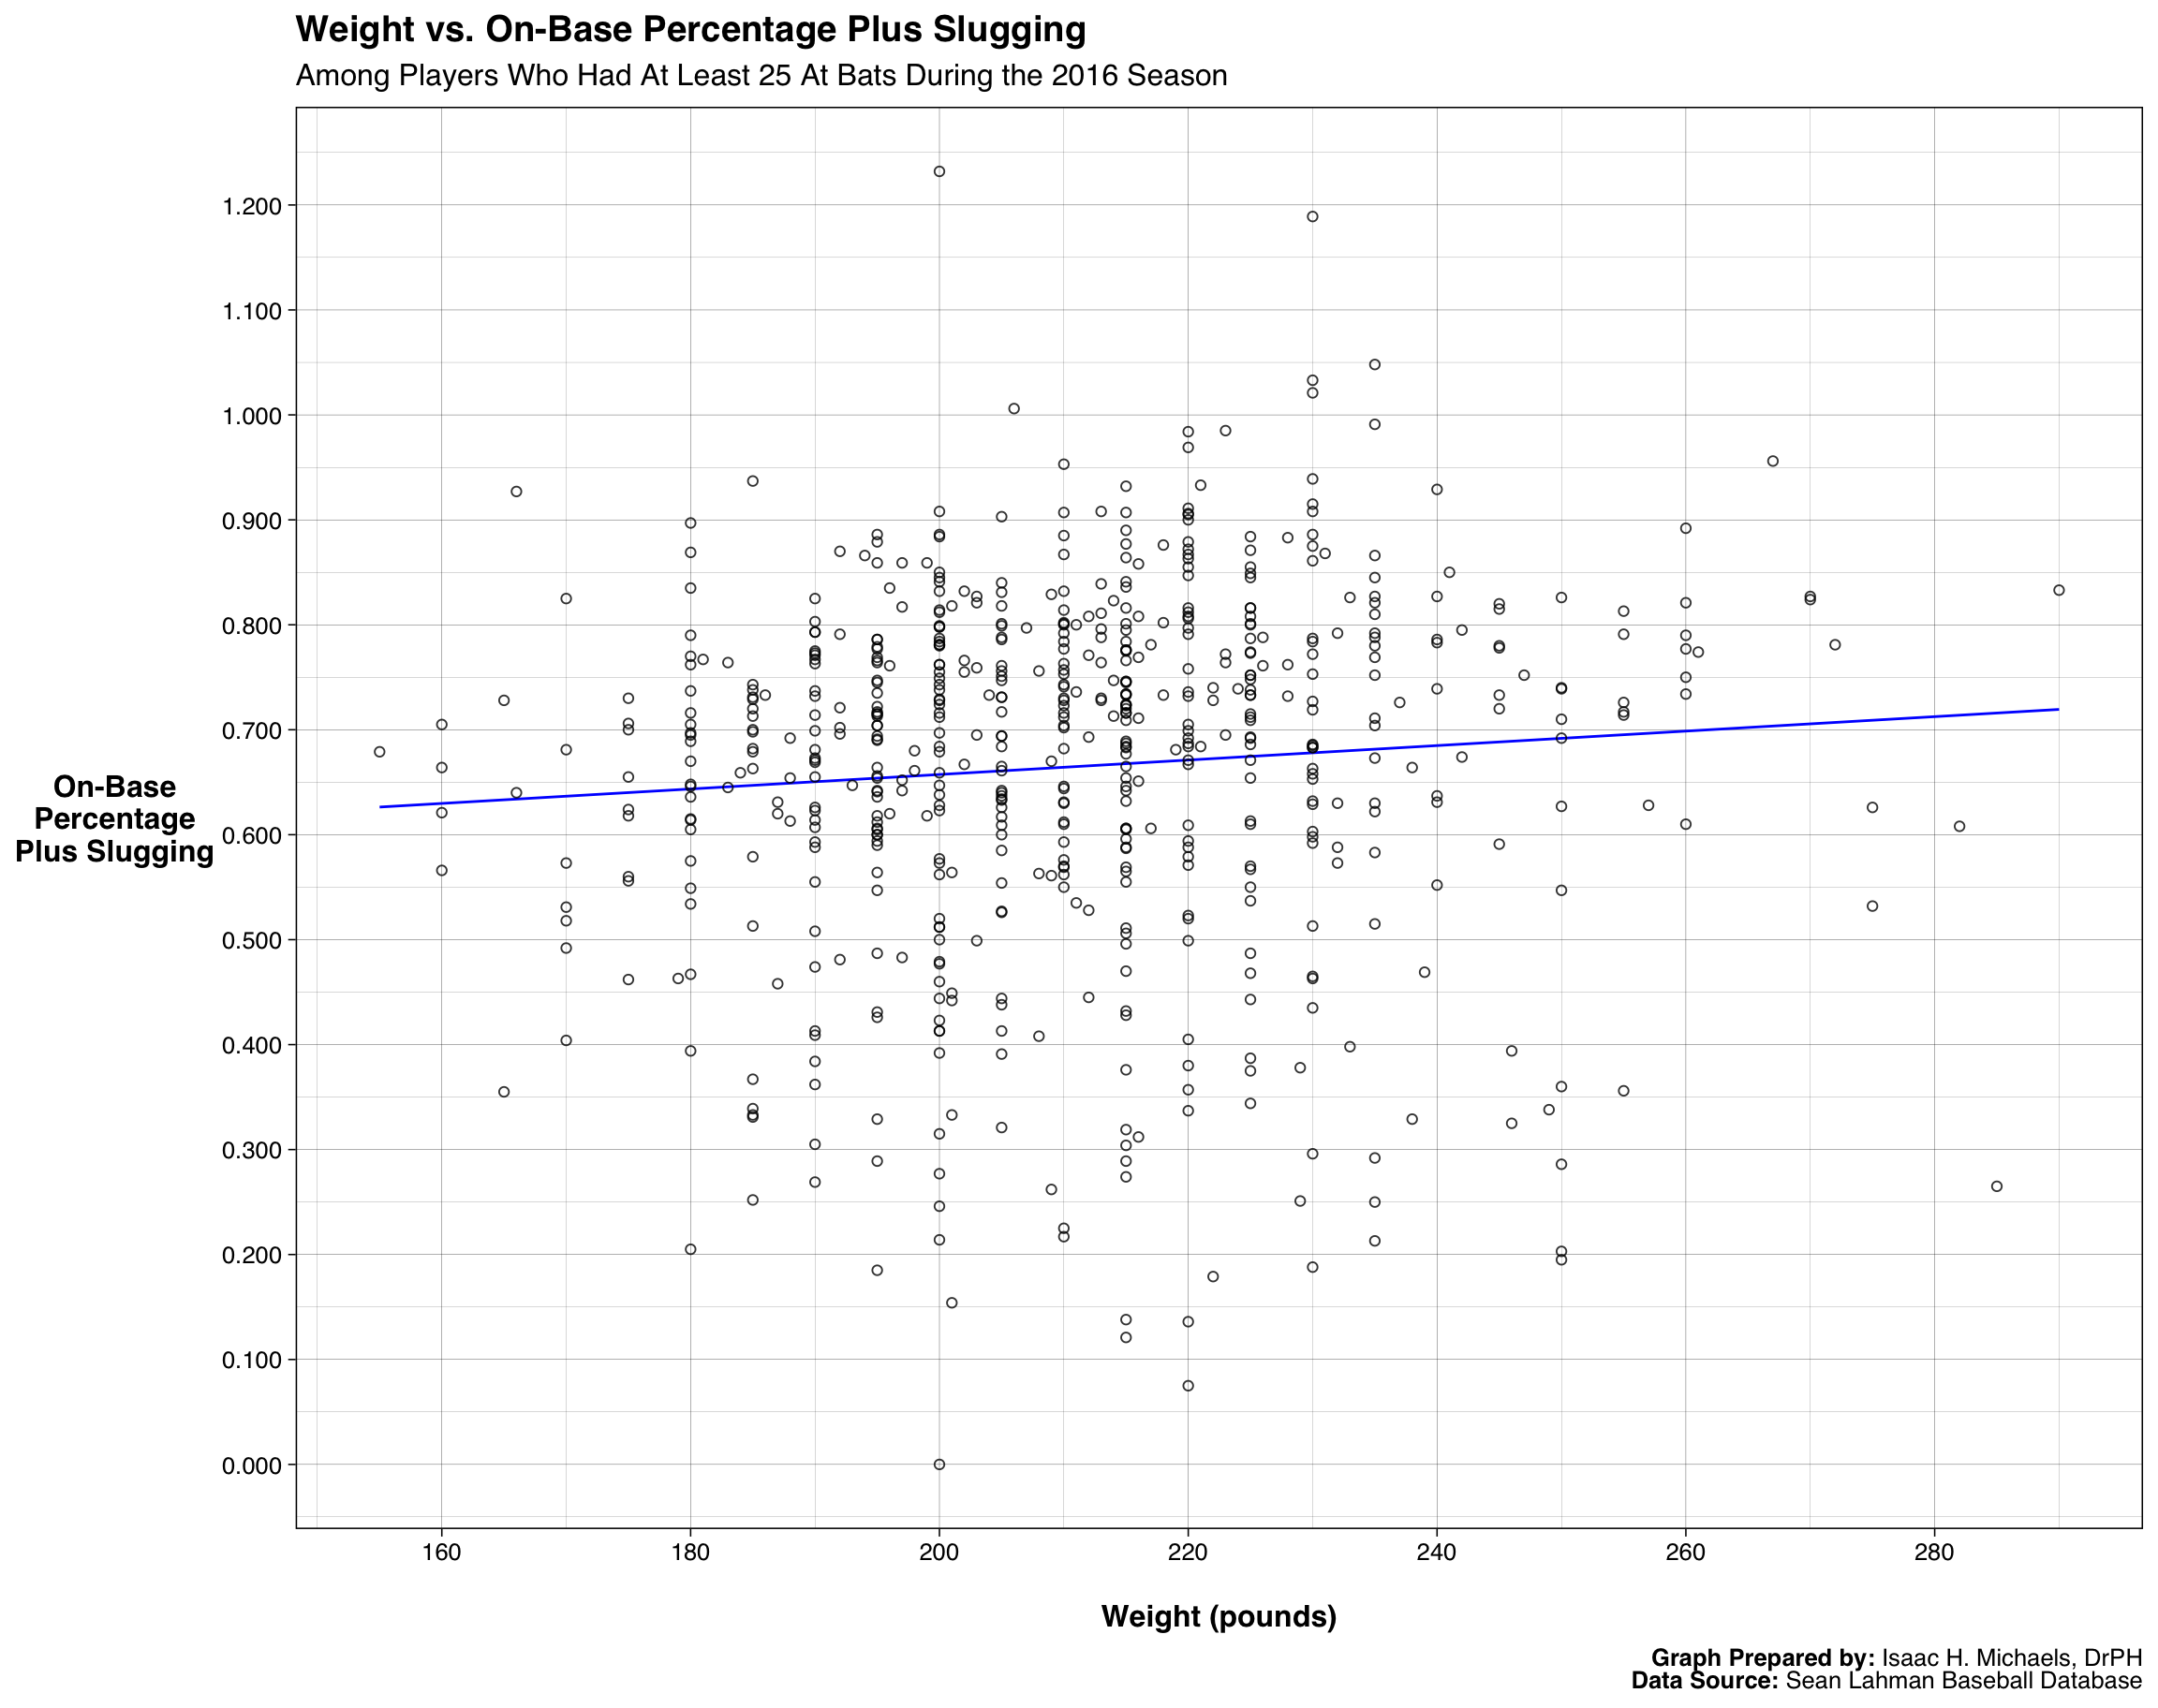 Graph Prepared By:
 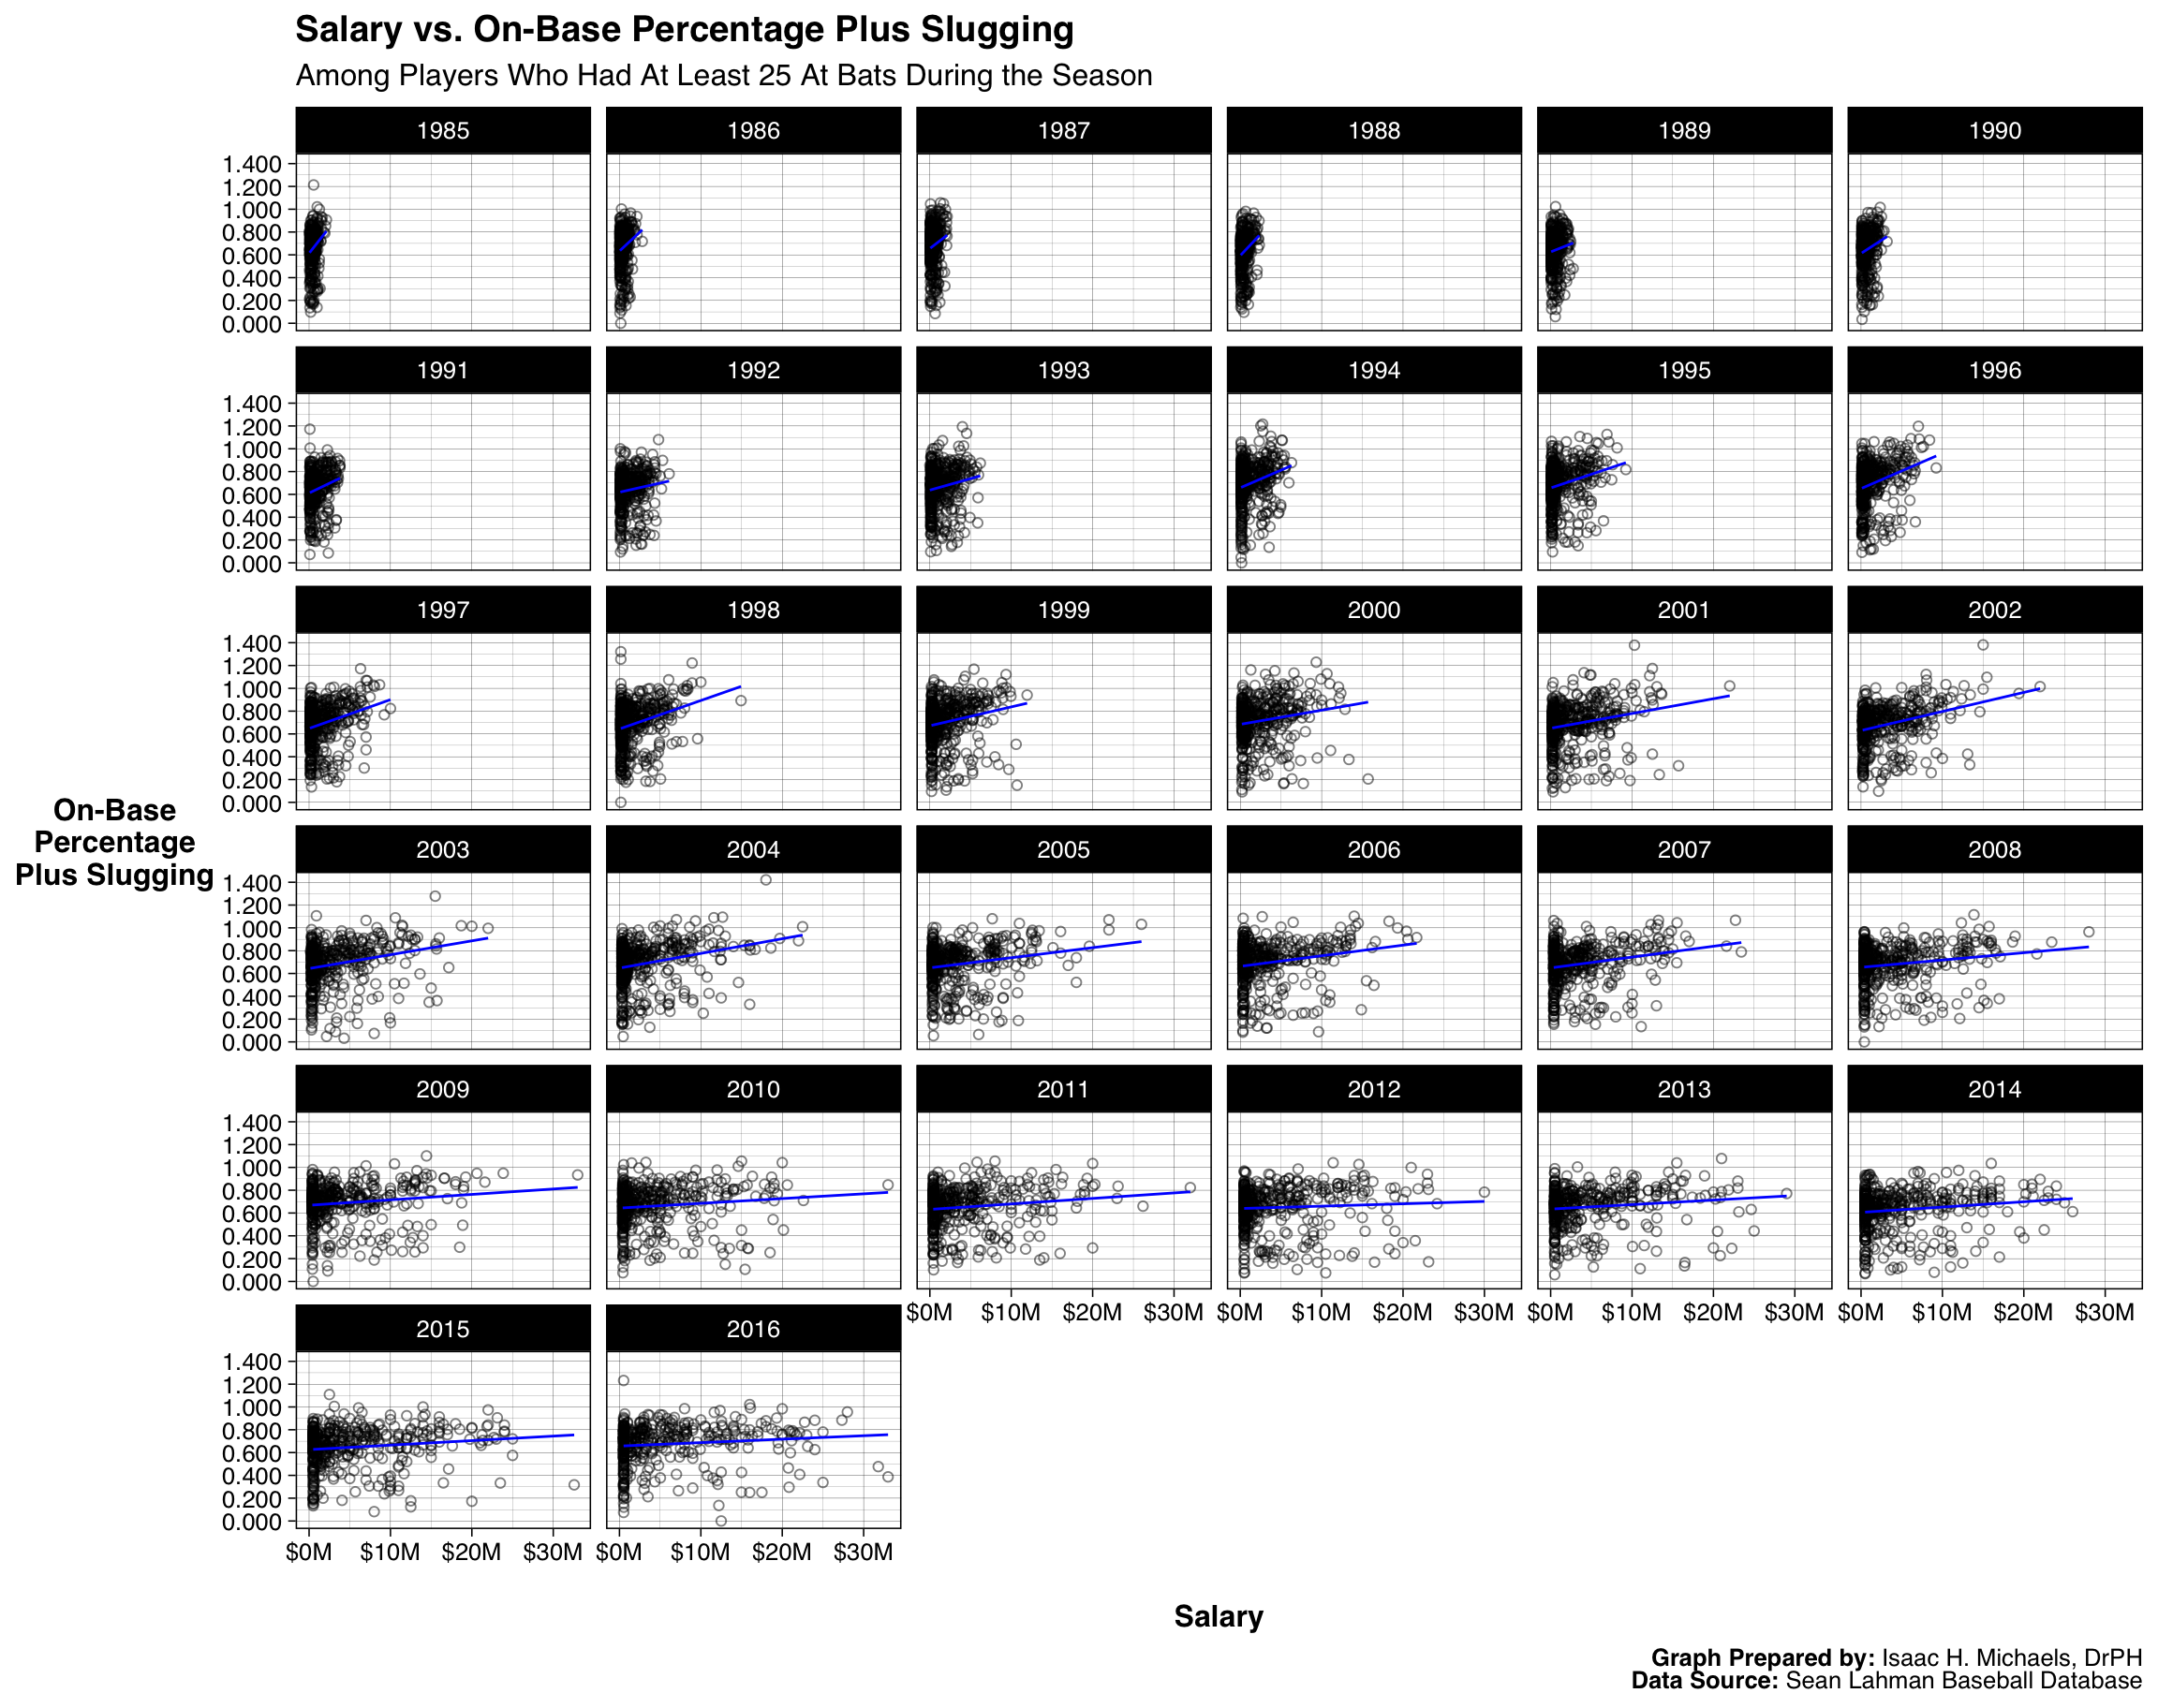 Graph Prepared By:
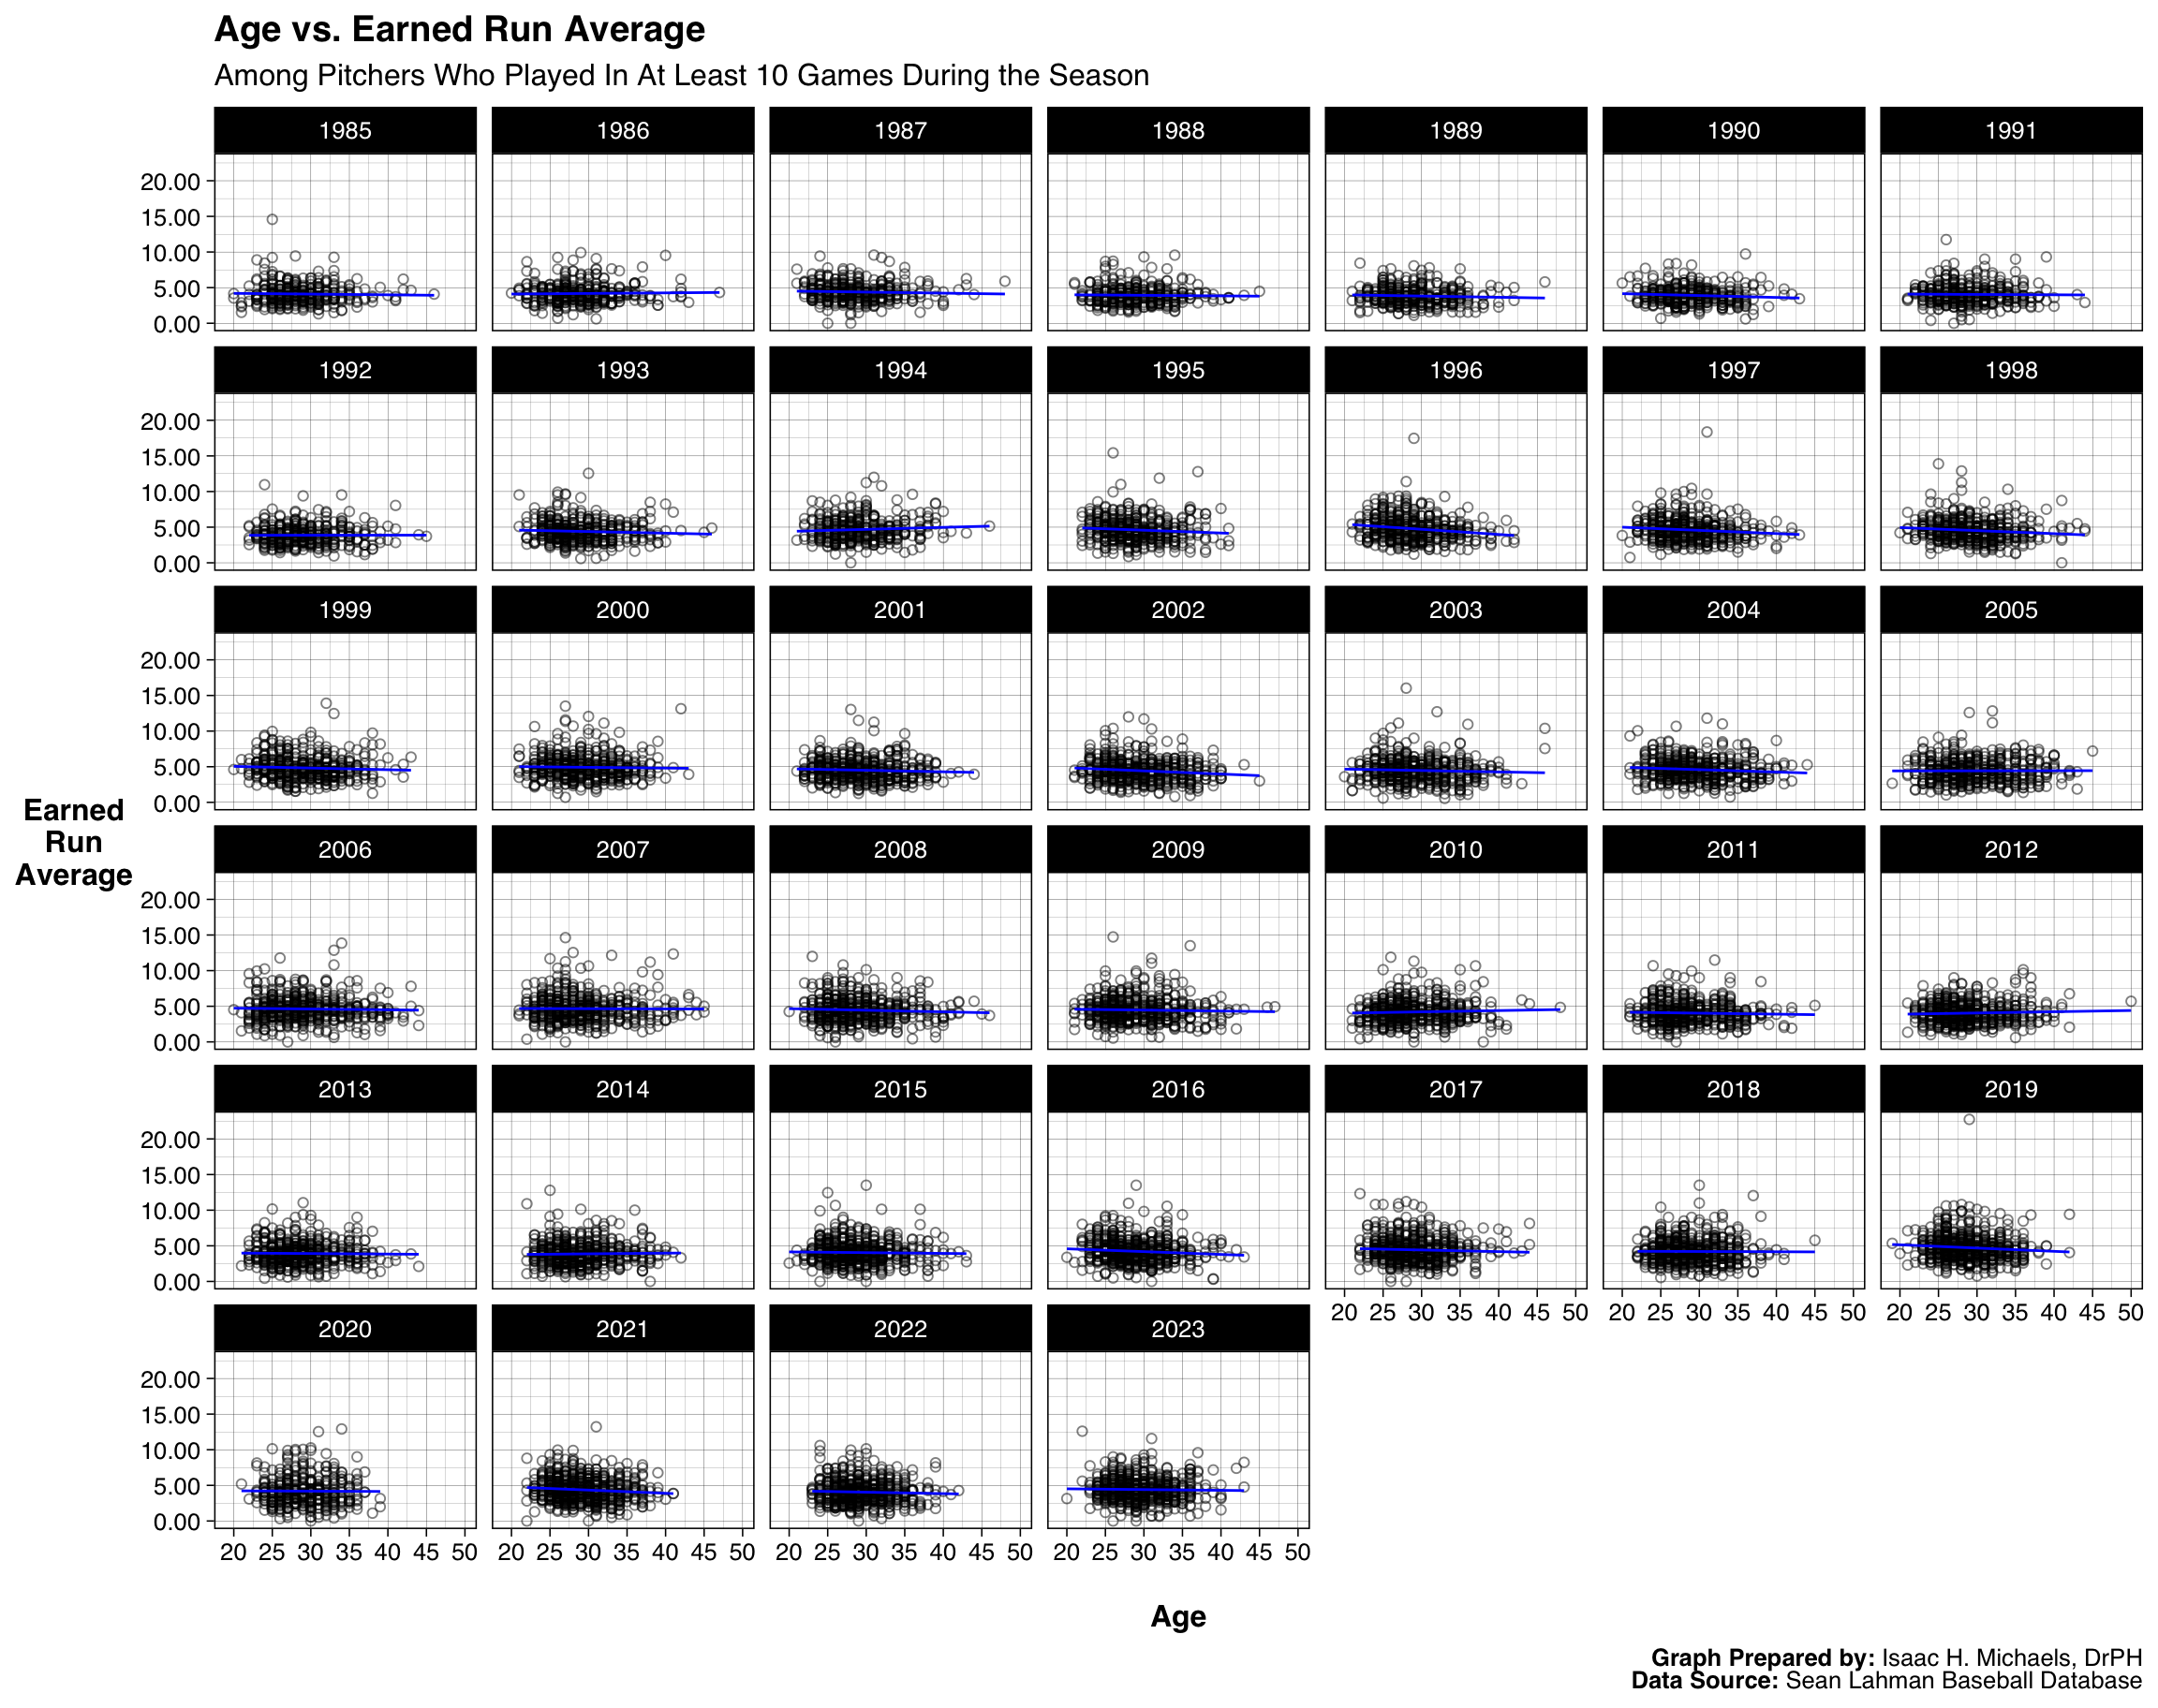
 Earned Run Average
 Graph Prepared By:
 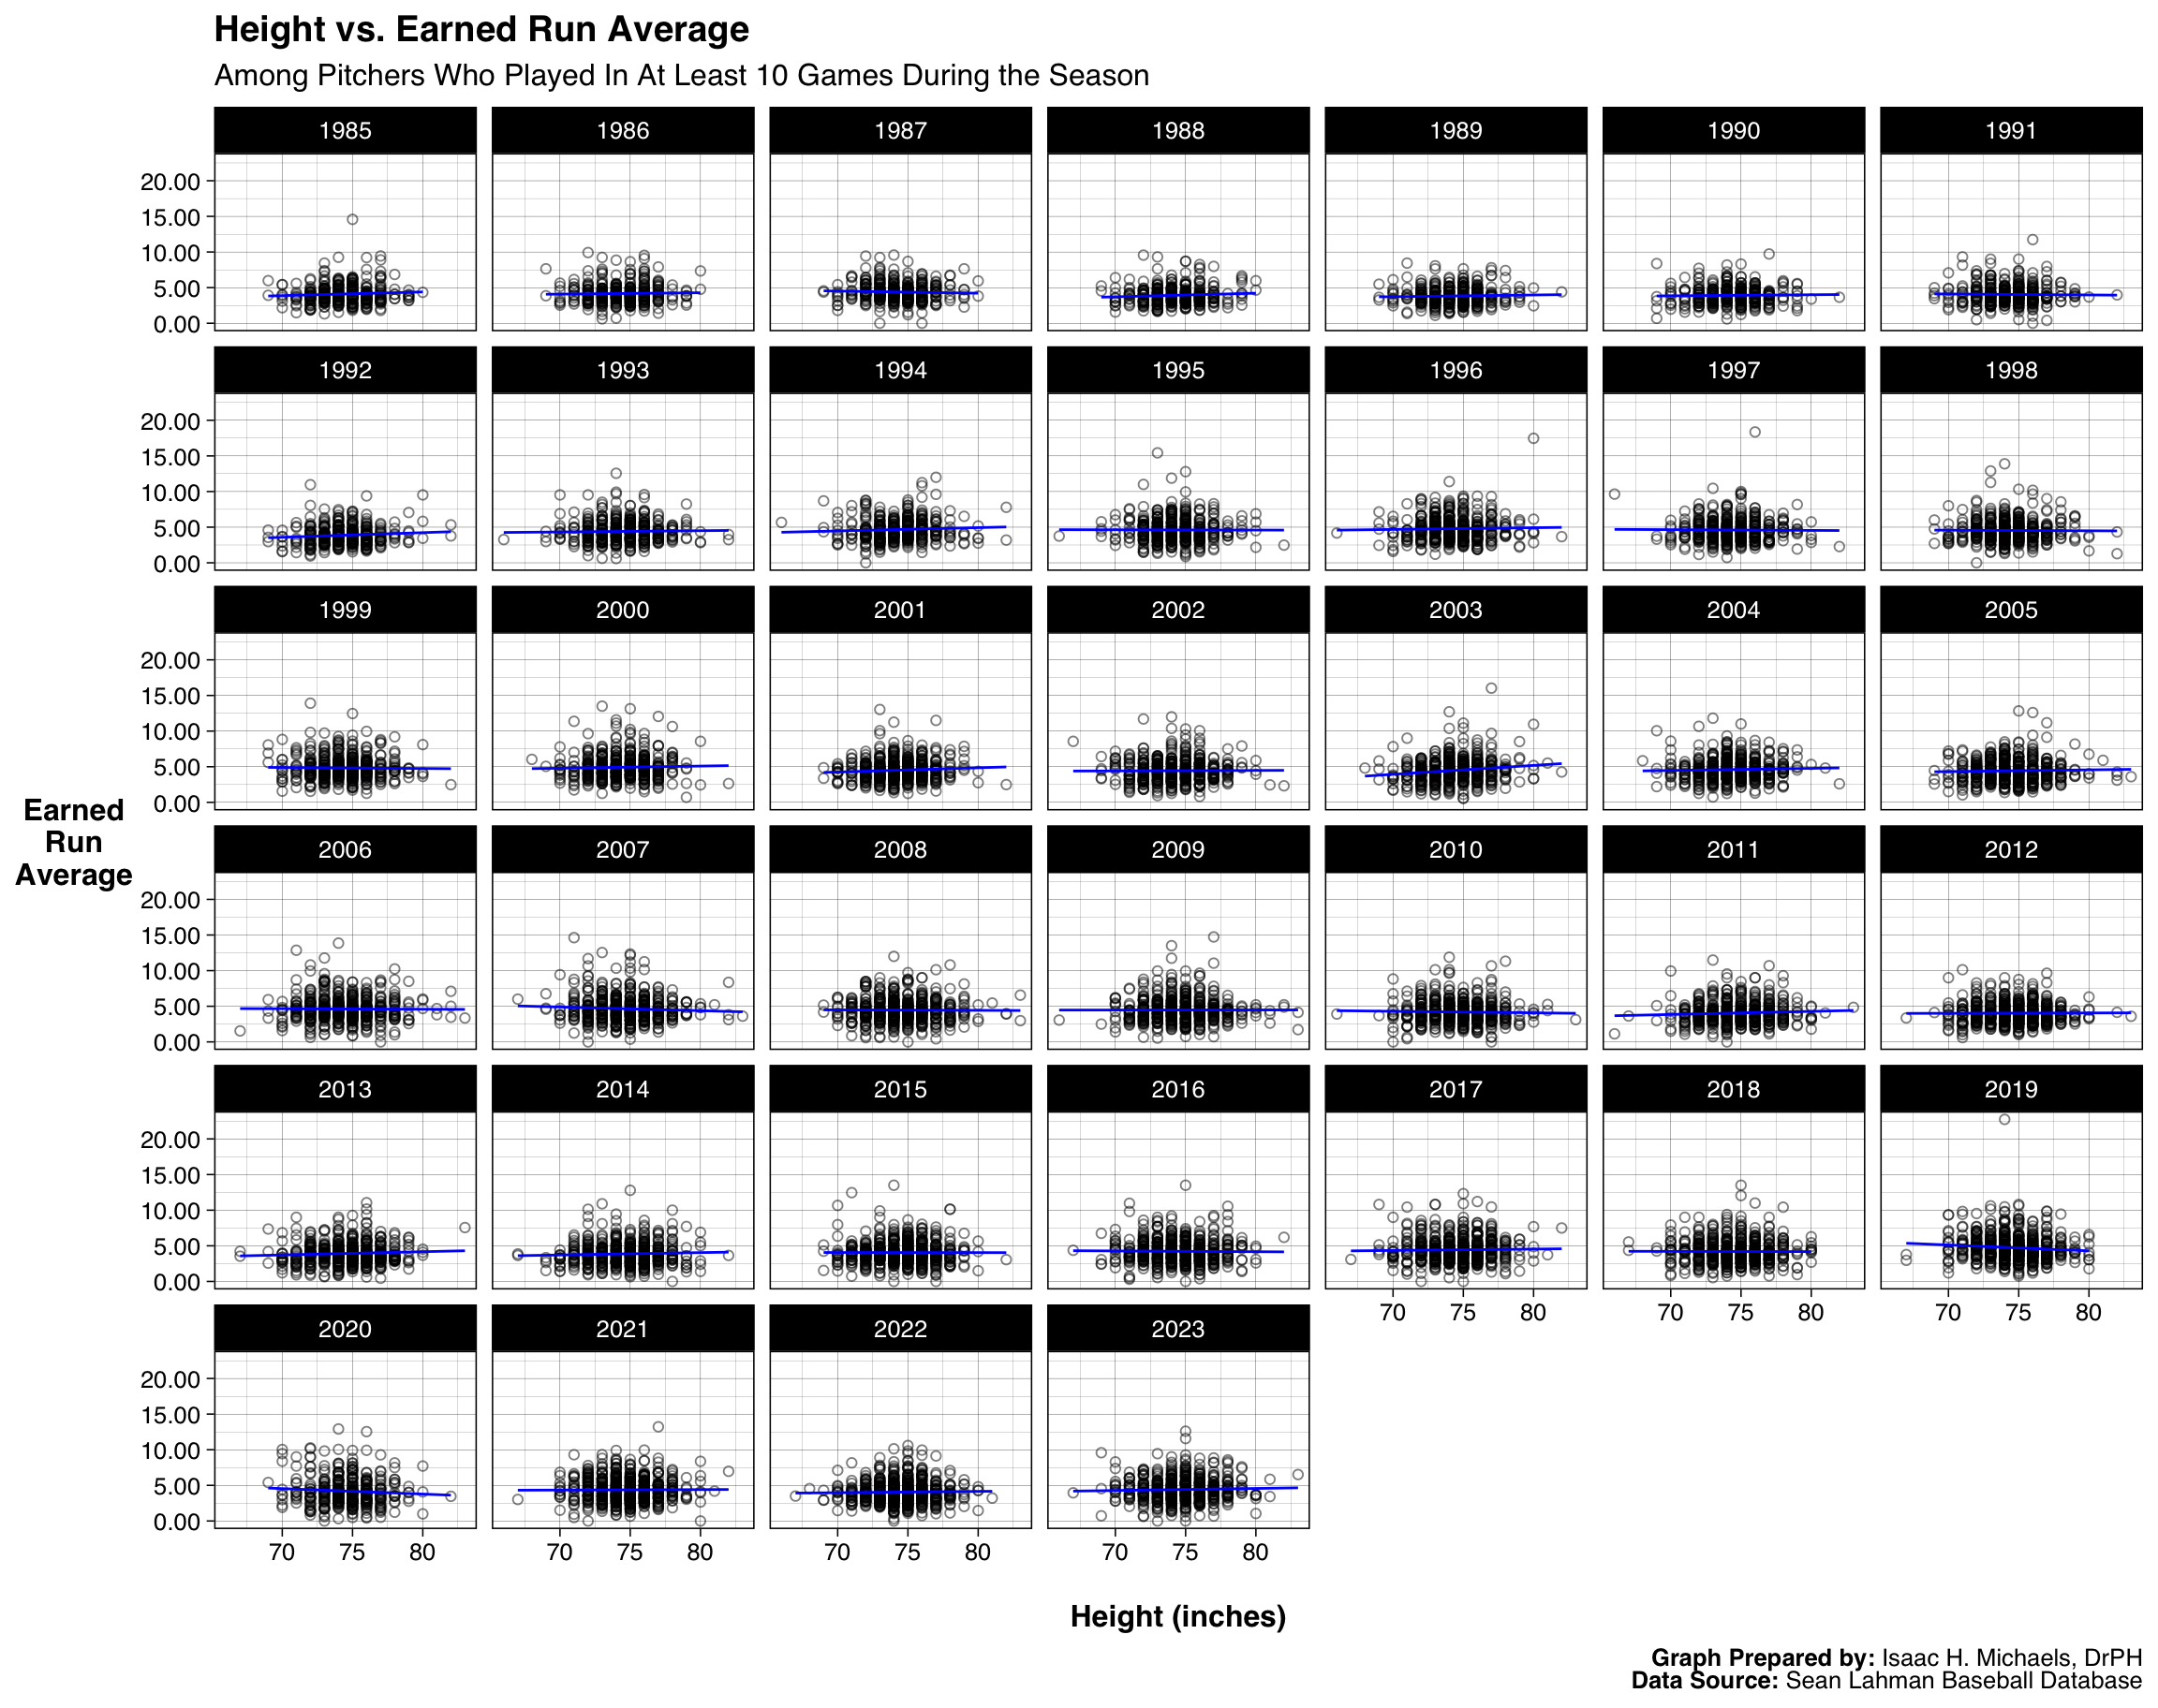 Graph Prepared By:
 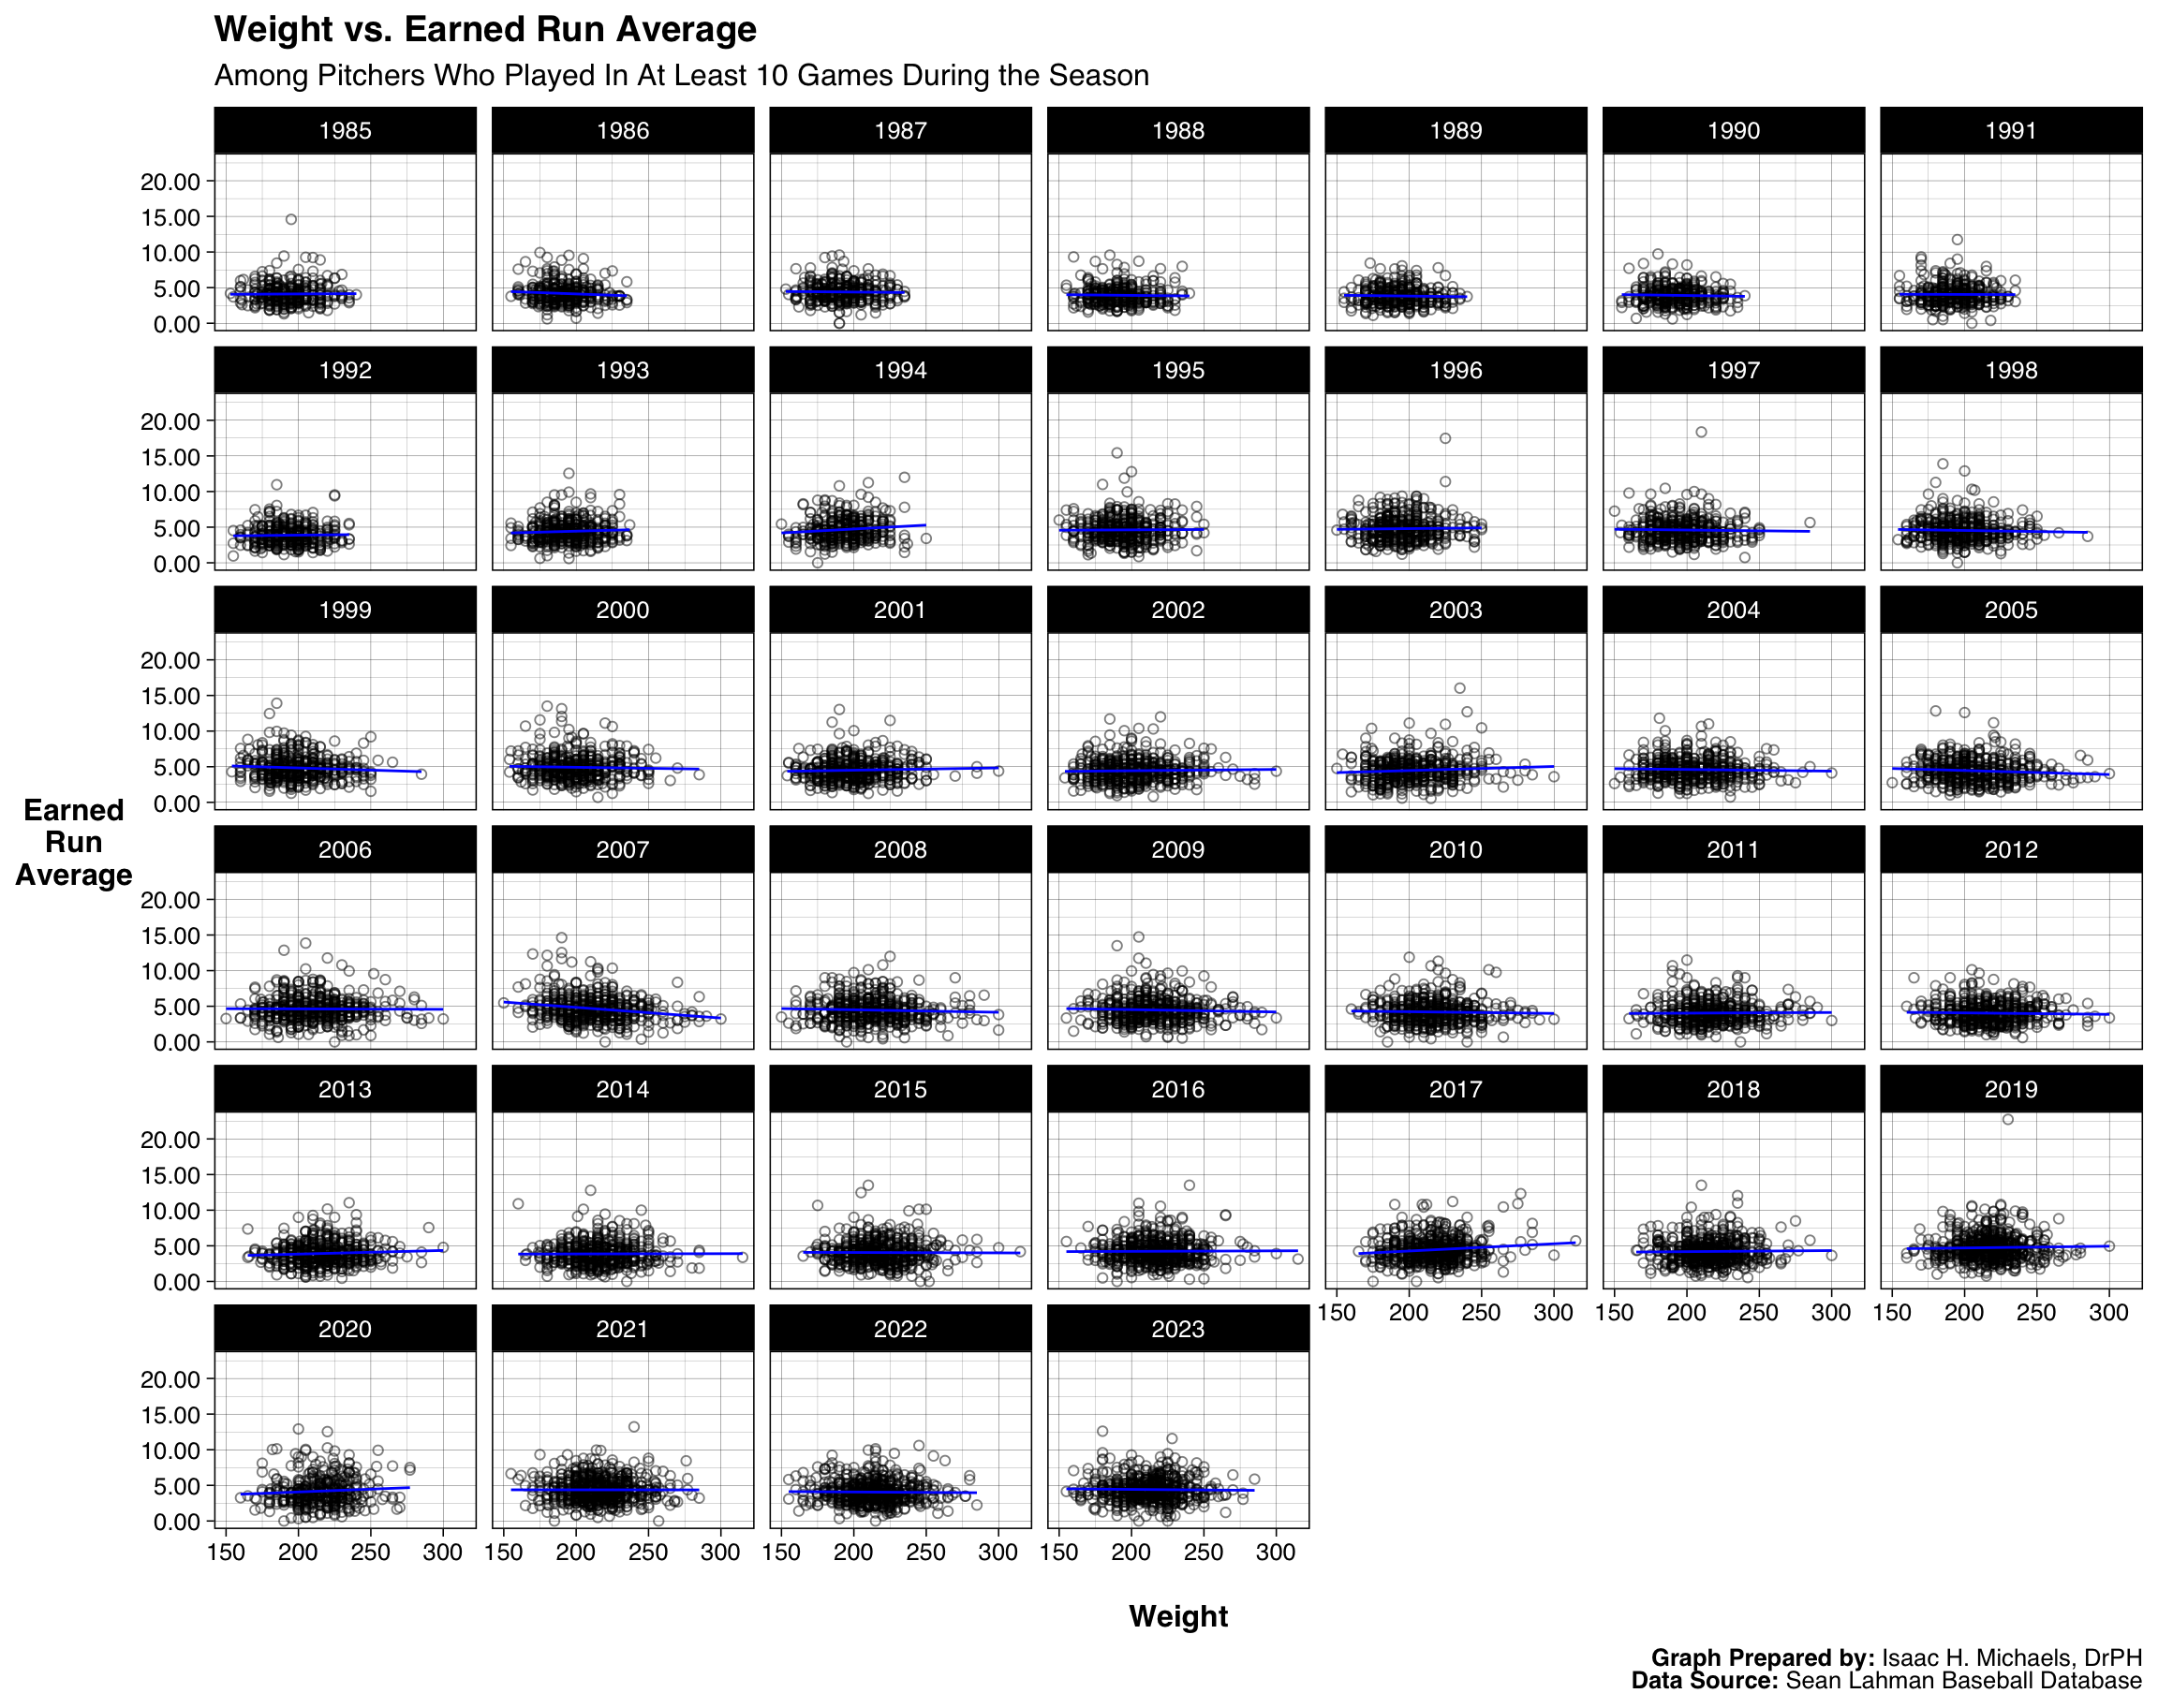 Graph Prepared By:
 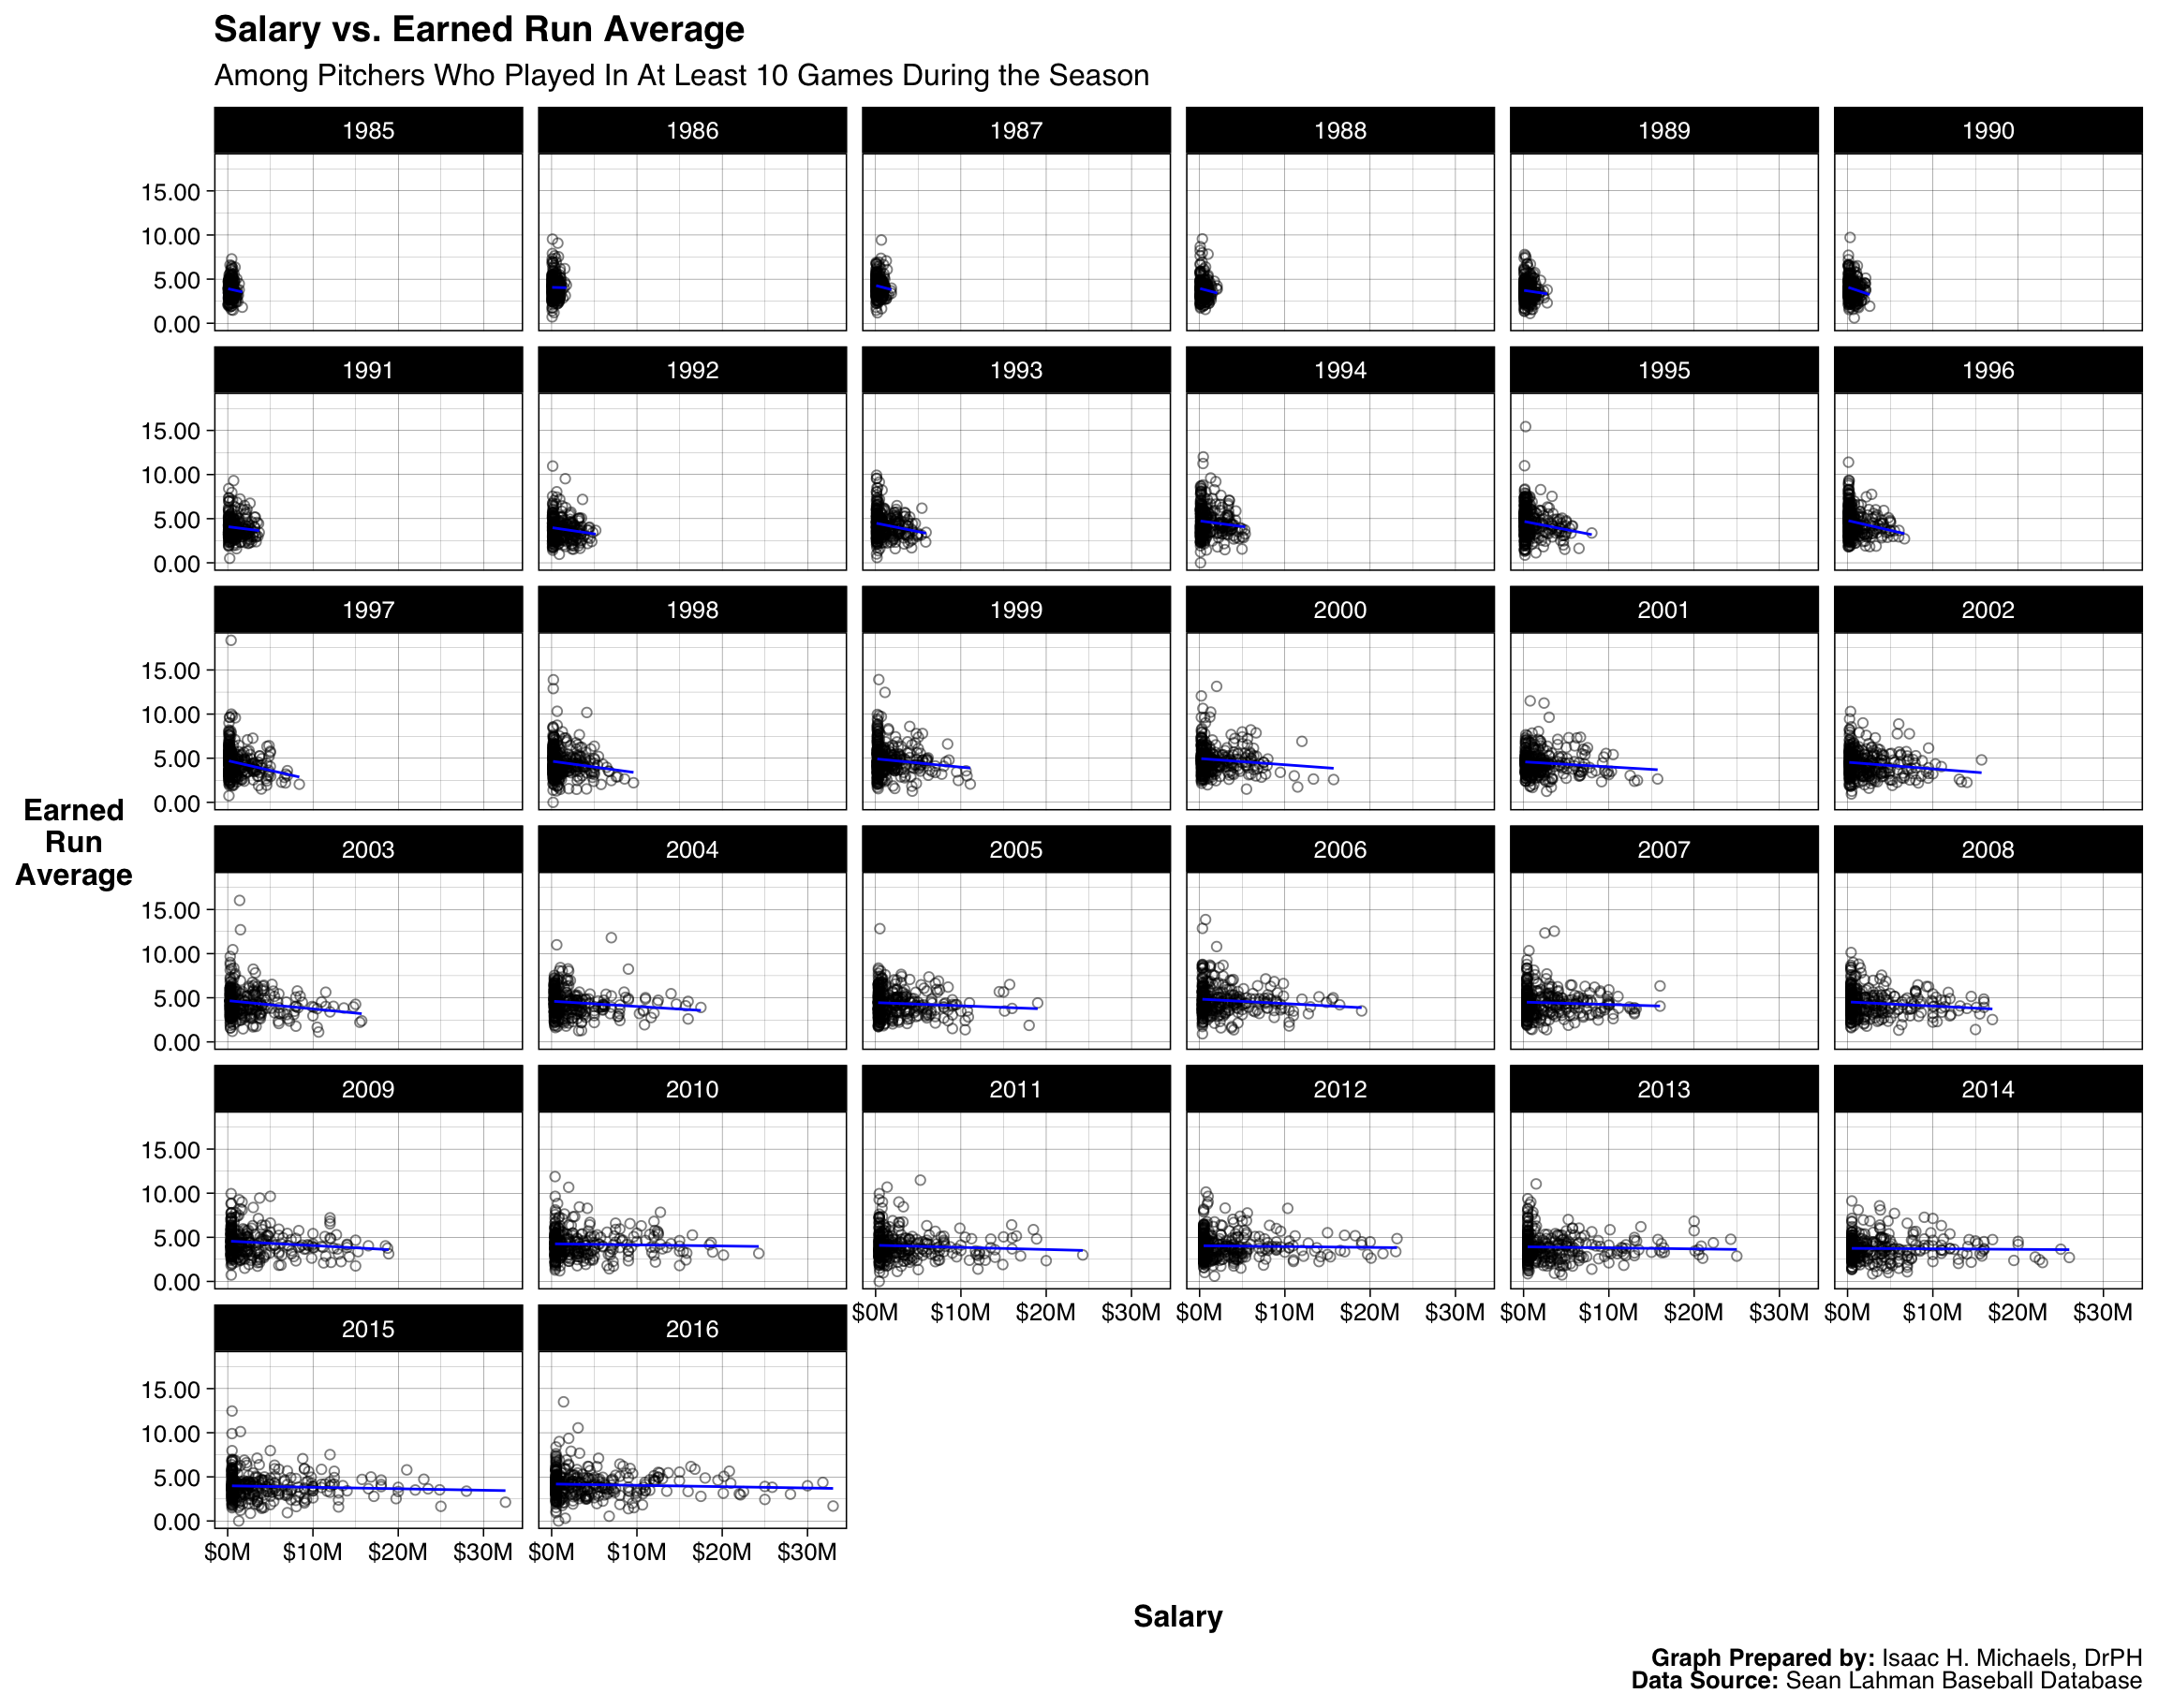 Graph Prepared By:
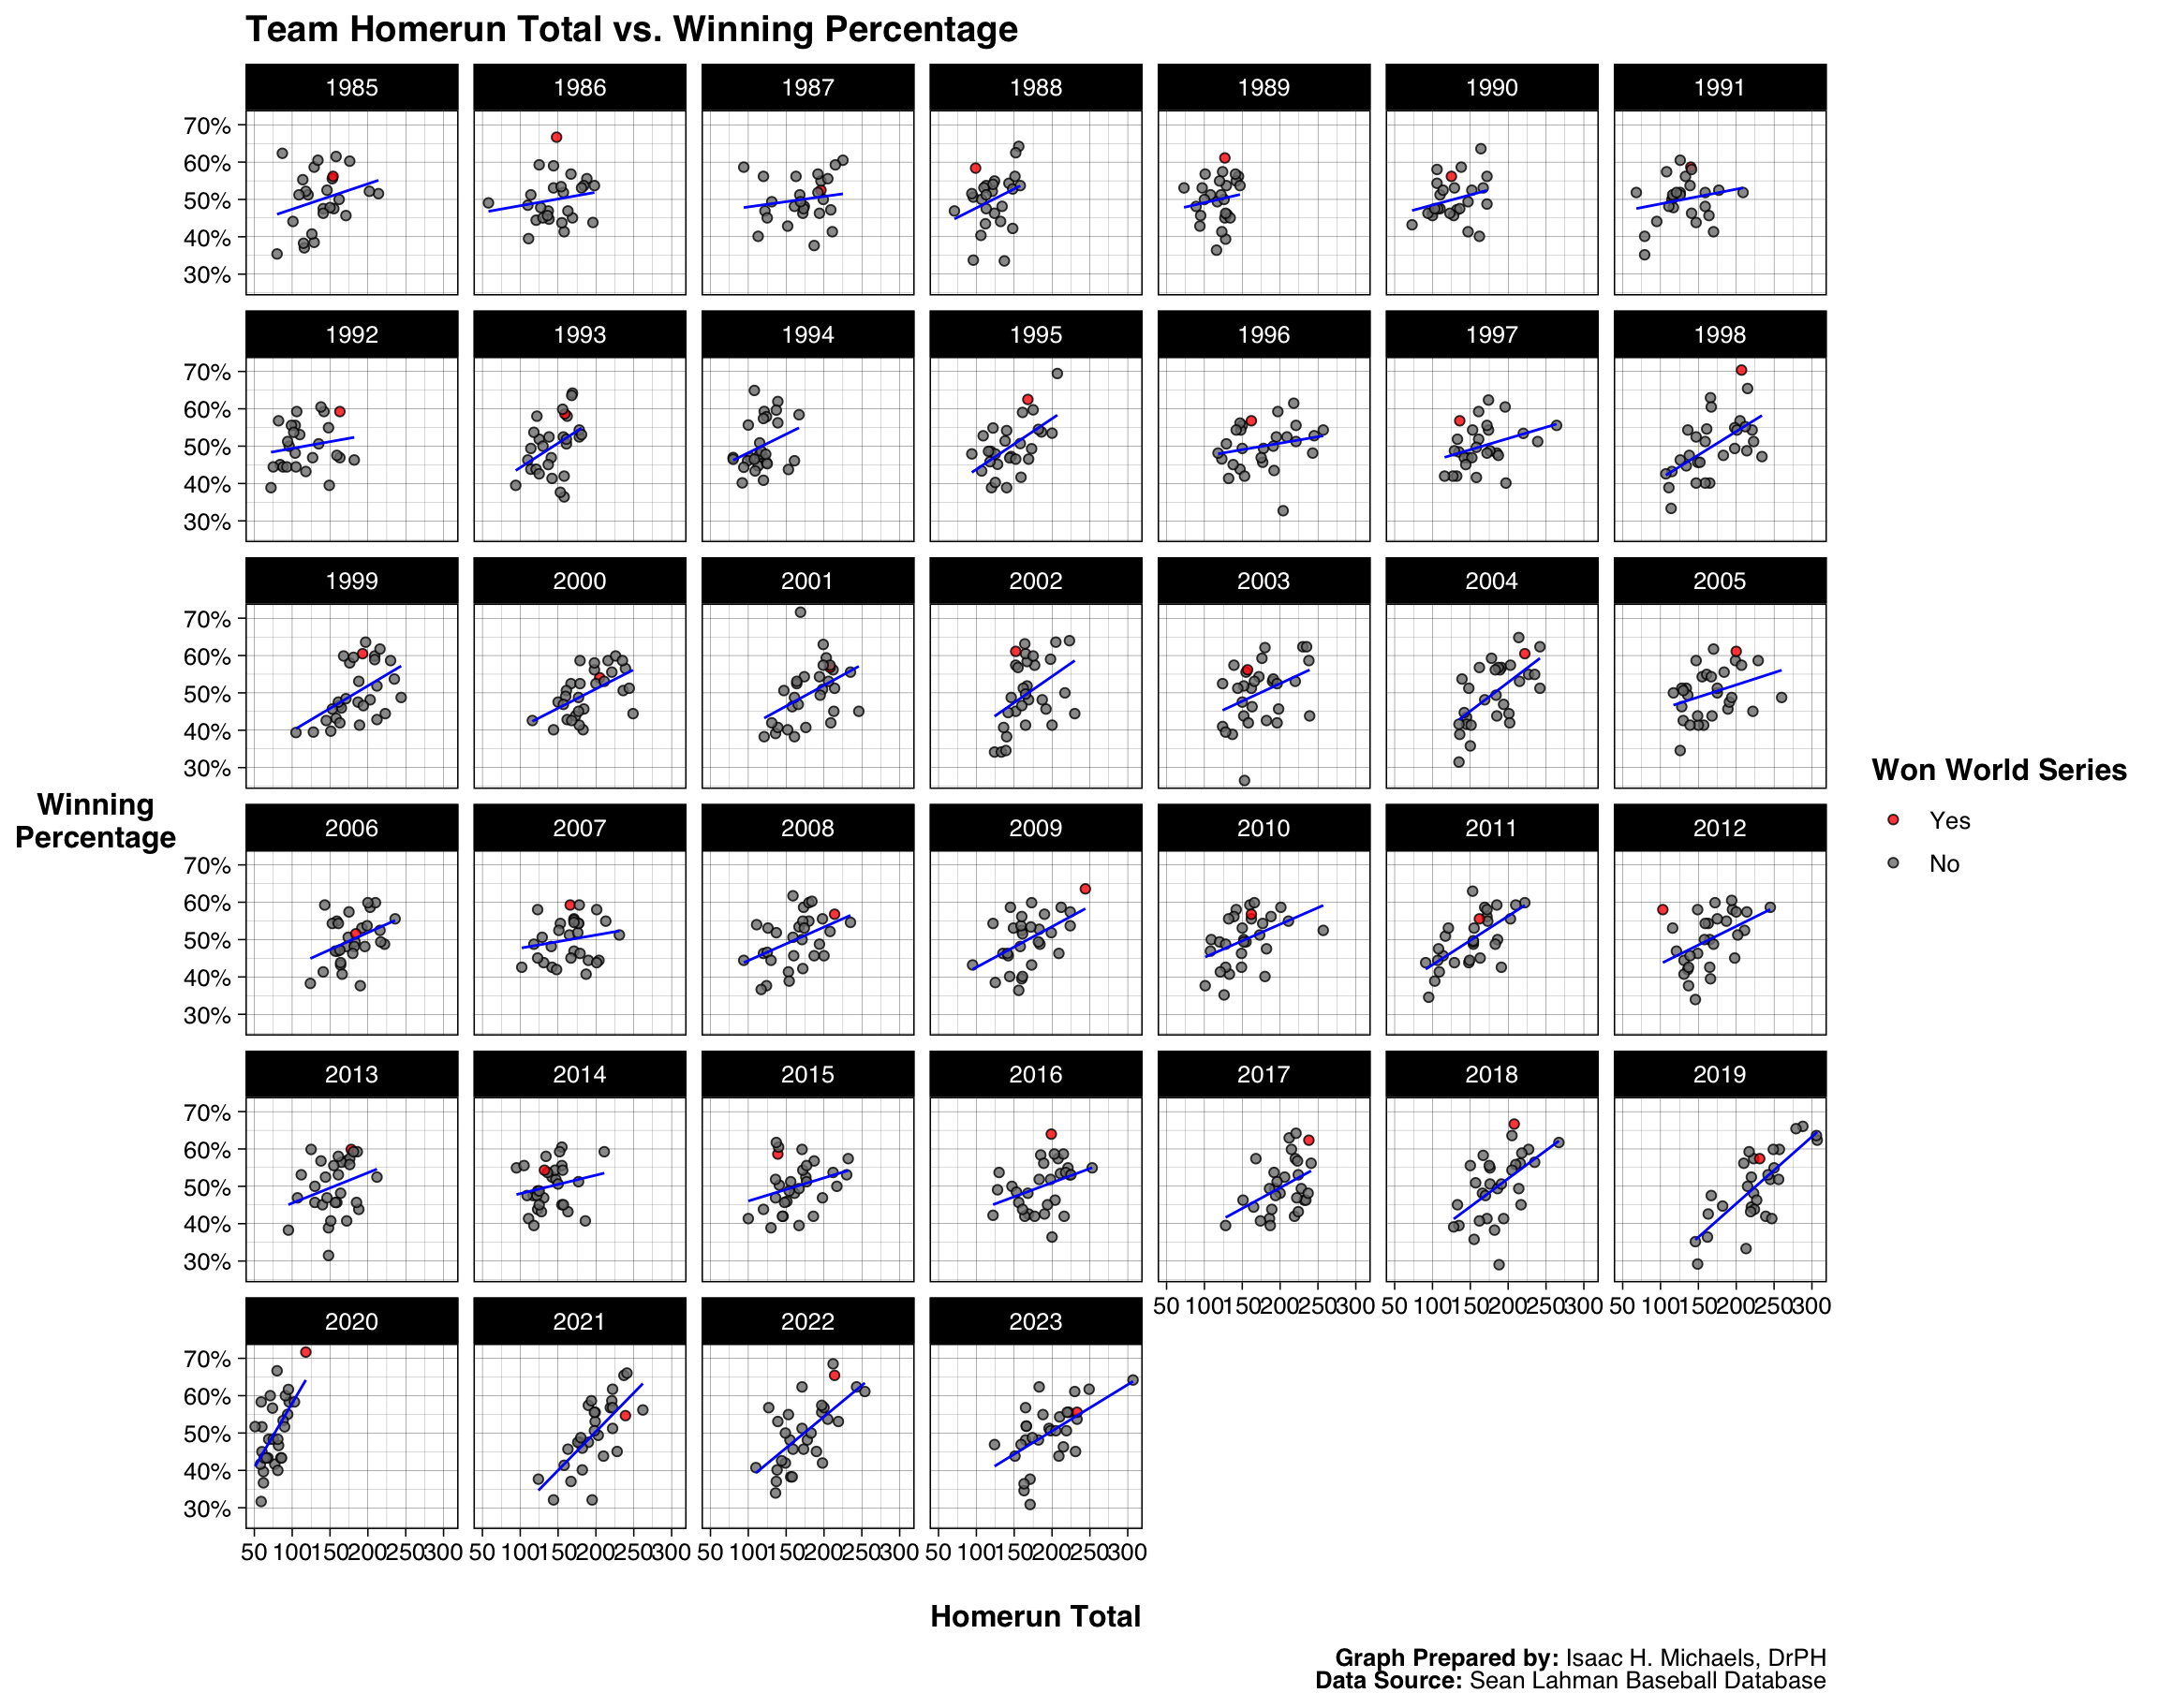
 Team Winning Percentage, Homeruns, and ERA
Winning Percentage vs. Homeruns
 Graph Prepared By: Isaac H. Michaels, MPH
Data Source: Sean Lahman Baseball Database
Winning Percentage vs. ERA
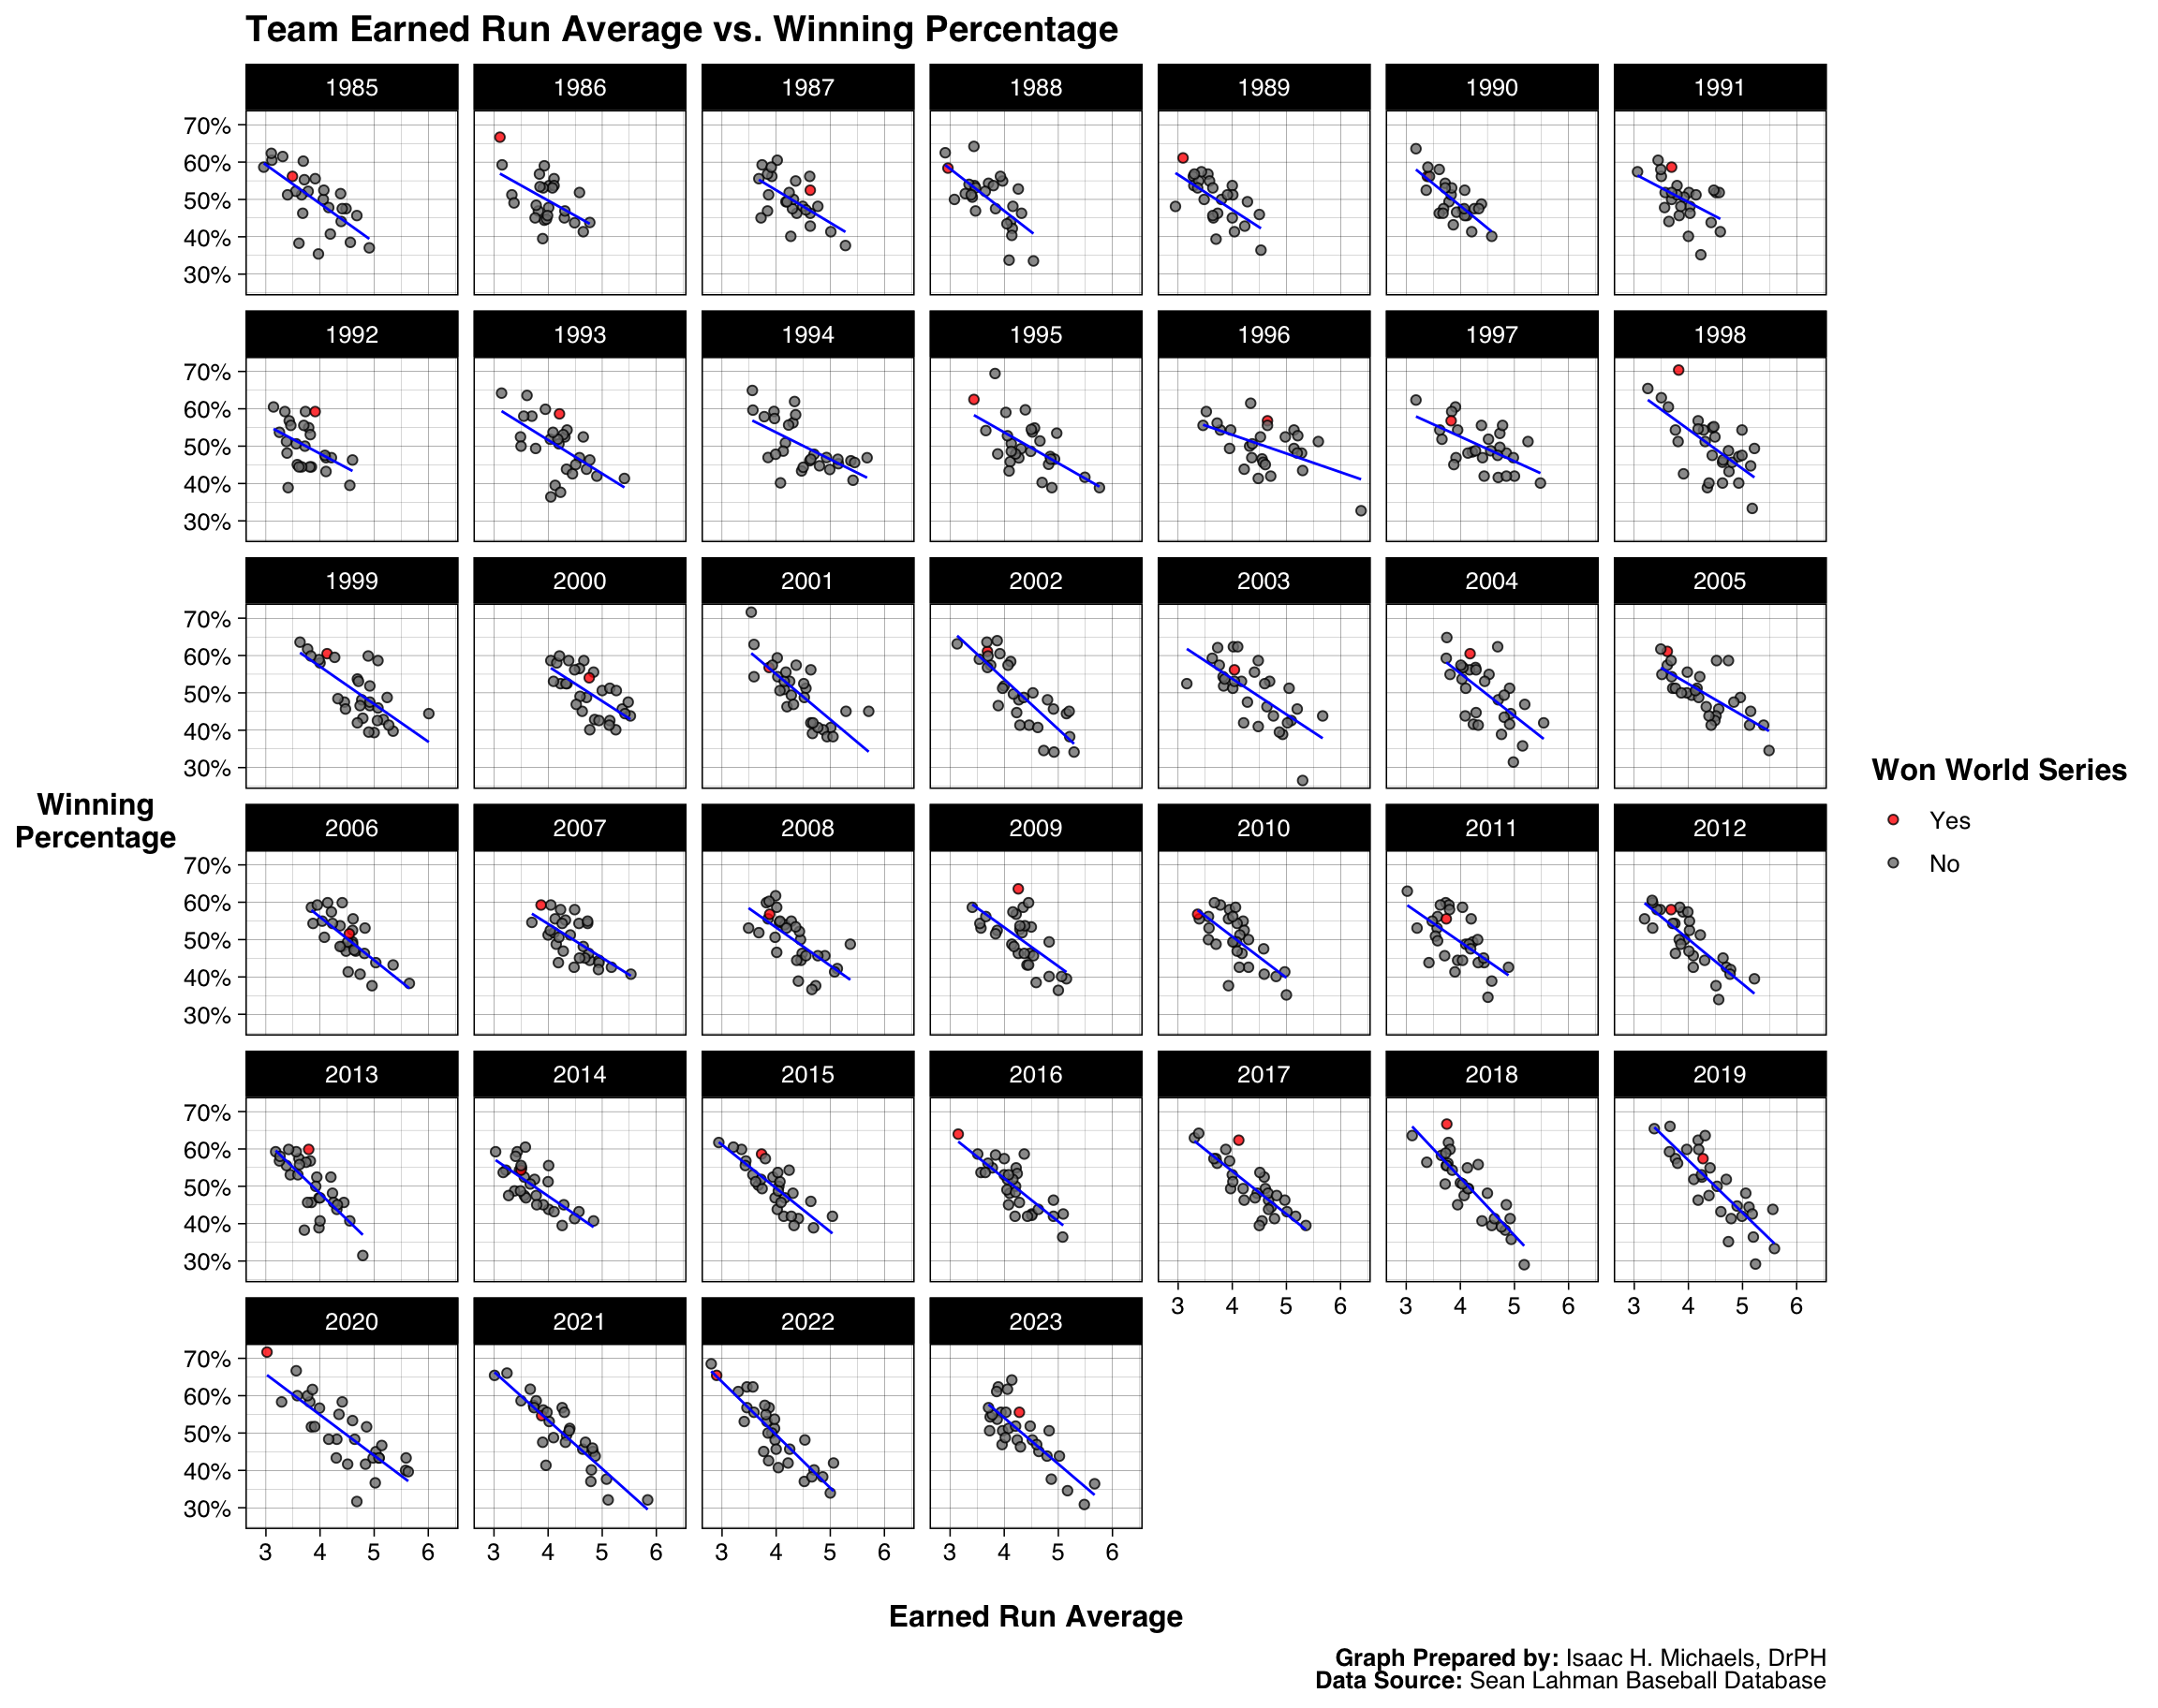 Graph Prepared By: Isaac H. Michaels, MPH
Data Source: Sean Lahman Baseball Database
Homeruns vs. ERA
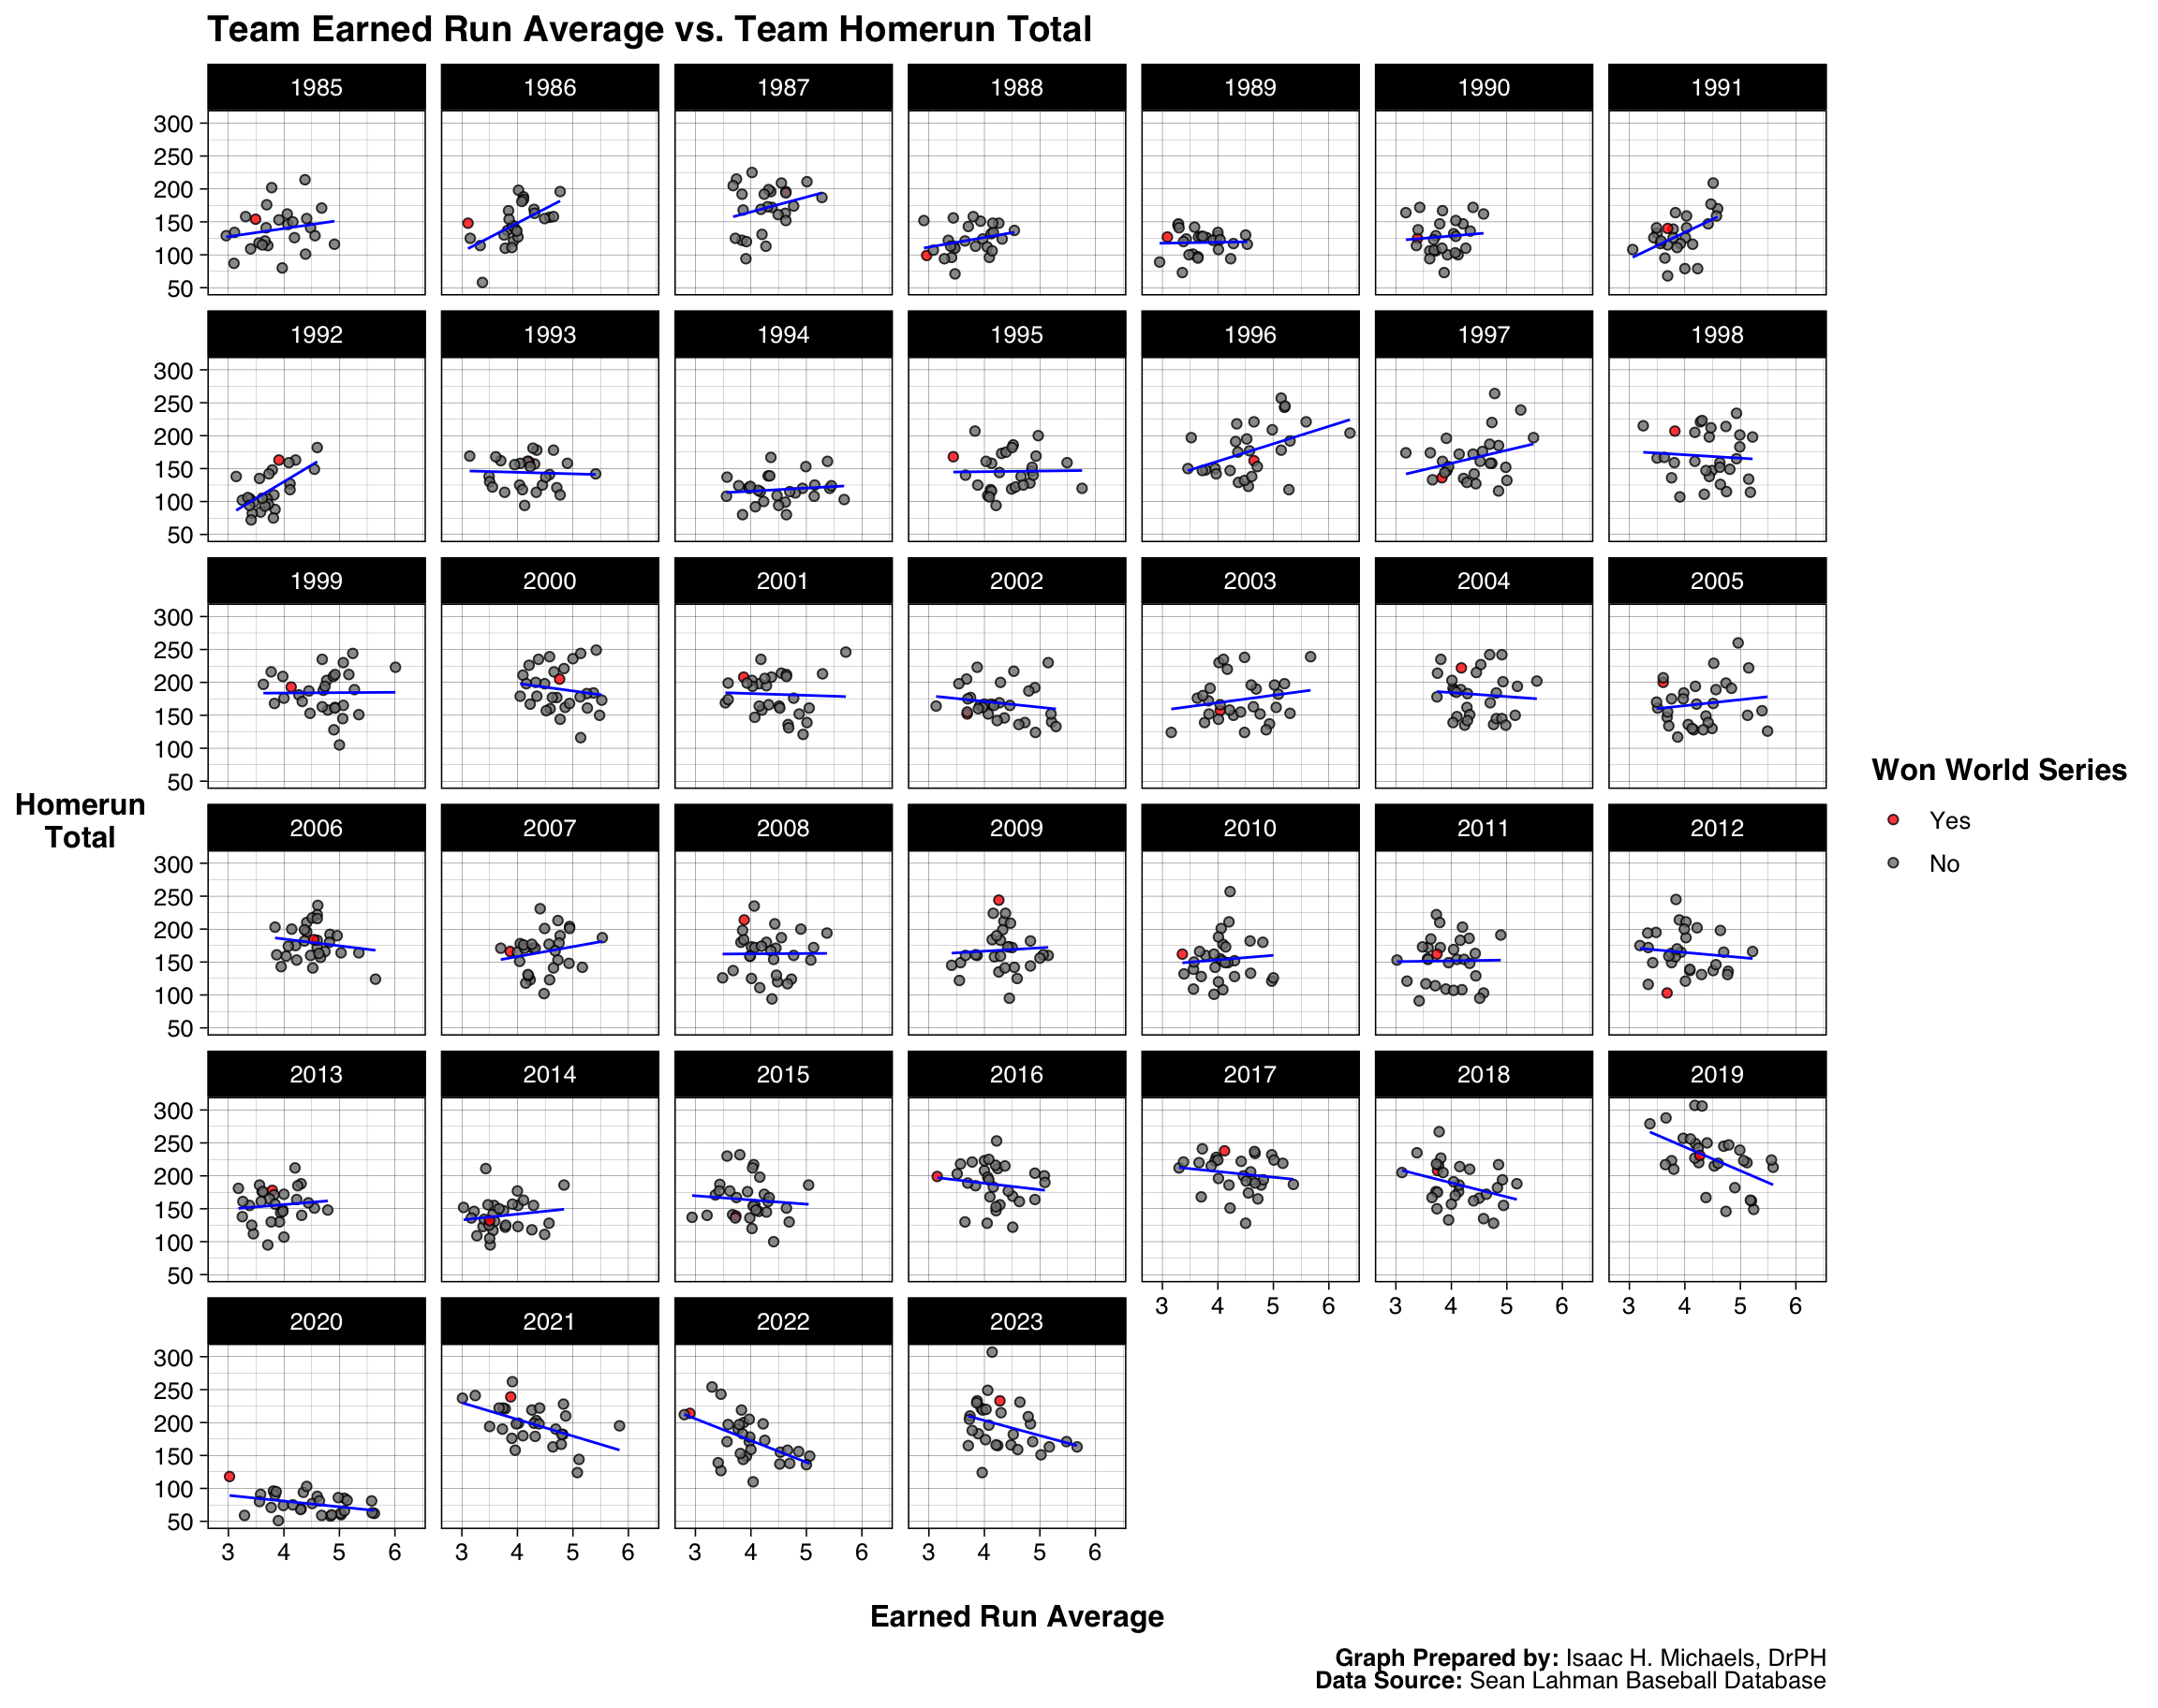 Graph Prepared By: Isaac H. Michaels, MPH
Data Source: Sean Lahman Baseball Database
Team Winning Percentage, Payroll, and Attendance
Payroll vs. Winning Percentage
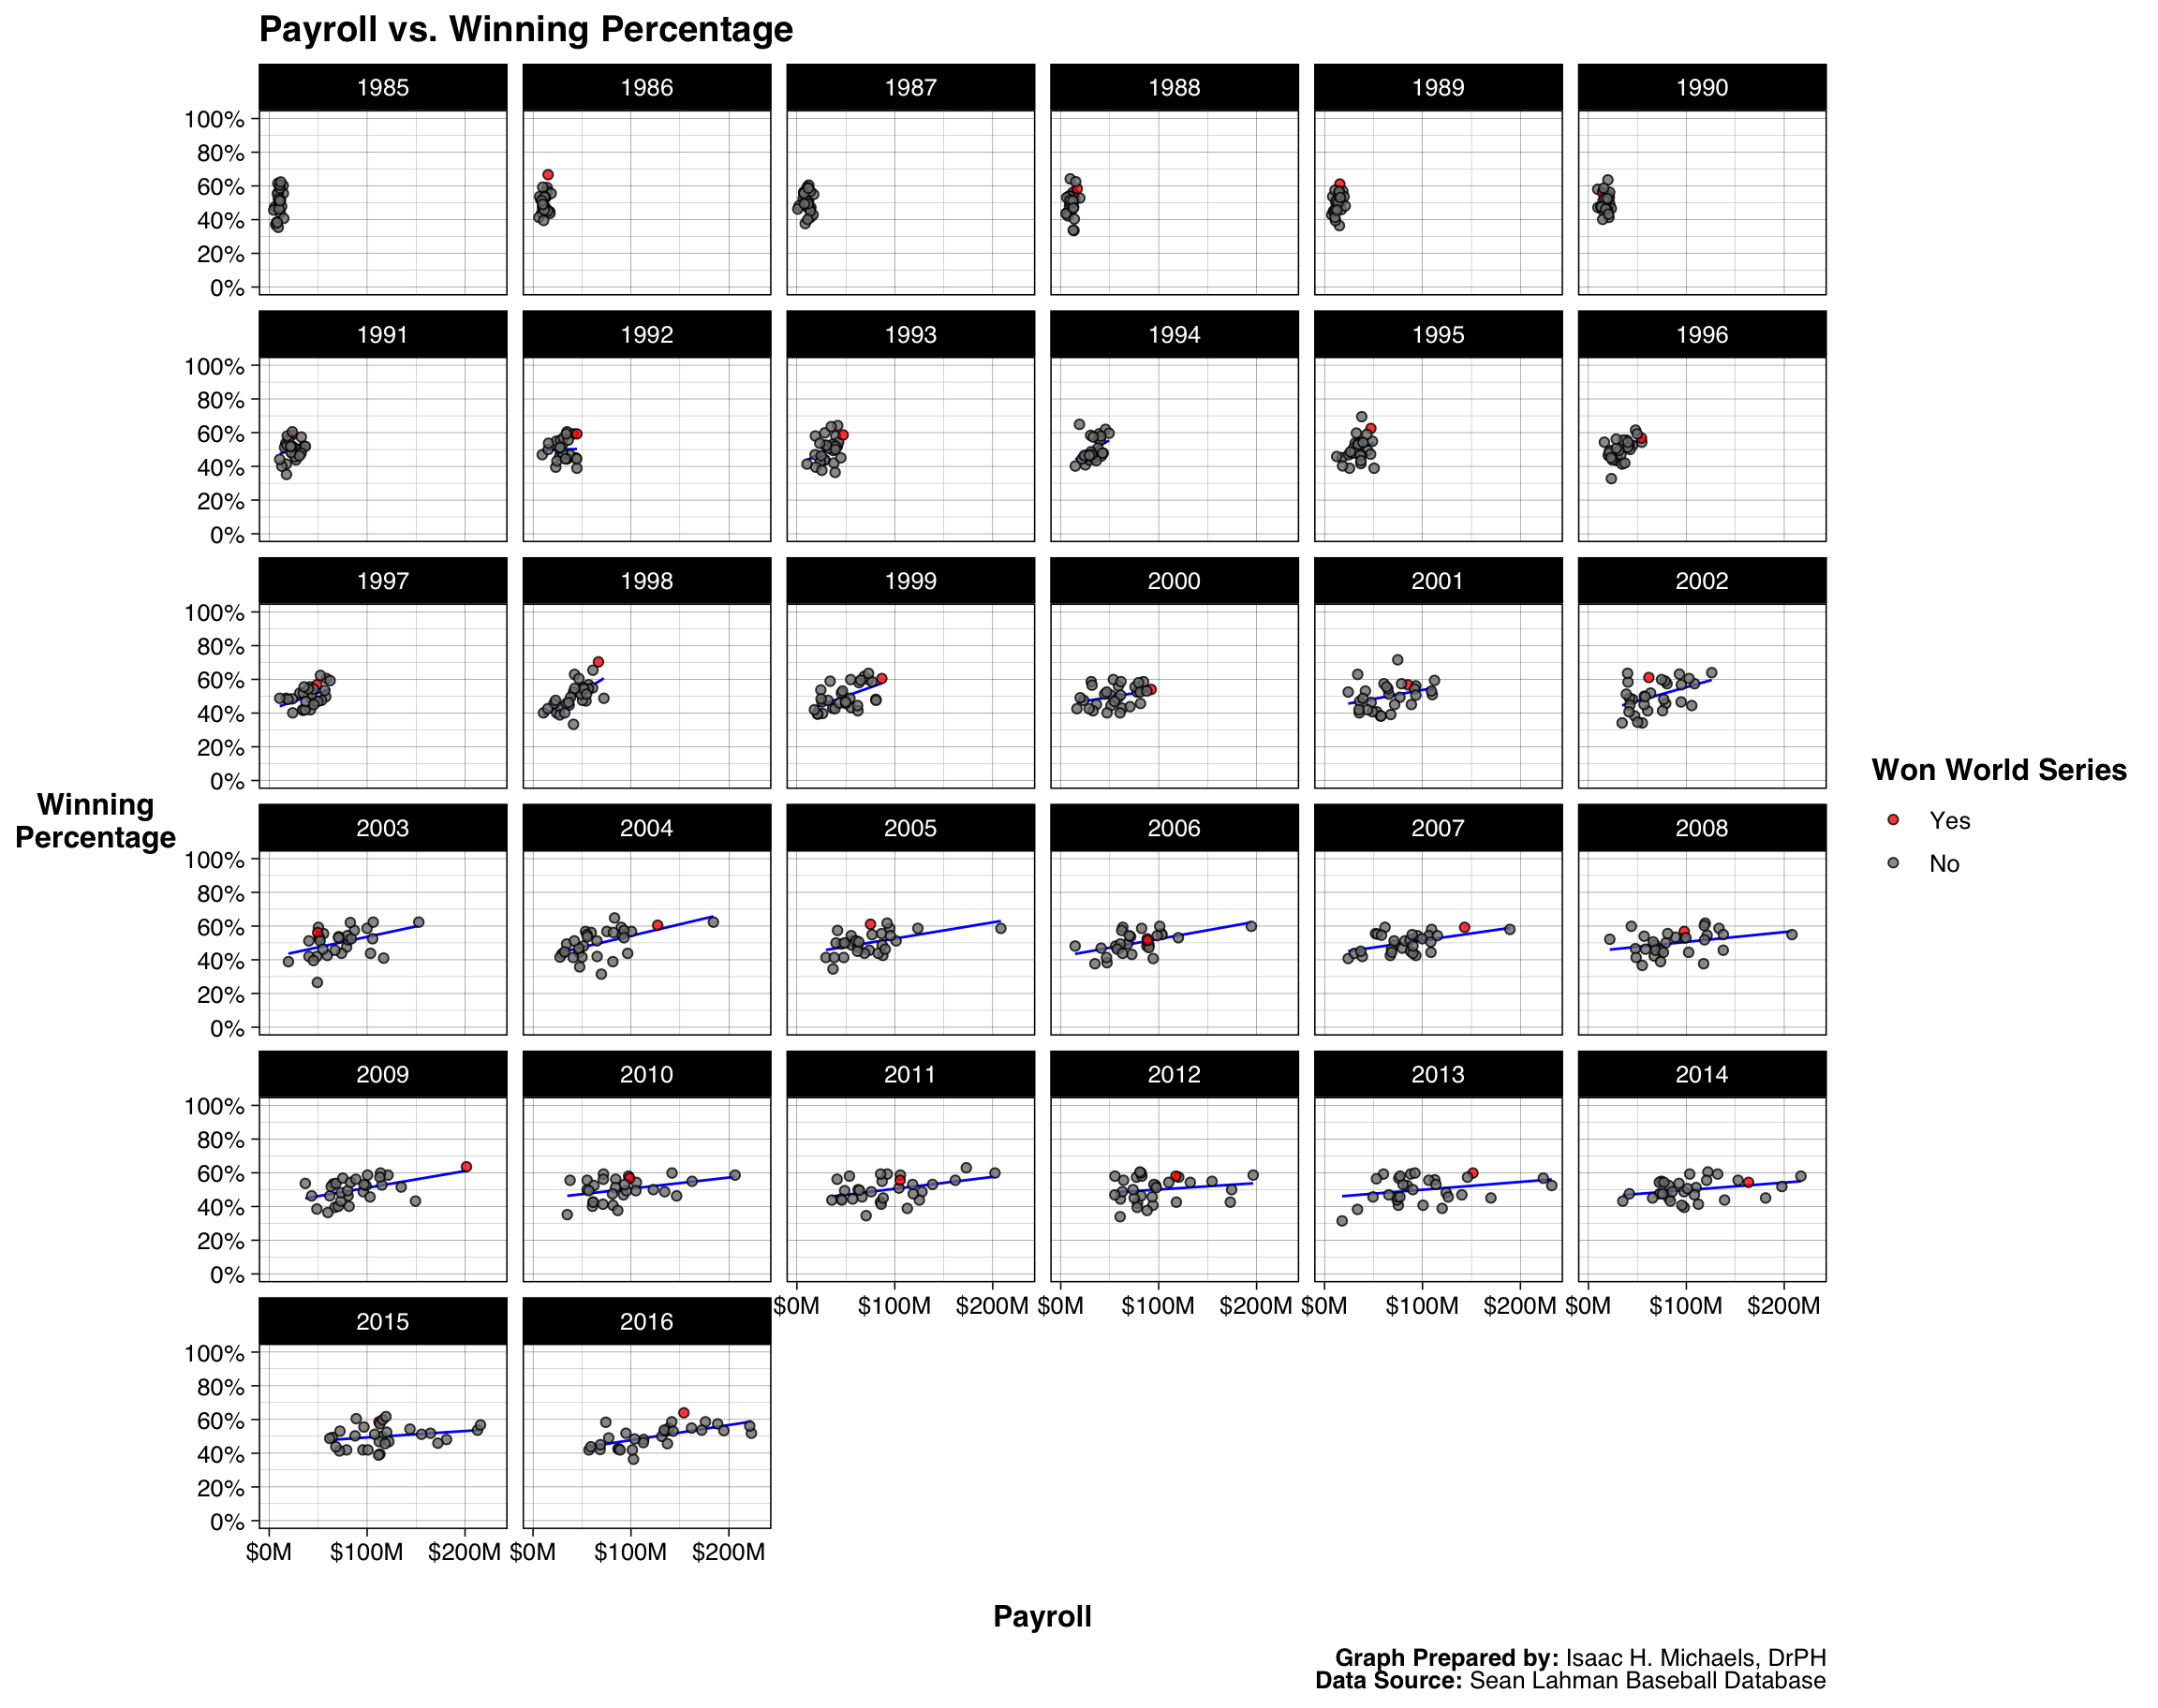 Graph Prepared By: Isaac H. Michaels, MPH
Data Source: Sean Lahman Baseball Database
Payroll vs. Attendance
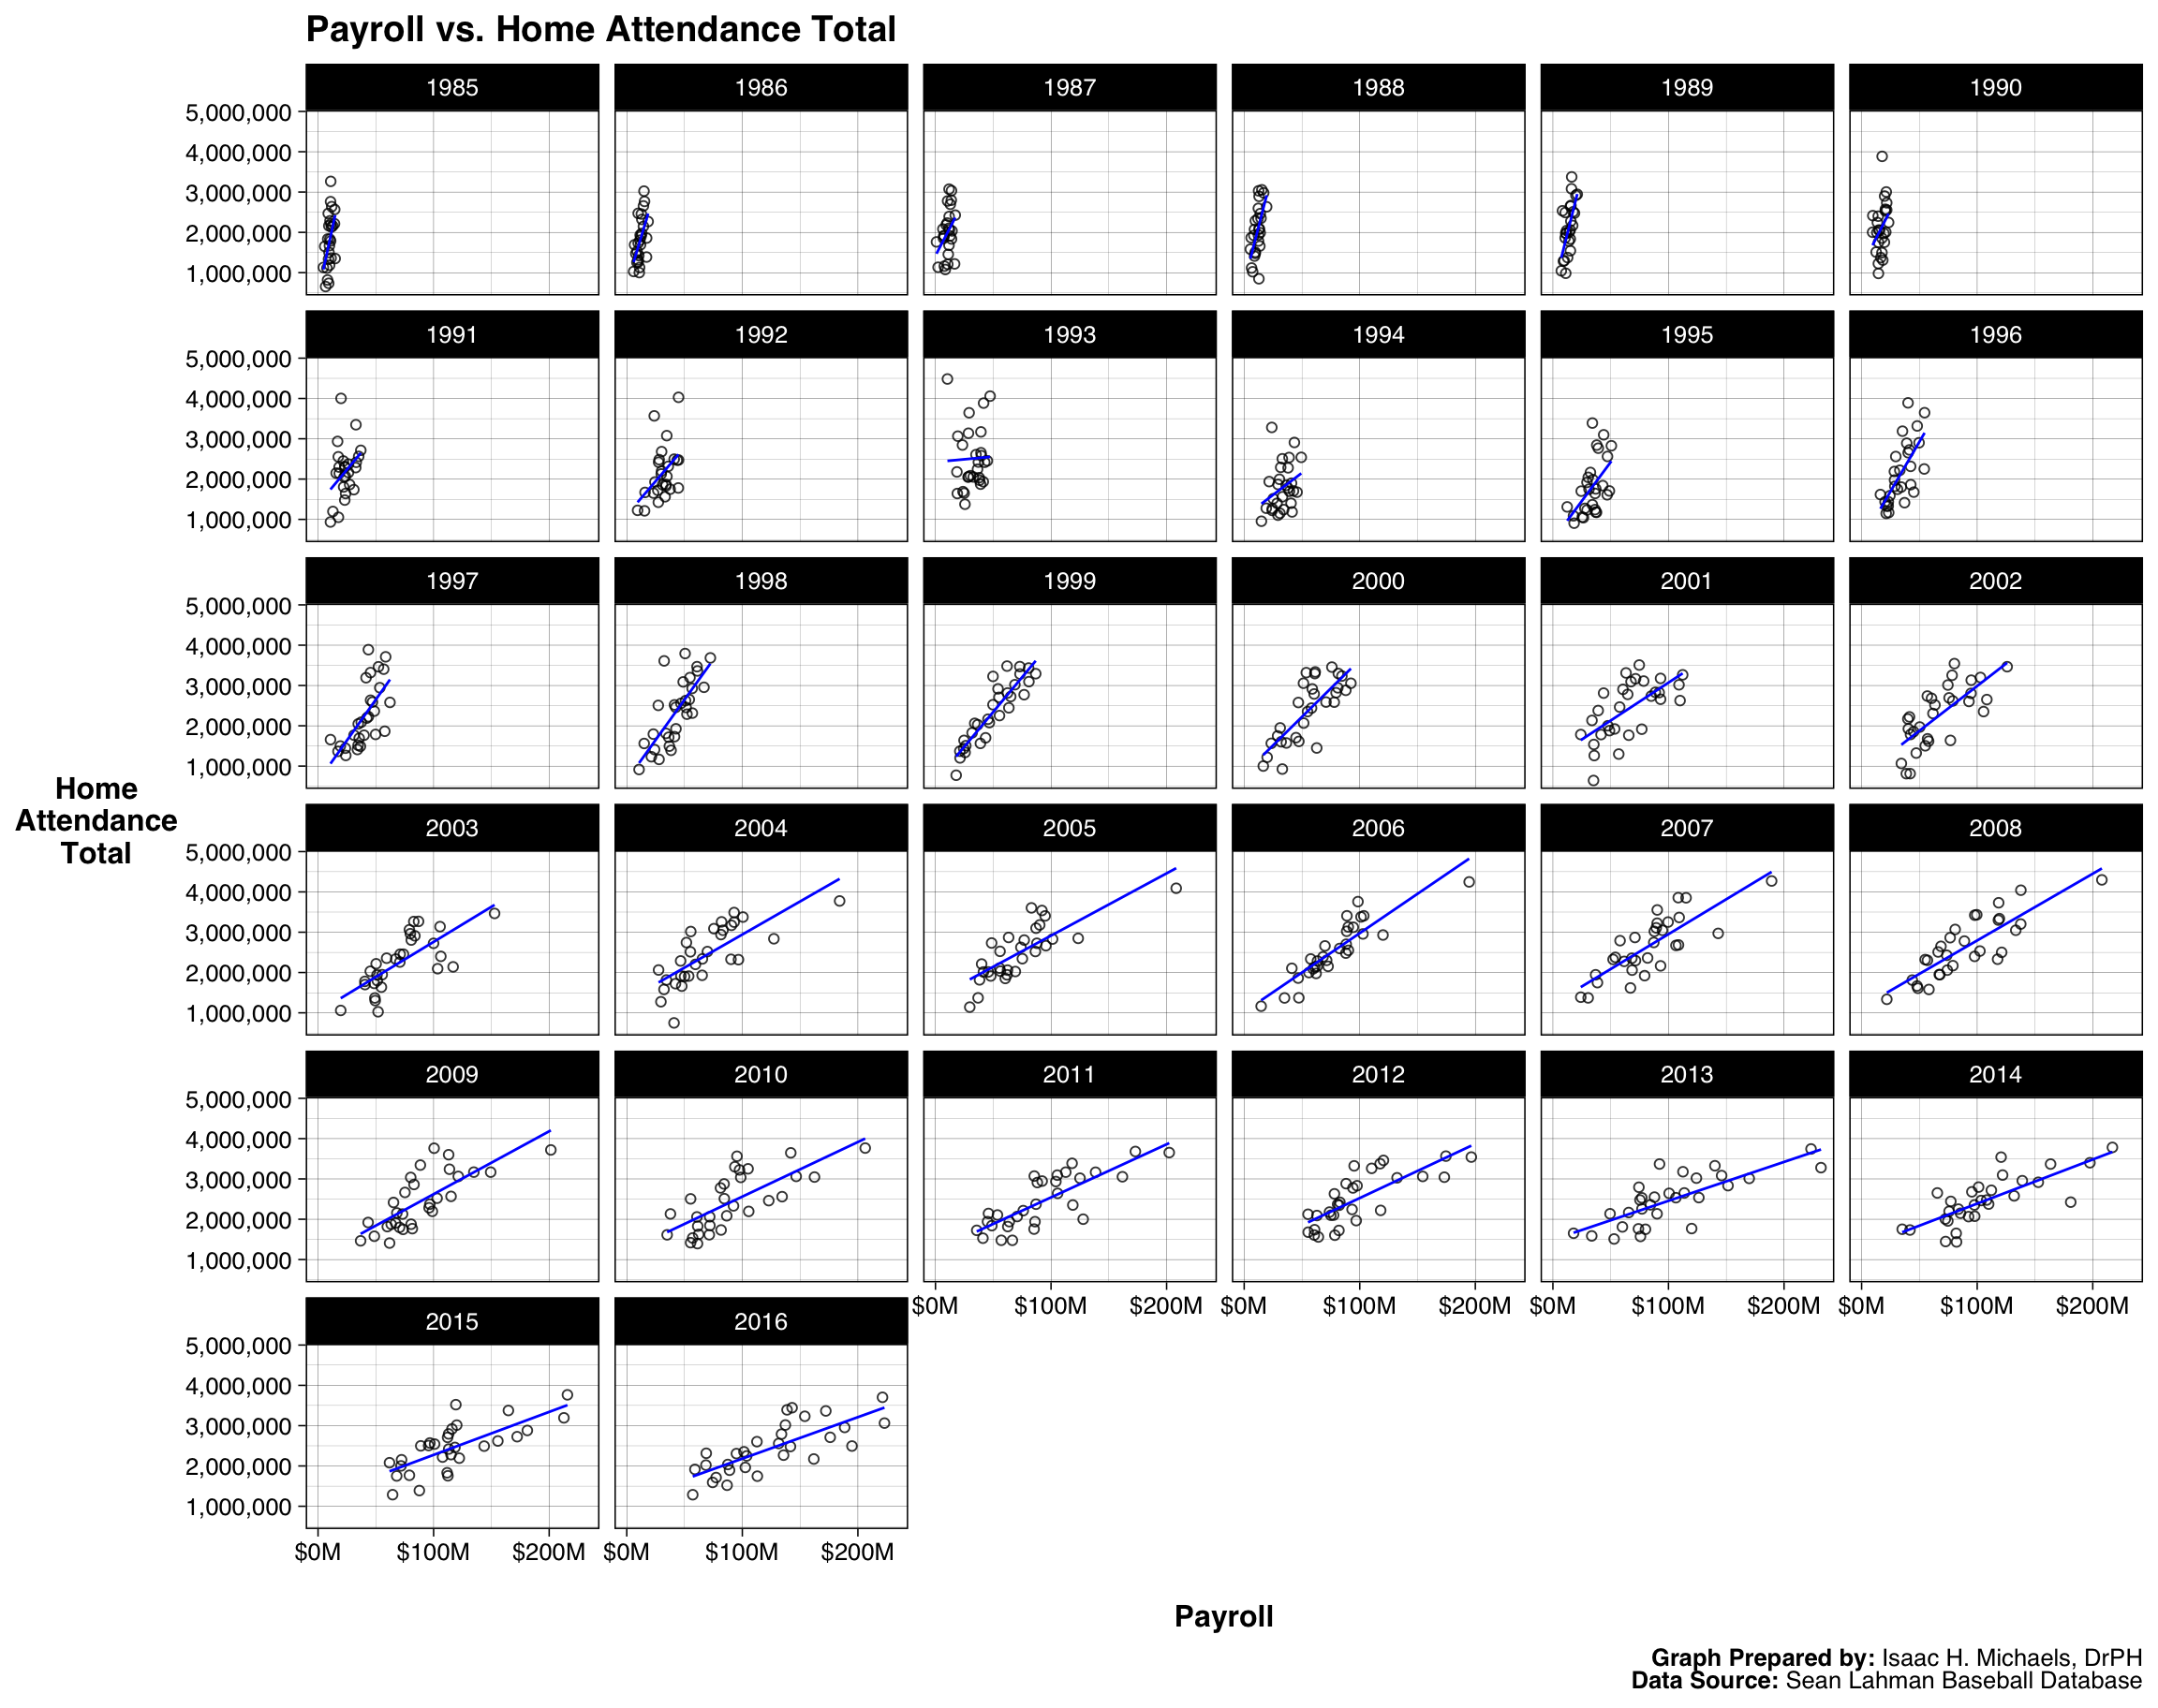 Graph Prepared By: Isaac H. Michaels, MPH
Data Source: Sean Lahman Baseball Database
Winning Percentage vs. Attendance
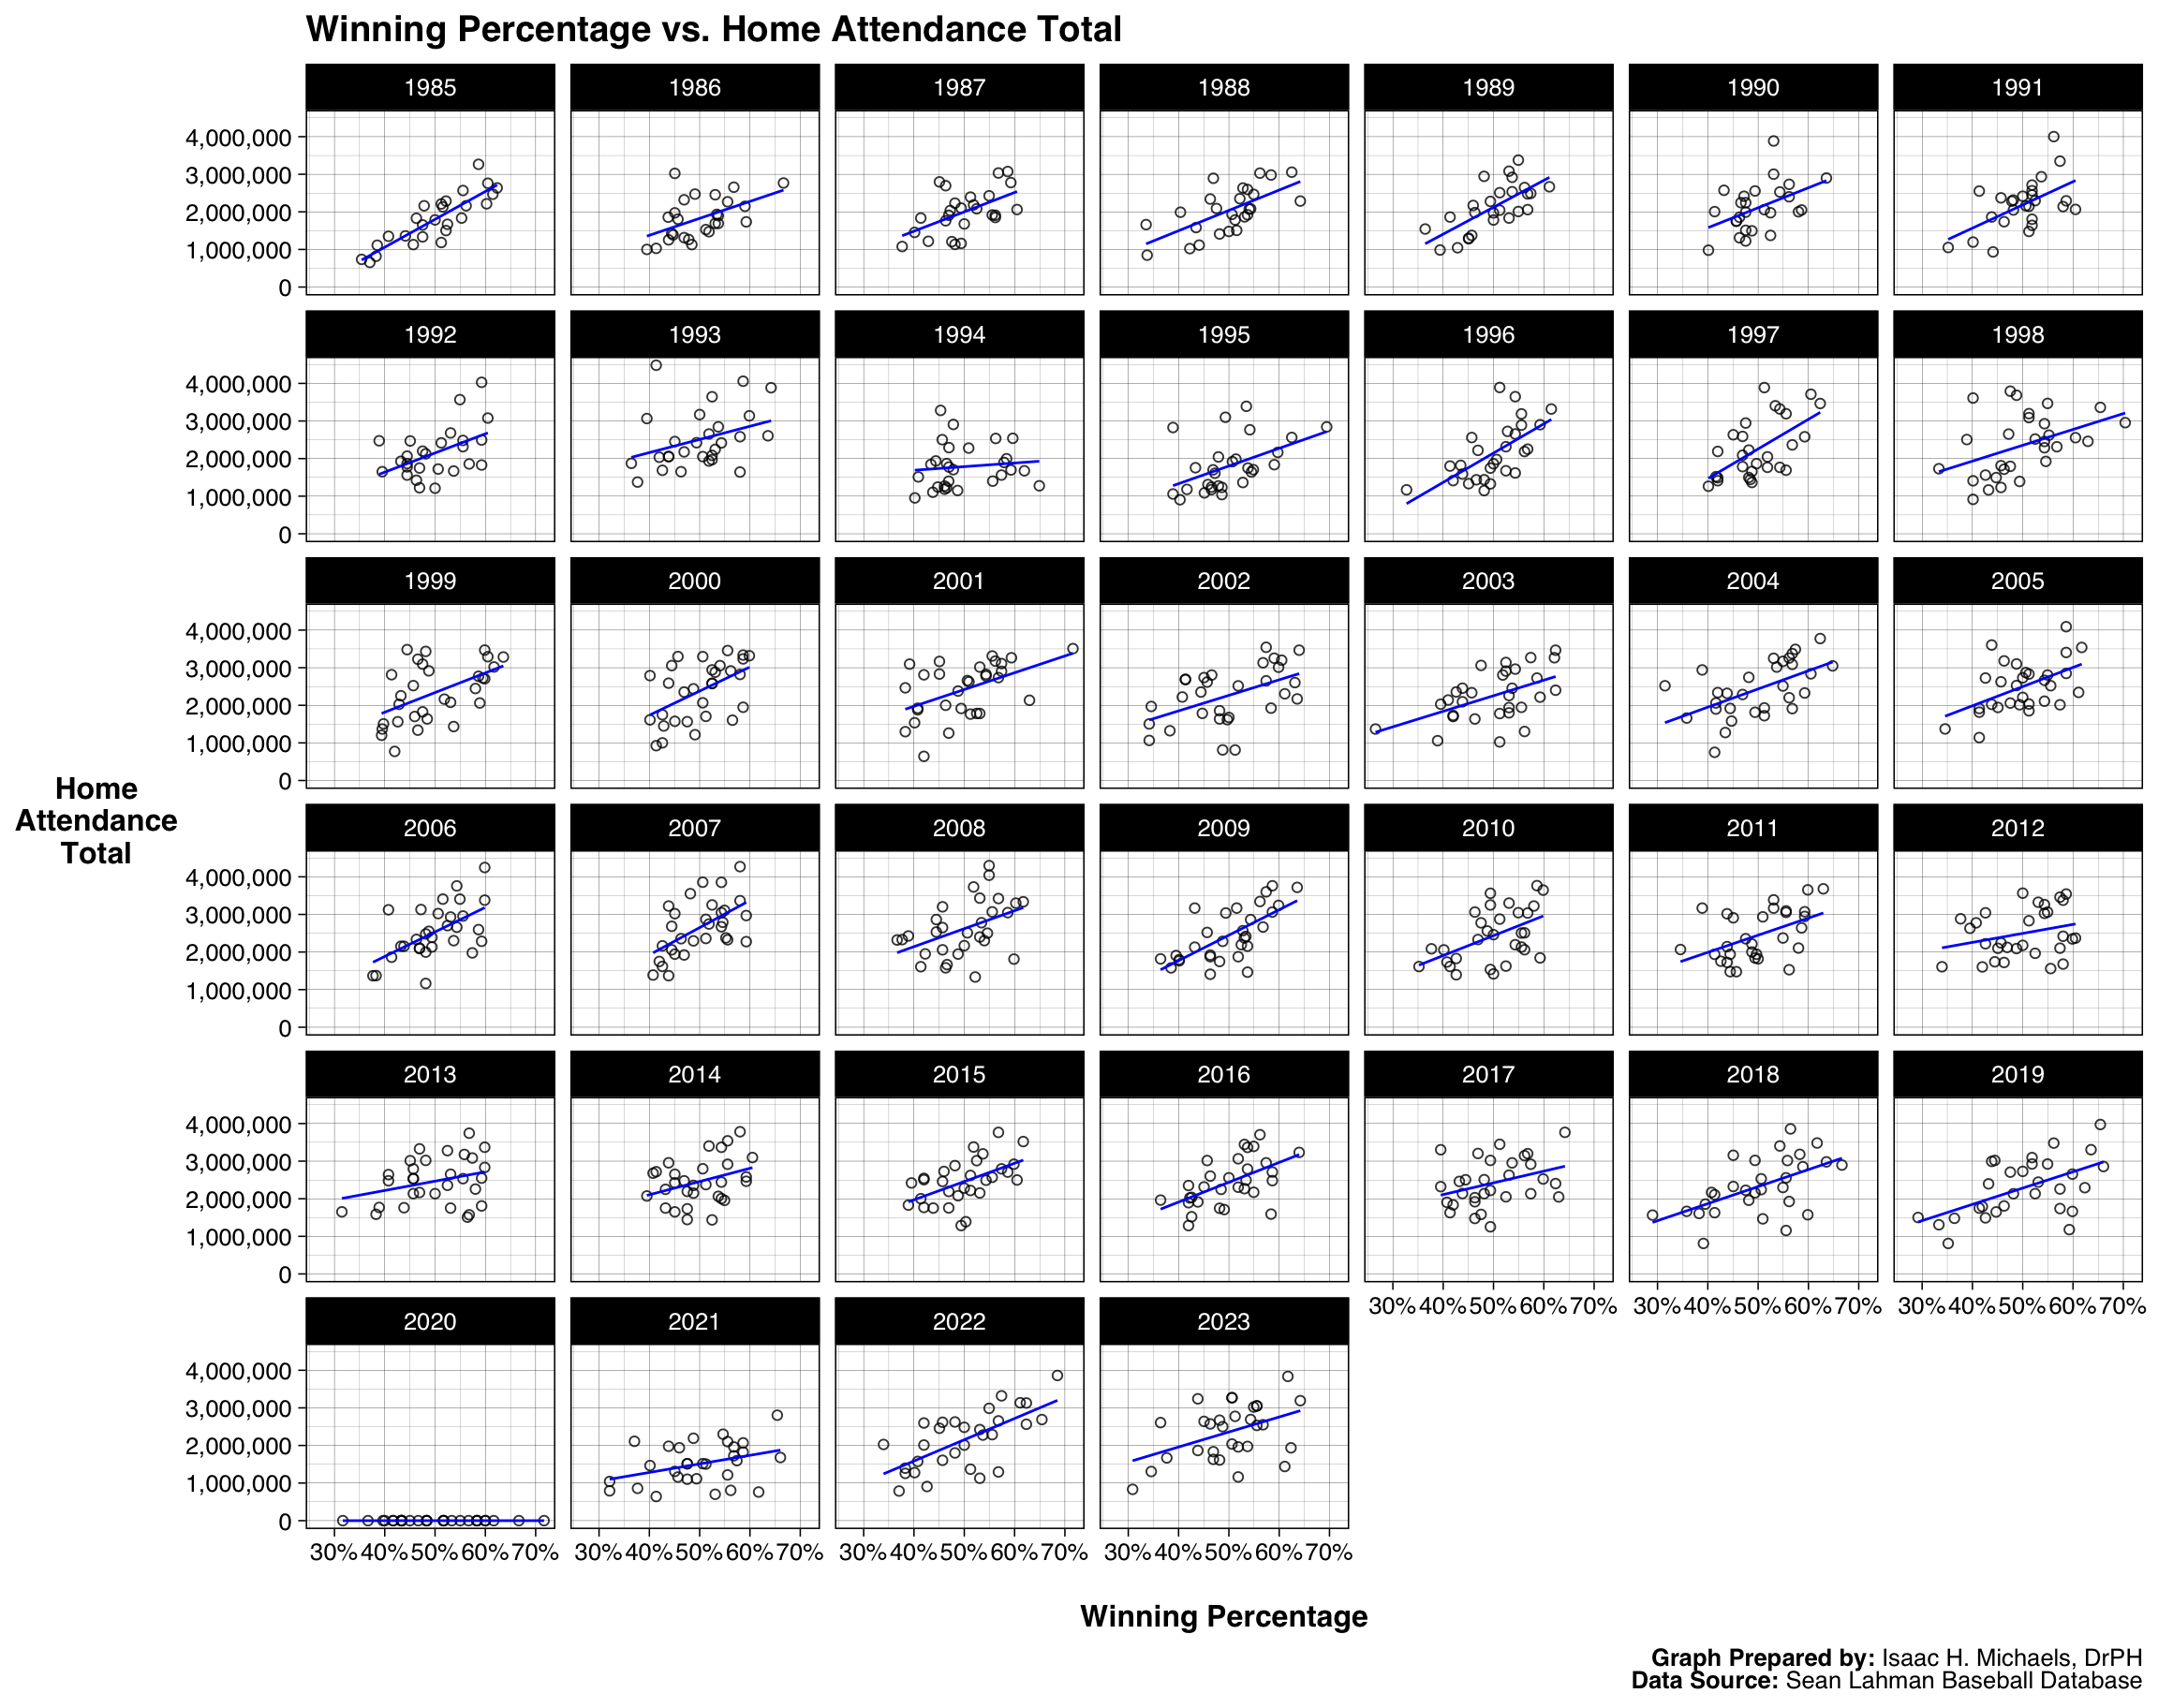 Graph Prepared By: Isaac H. Michaels, MPH
Data Source: Sean Lahman Baseball Database