Published: August 5, 2020
Updated: July 27, 2026 at 08:33PM
Welcome
Welcome to this comprehensive overview of hate crime data for New York City and New York State. This page presents key indicators of reported bias-motivated incidents, drawn from official datasets produced by the New York City Police Department (NYPD) and the New York State Division of Criminal Justice Services (DCJS). Whether you are a policymaker, public-health practitioner, community partner or concerned citizen, the intent is to provide clear, accessible information on how hate crime is measured, distributed and classified across jurisdictions.
Data Overview
The datasets presented here include monthly counts of confirmed hate-crime incidents in New York City and annual or multi-year counts of incidents by county, type, bias motive and other categories in New York State. The NYPD dataset offers detailed incident-level data for the city (including bias motive and legal classification) and is publicly available on NYC Open Data. The state dataset compiled by DCJS provides county-level counts and bias-type breakdowns for incidents reported by law enforcement agencies across the state. Both sources are grounded in law-enforcement reporting systems, and the definitions, classification rules and coverage differ accordingly; users should refer to the original data documentation for full technical details.
How to Use These Data
Use these data to identify the scale and structure of recorded bias-motivated incidents, to compare across jurisdictions and bias categories, and to inform programmatic or policy responses. For example, you can compare the number of incidents by bias motive, map incident counts or rates by geography, or examine outcomes such as arrests by category. The outputs on this page—tables, maps and charts—are designed to support decision-making: for instance, assessing resource allocation, designing outreach and prevention activities, or monitoring trends of interest. While the visualizations display data over time and across categories, remember to interpret them in context—especially given variations in reporting, classification and data completeness.
Why Are These Data Important?
Hate crimes strike at the core of community safety, inclusion and trust in institutions. Data on hate crimes help public-health officials, law-enforcement agencies and community partners to identify populations and places at elevated risk, allocate resources to prevention and support services, and monitor the effectiveness of interventions or policy changes. Furthermore, because bias-motivated incidents may affect mental-health outcomes, community cohesion and perceptions of safety, these data provide a valuable link to broader public-health objectives. In short, accurate and accessible hate-crime data form a foundation for targeted action and accountability.
What Do These Data Show?
The data show how many incidents have been reported and classified as hate crimes by bias motive, offense type or geographic unit, as well as measures of incident rate (where population data allow). They reveal how law-enforcement agencies record and publish bias-motivated incident data—allowing comparisons between the city and state, across bias categories and over time. The maps, tables and trend charts enable identification of where incidents are concentrated, how they are classified, and how outcomes such as arrests vary by category or location.
What Do These Data Not Show?
These data do not capture all hate-motivated wrongdoing: they reflect only incidents that law-enforcement agencies have classified and reported as hate crimes. Differences in reporting, classification, investigation and community willingness to report mean that the numbers are likely an under-count of all bias-motivated harm. The data also do not provide comprehensive details on victim or offender demographics, psychological or social impact, or the broader forms of harassment or bias incidents that fall outside statutory hate-crime definitions. Users should therefore avoid interpreting these figures as a complete measure of bias-motivated harm or community sentiment.
Implications for Policy and Practice
For policymakers and public-health leaders, these data suggest several actionable directions: allocating resources to jurisdictions or bias categories with higher incident counts or rates; strengthening data-collection, reporting and classification practices to reduce under-reporting; and linking hate-crime monitoring to prevention, victim-support and community engagement strategies. Specifically, low arrest or clearance rates by bias motive may merit review of investigative capacity, while geographic “hot spots” highlighted in maps can inform deployment of community outreach or law-enforcement initiatives. Ultimately, when used responsibly, these data support evidence-based strategies to reduce bias-motivated harm, strengthen community resilience and promote safer, more inclusive environments across New York.
Executive Summary1
Date: July 27, 2026
Subject: Briefing on Hate Crime Data for New York City and New York State
This briefing provides an analysis of the most current data on reported hate crimes in New York City and New York State. According to New York City Police Department (NYPD) data, 384 hate crime incidents were reported in the first six months of 2024, representing a 13.9% increase from the 337 incidents reported during the same period in 2023. Statewide data from the New York State Division of Criminal Justice Services (DCJS) for 2024 show 989 incidents, a 6.9% decrease from the 1,063 total incidents reported in 2023. It is important to note that data from these two sources are collected separately and may not align perfectly on incident counts within New York City.
The first notable pattern is the substantially greater frequency of hate crimes motivated by anti-Jewish bias compared to all other categories. In New York City, anti-Jewish incidents accounted for 56% (216 of 384) of all reported hate crimes in the first half of 2024. This total is more than four times higher than the next most frequent category, Anti-Male Homosexual (Gay), which had 47 incidents. This pattern is consistent with statewide data for 2024, where anti-Jewish crimes (471 incidents) represent 48% of the total and are also over four times more frequent than the next highest categories, Anti-Gay Male (108 incidents) and Anti-Black (106 incidents). A substantial single-month total was also recorded in New York City in October 2023, with 112 incidents, 67 of which were classified as anti-Jewish.
A second notable pattern involves shifts among other bias motivation categories at the state level and the persistent geographic concentration of incidents. While statewide reports of anti-Black hate crimes decreased by 43% (from 186 in 2023 to 106 in 2024), reports of anti-Muslim incidents increased by 42.9% (from 35 to 50) and incidents targeting “Other Ethnicity/National Origin” rose by 22% (from 41 to 50). Geographically, hate crimes remain concentrated in New York City, which accounted for 66% (657 of 989) of all reported incidents statewide in 2024. Within the city, NYPD data show the highest incident volumes in precincts covering Midtown Manhattan, Williamsburg, and several neighborhoods in southern Brooklyn.
These data reflect only those incidents reported to and classified by law enforcement, and underreporting remains a critical consideration. Changes in public willingness to report, community outreach efforts, and internal police classification practices can influence these figures independently of the actual volume of hate crimes occurring. For example, the year-over-year increase in reported incidents in New York City may reflect a higher frequency of offenses, greater community trust leading to more reporting, or a combination of factors. The overall arrest rate for reported hate crimes in New York City was 49.2% for the first half of 2024, indicating an arrest was made in approximately half of all incidents.
Hate Crimes in New York City
Trends
Overall
This chart shows the number of reported hate-crime incidents for each month. Read the horizontal axis for the month and year and the vertical axis for the count of reported incidents in that month. Use this figure as a basic chronology to locate months of interest and to anchor deeper, disaggregated analyses elsewhere on the page. Note: the chart reports incidents recorded in official NYPD data and therefore reflects reported events rather than the total incidence of bias-motivated harm in the community.
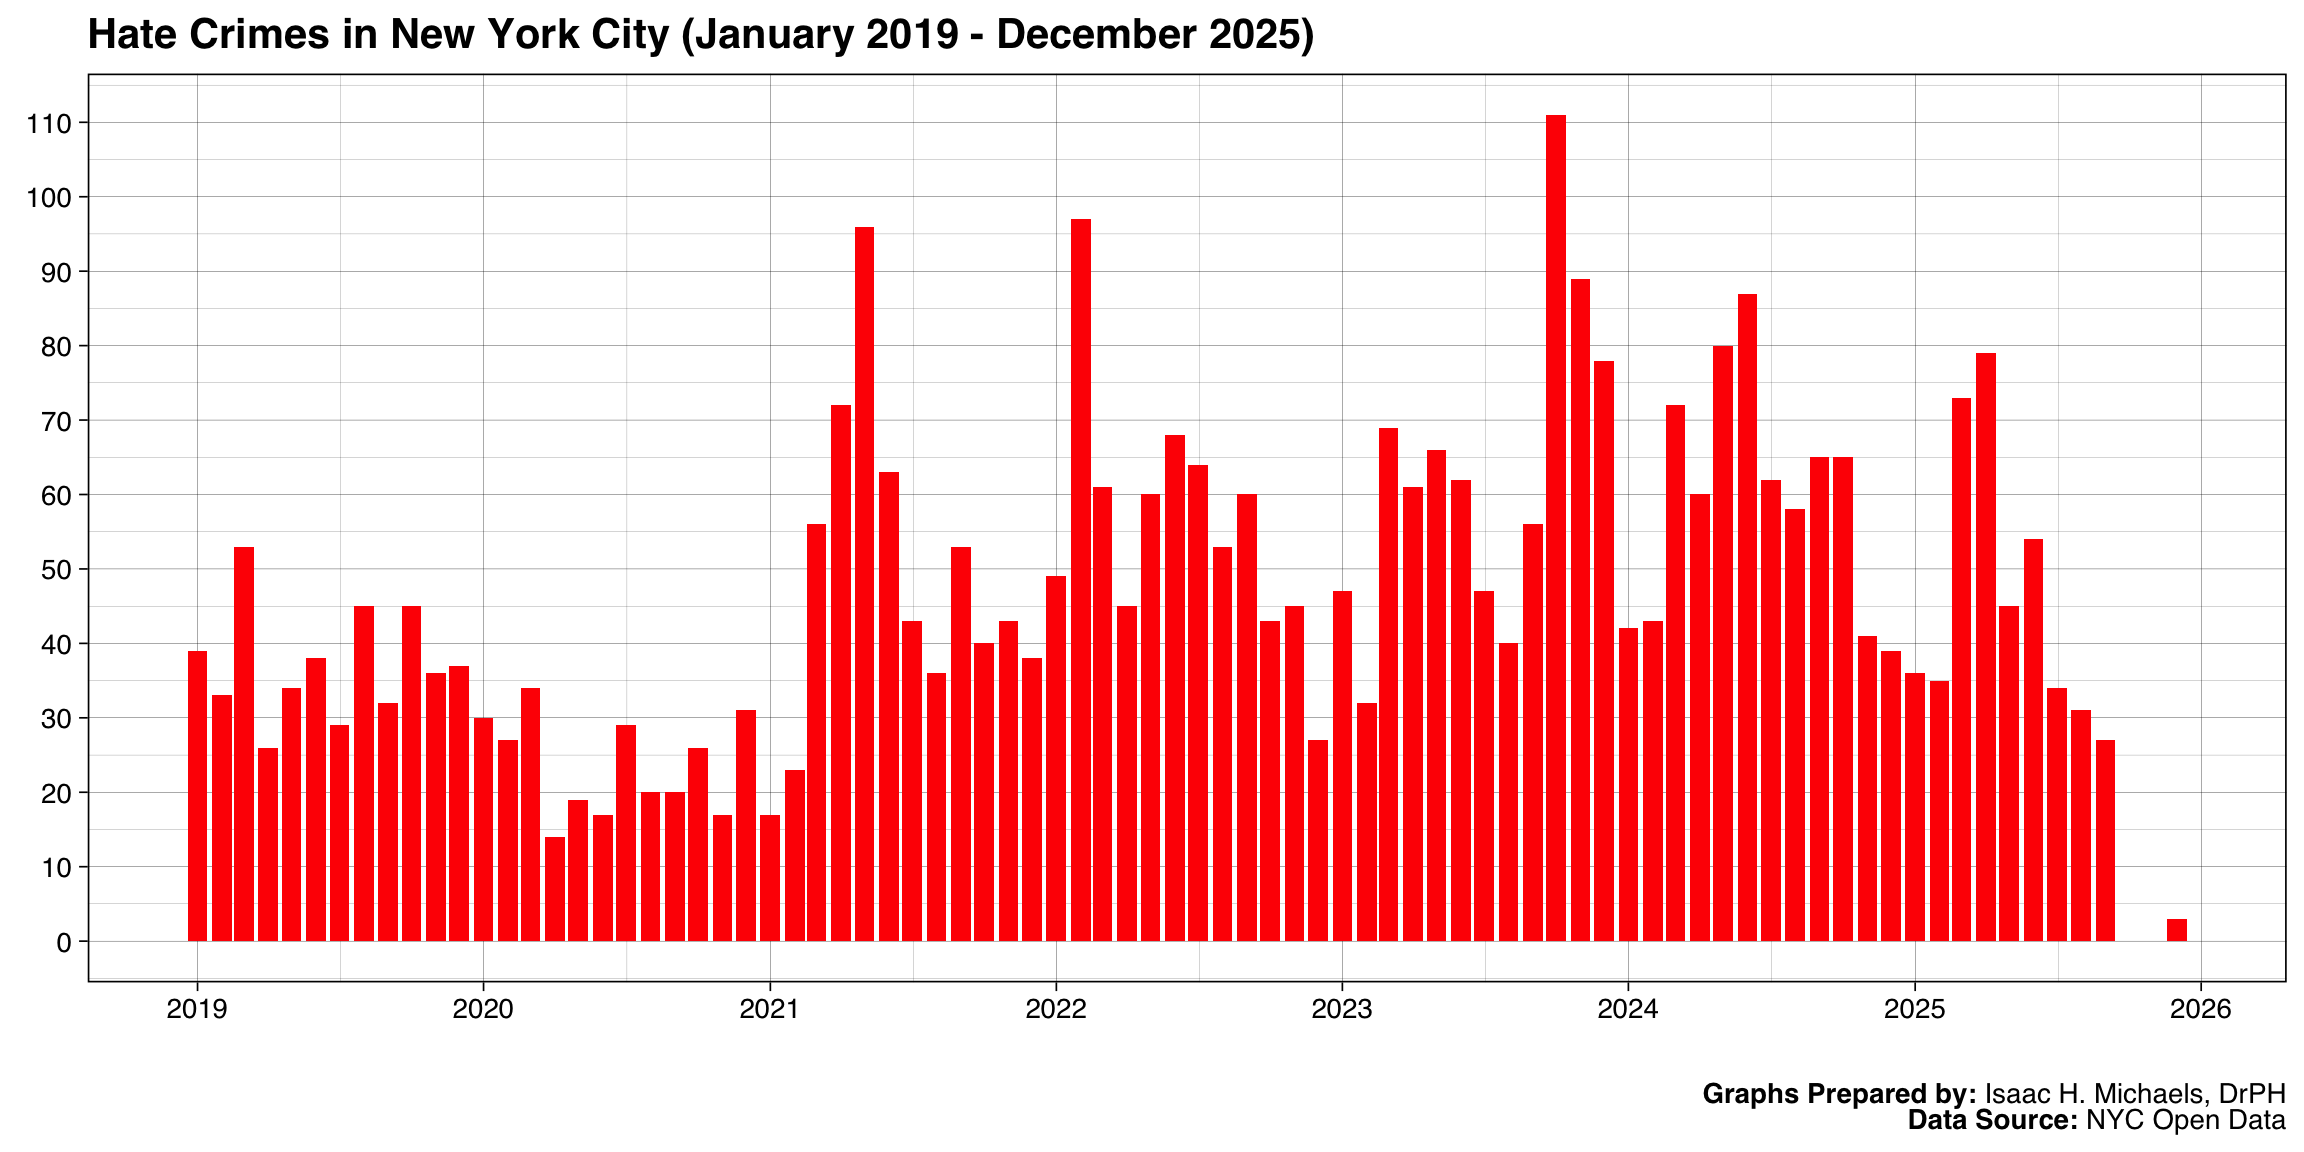
Graph Prepared By: Isaac H. Michaels, DrPH
Data Source: NYC Open Data
By Offense Category
This set of panels breaks the monthly incident counts into offense-category groups (one panel per category). Each panel shares the same time axis, so you can compare how different offense categories are represented in the recorded data across the same months. Use these panels to identify which types of offenses (for example, assault, vandalism, threats) are catalogued under each category and to guide category-specific priorities such as training, enforcement emphasis, or victim support planning. Reminder: category labels reflect how incidents were classified in the source dataset.
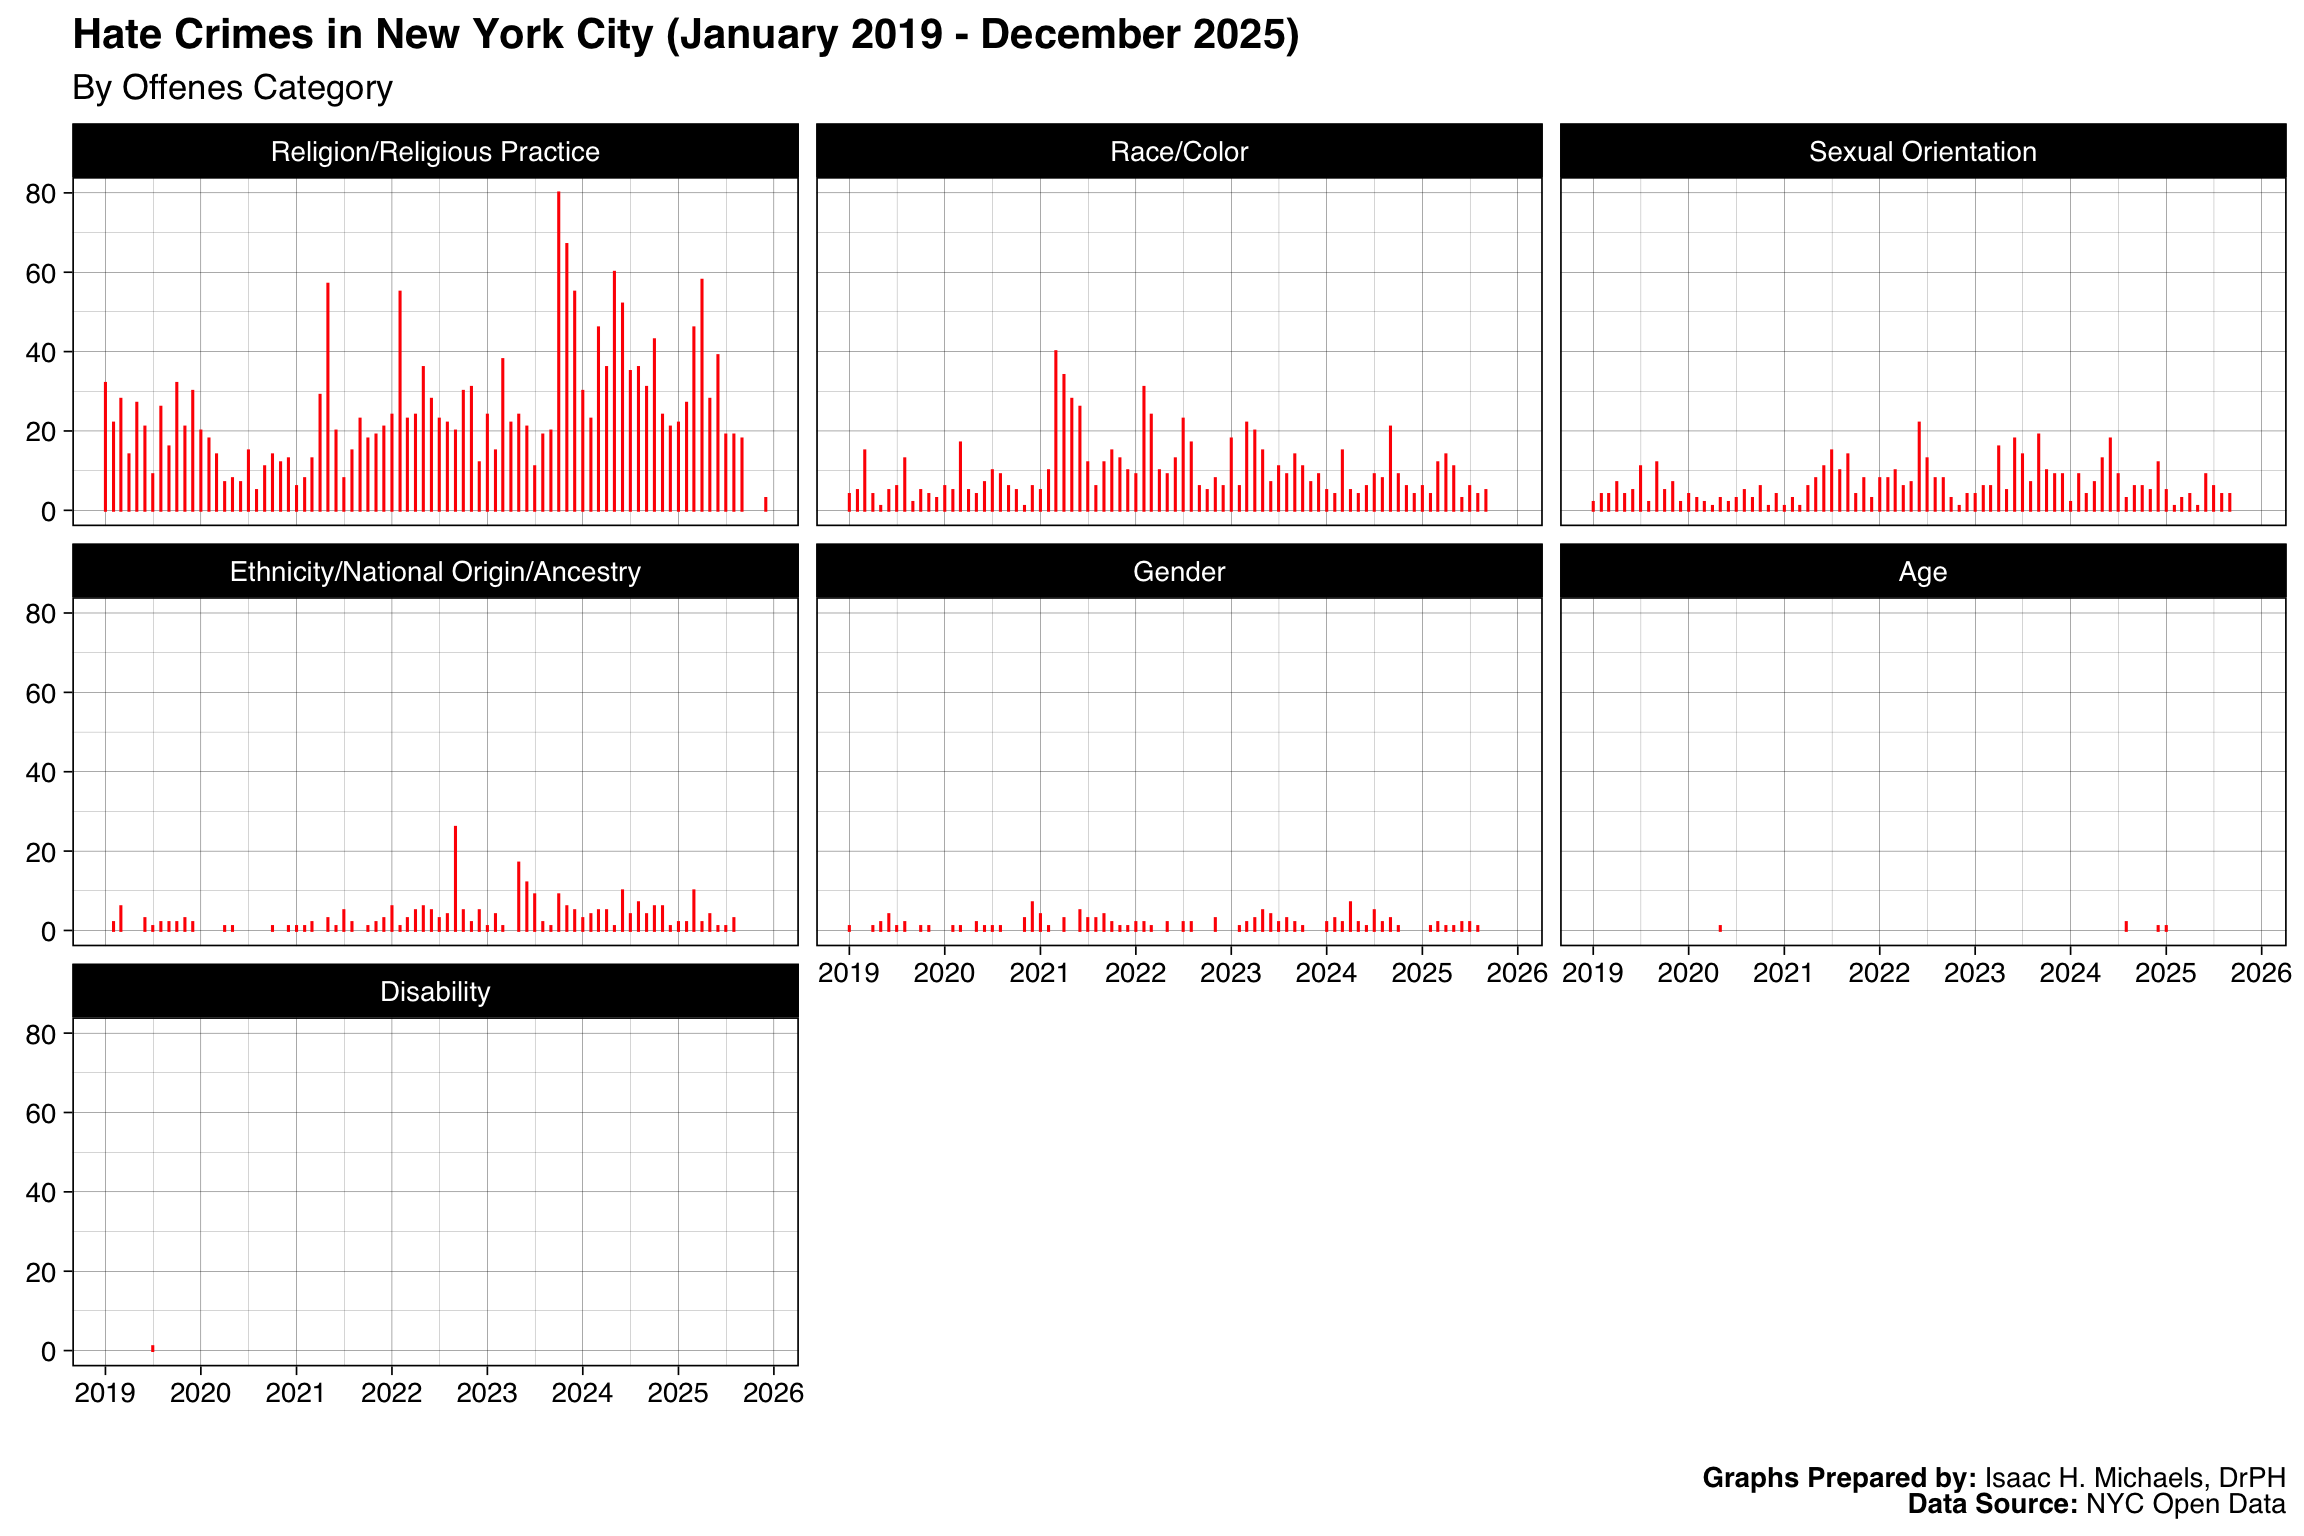
Graph Prepared By: Isaac H. Michaels, DrPH
Data Source: NYC Open Data
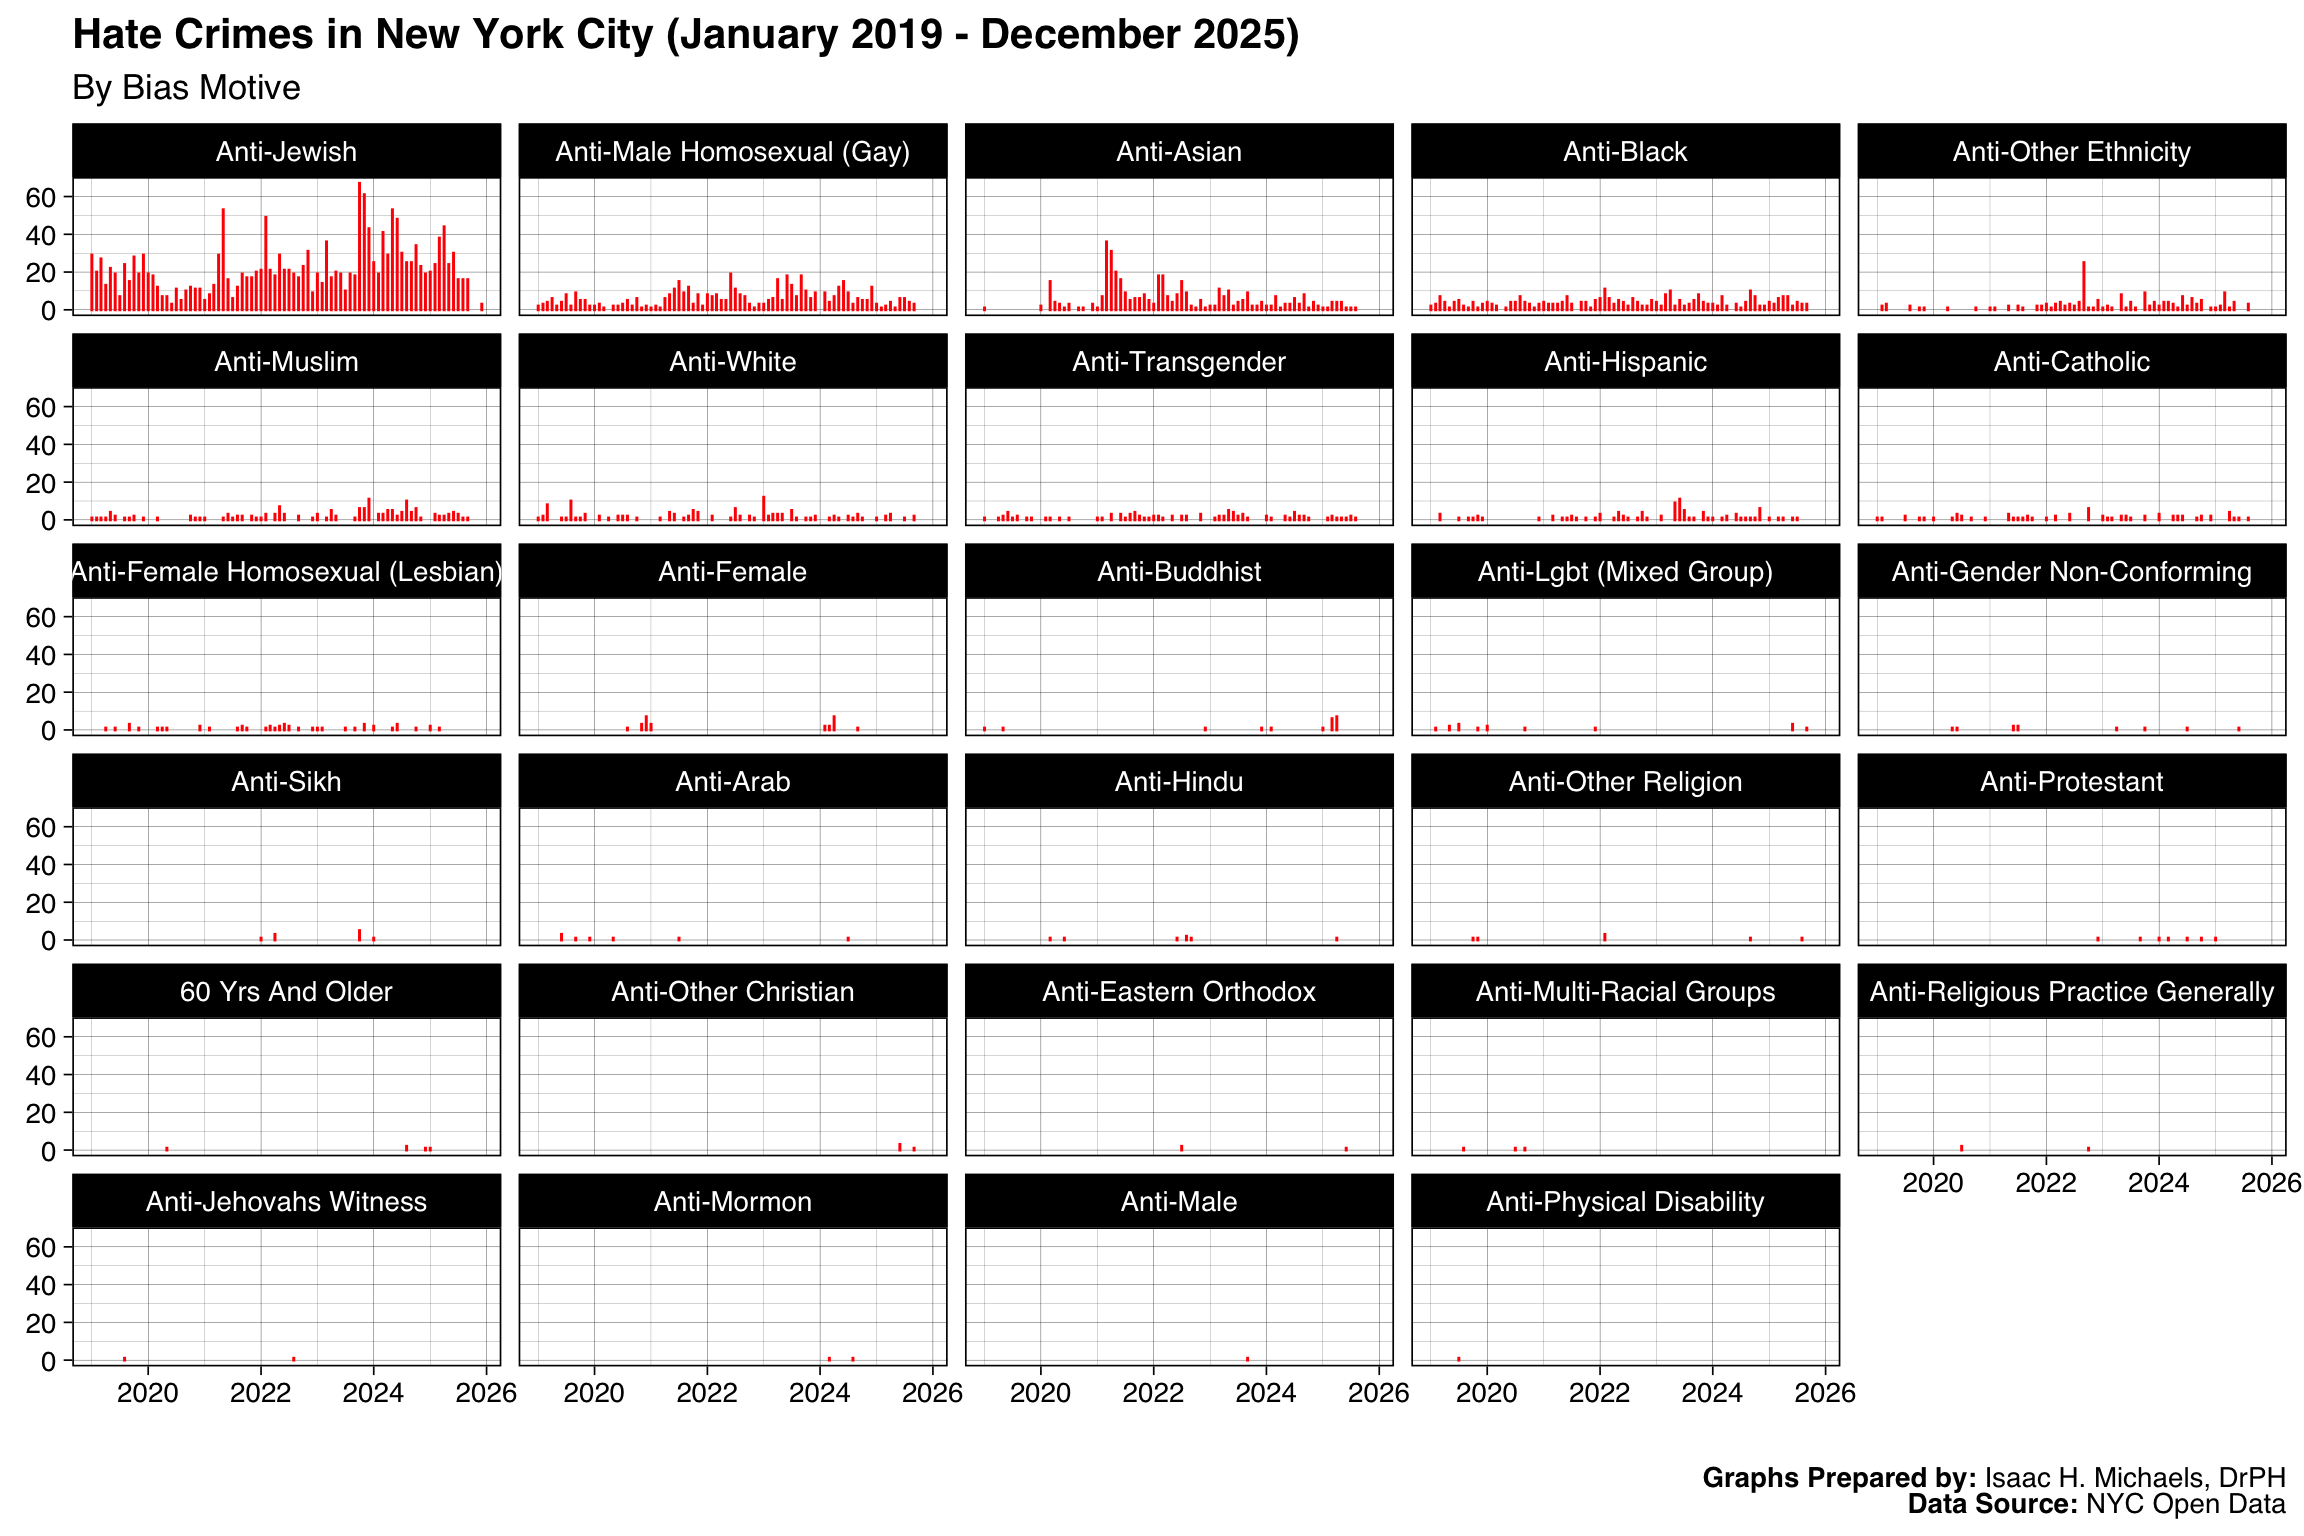
By Bias Motivation
These panels display monthly counts grouped by the reported bias motive (for example, race, religion, sexual orientation). Each panel isolates a single motive category so you can examine how motive information is recorded and compare the scale of reporting across motives within the same calendar months. This view is useful for planning targeted outreach, culturally appropriate prevention efforts, and community engagement tailored to particular affected groups. Caveat: motive assignment depends on case investigation and recording practices.
Graph Prepared By: Isaac H. Michaels, DrPH
Data Source: NYC Open Data
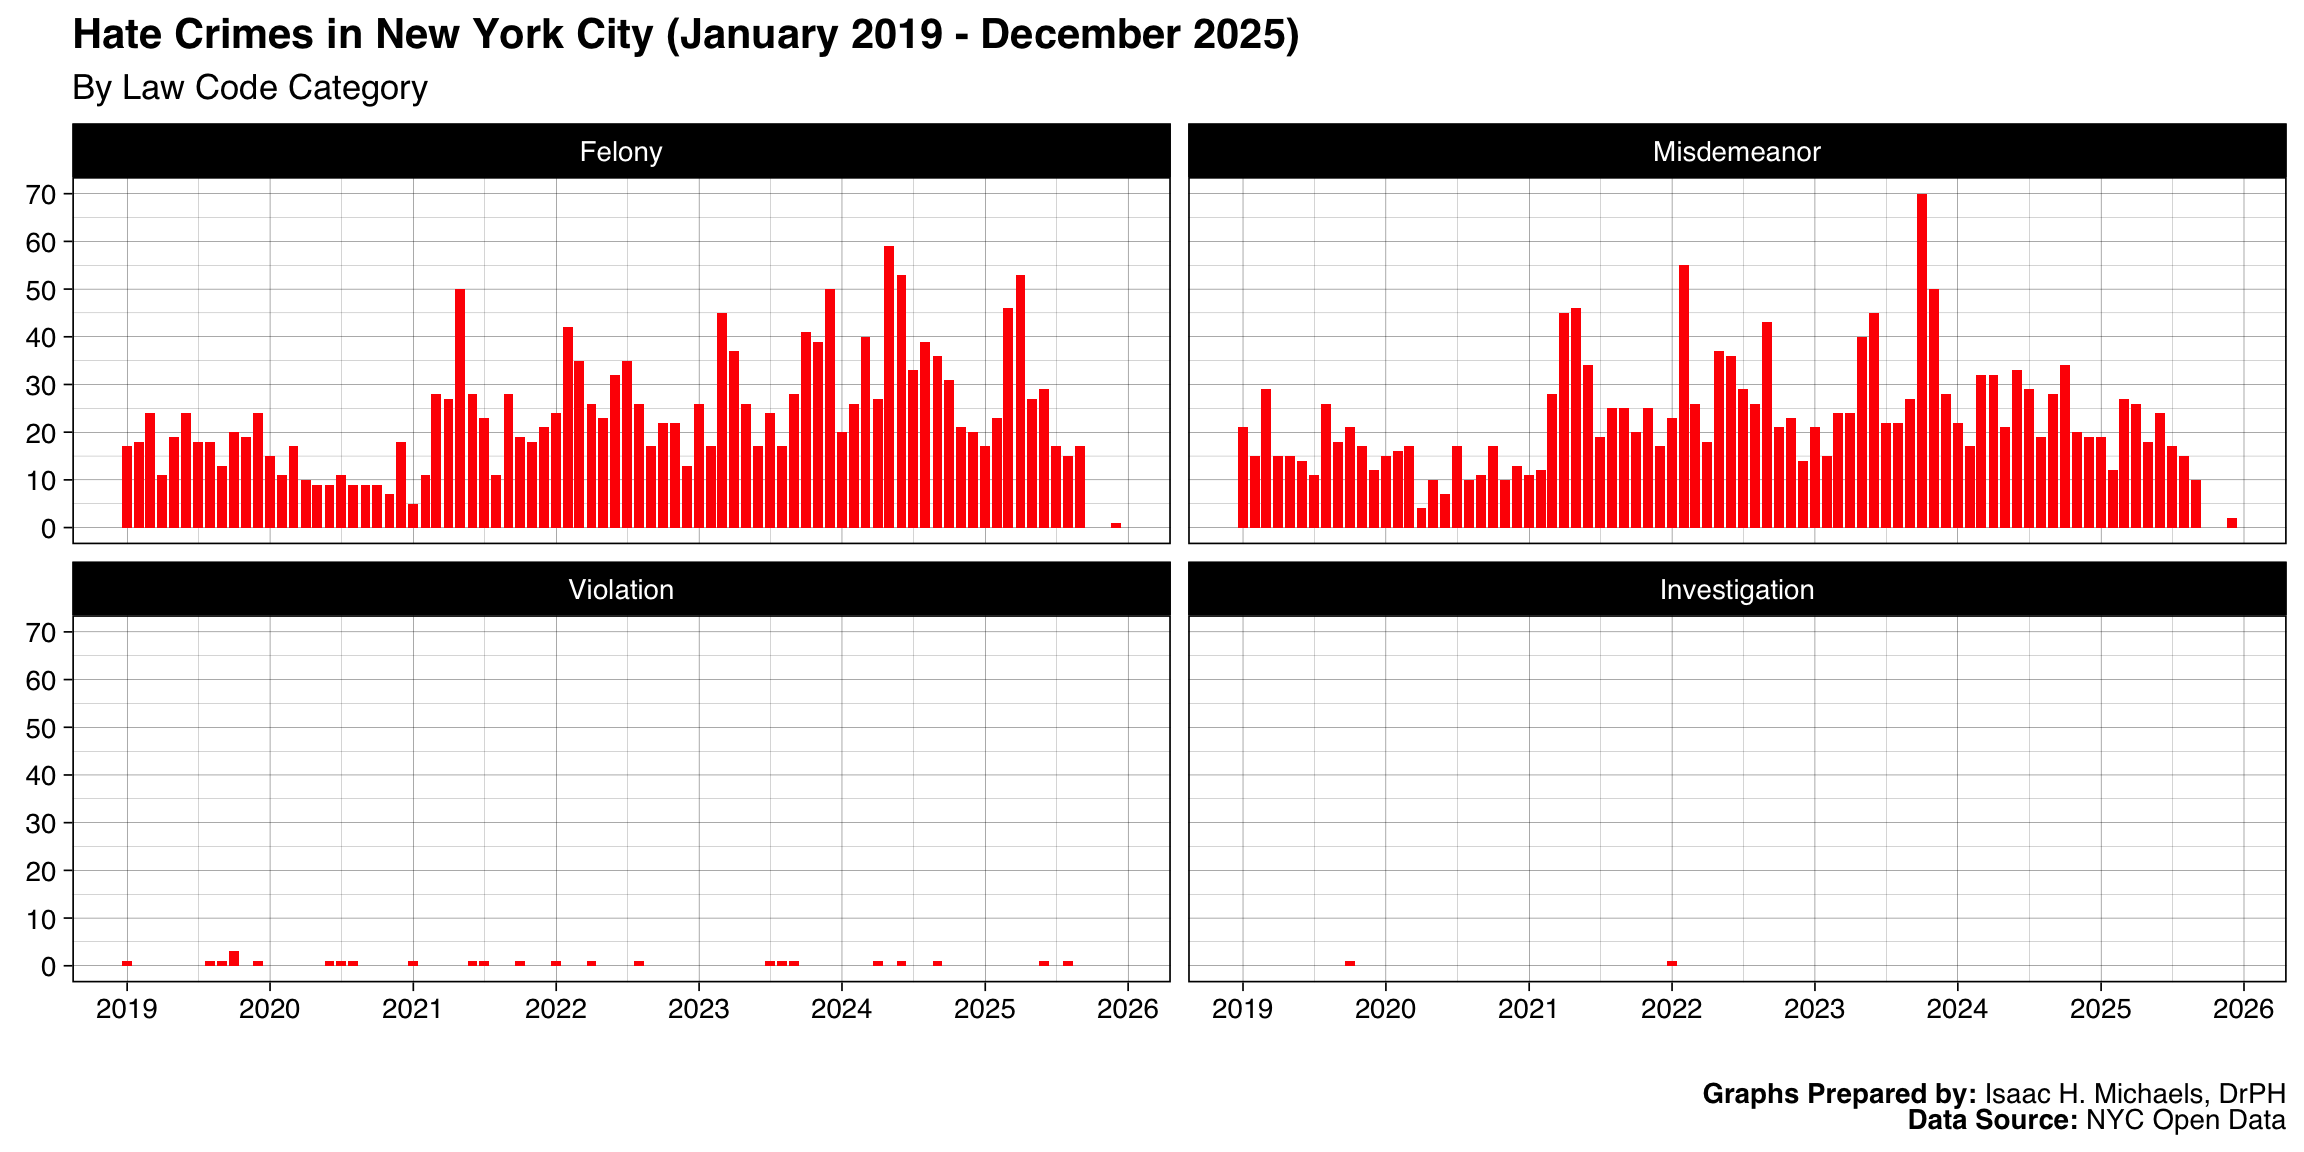
By Law Code Category
This figure groups monthly incident counts according to law-code categories used by the police (one panel per legal classification). Each panel shows how incidents are classified under statutory categories, which is helpful for legal or administrative review, resource allocation for prosecution or prevention, and understanding which statutory authorities are most frequently invoked. Keep in mind that law-code categories reflect legal classification rather than the underlying motive or harm experienced.
Graph Prepared By: Isaac H. Michaels, DrPH
Data Source: NYC Open Data
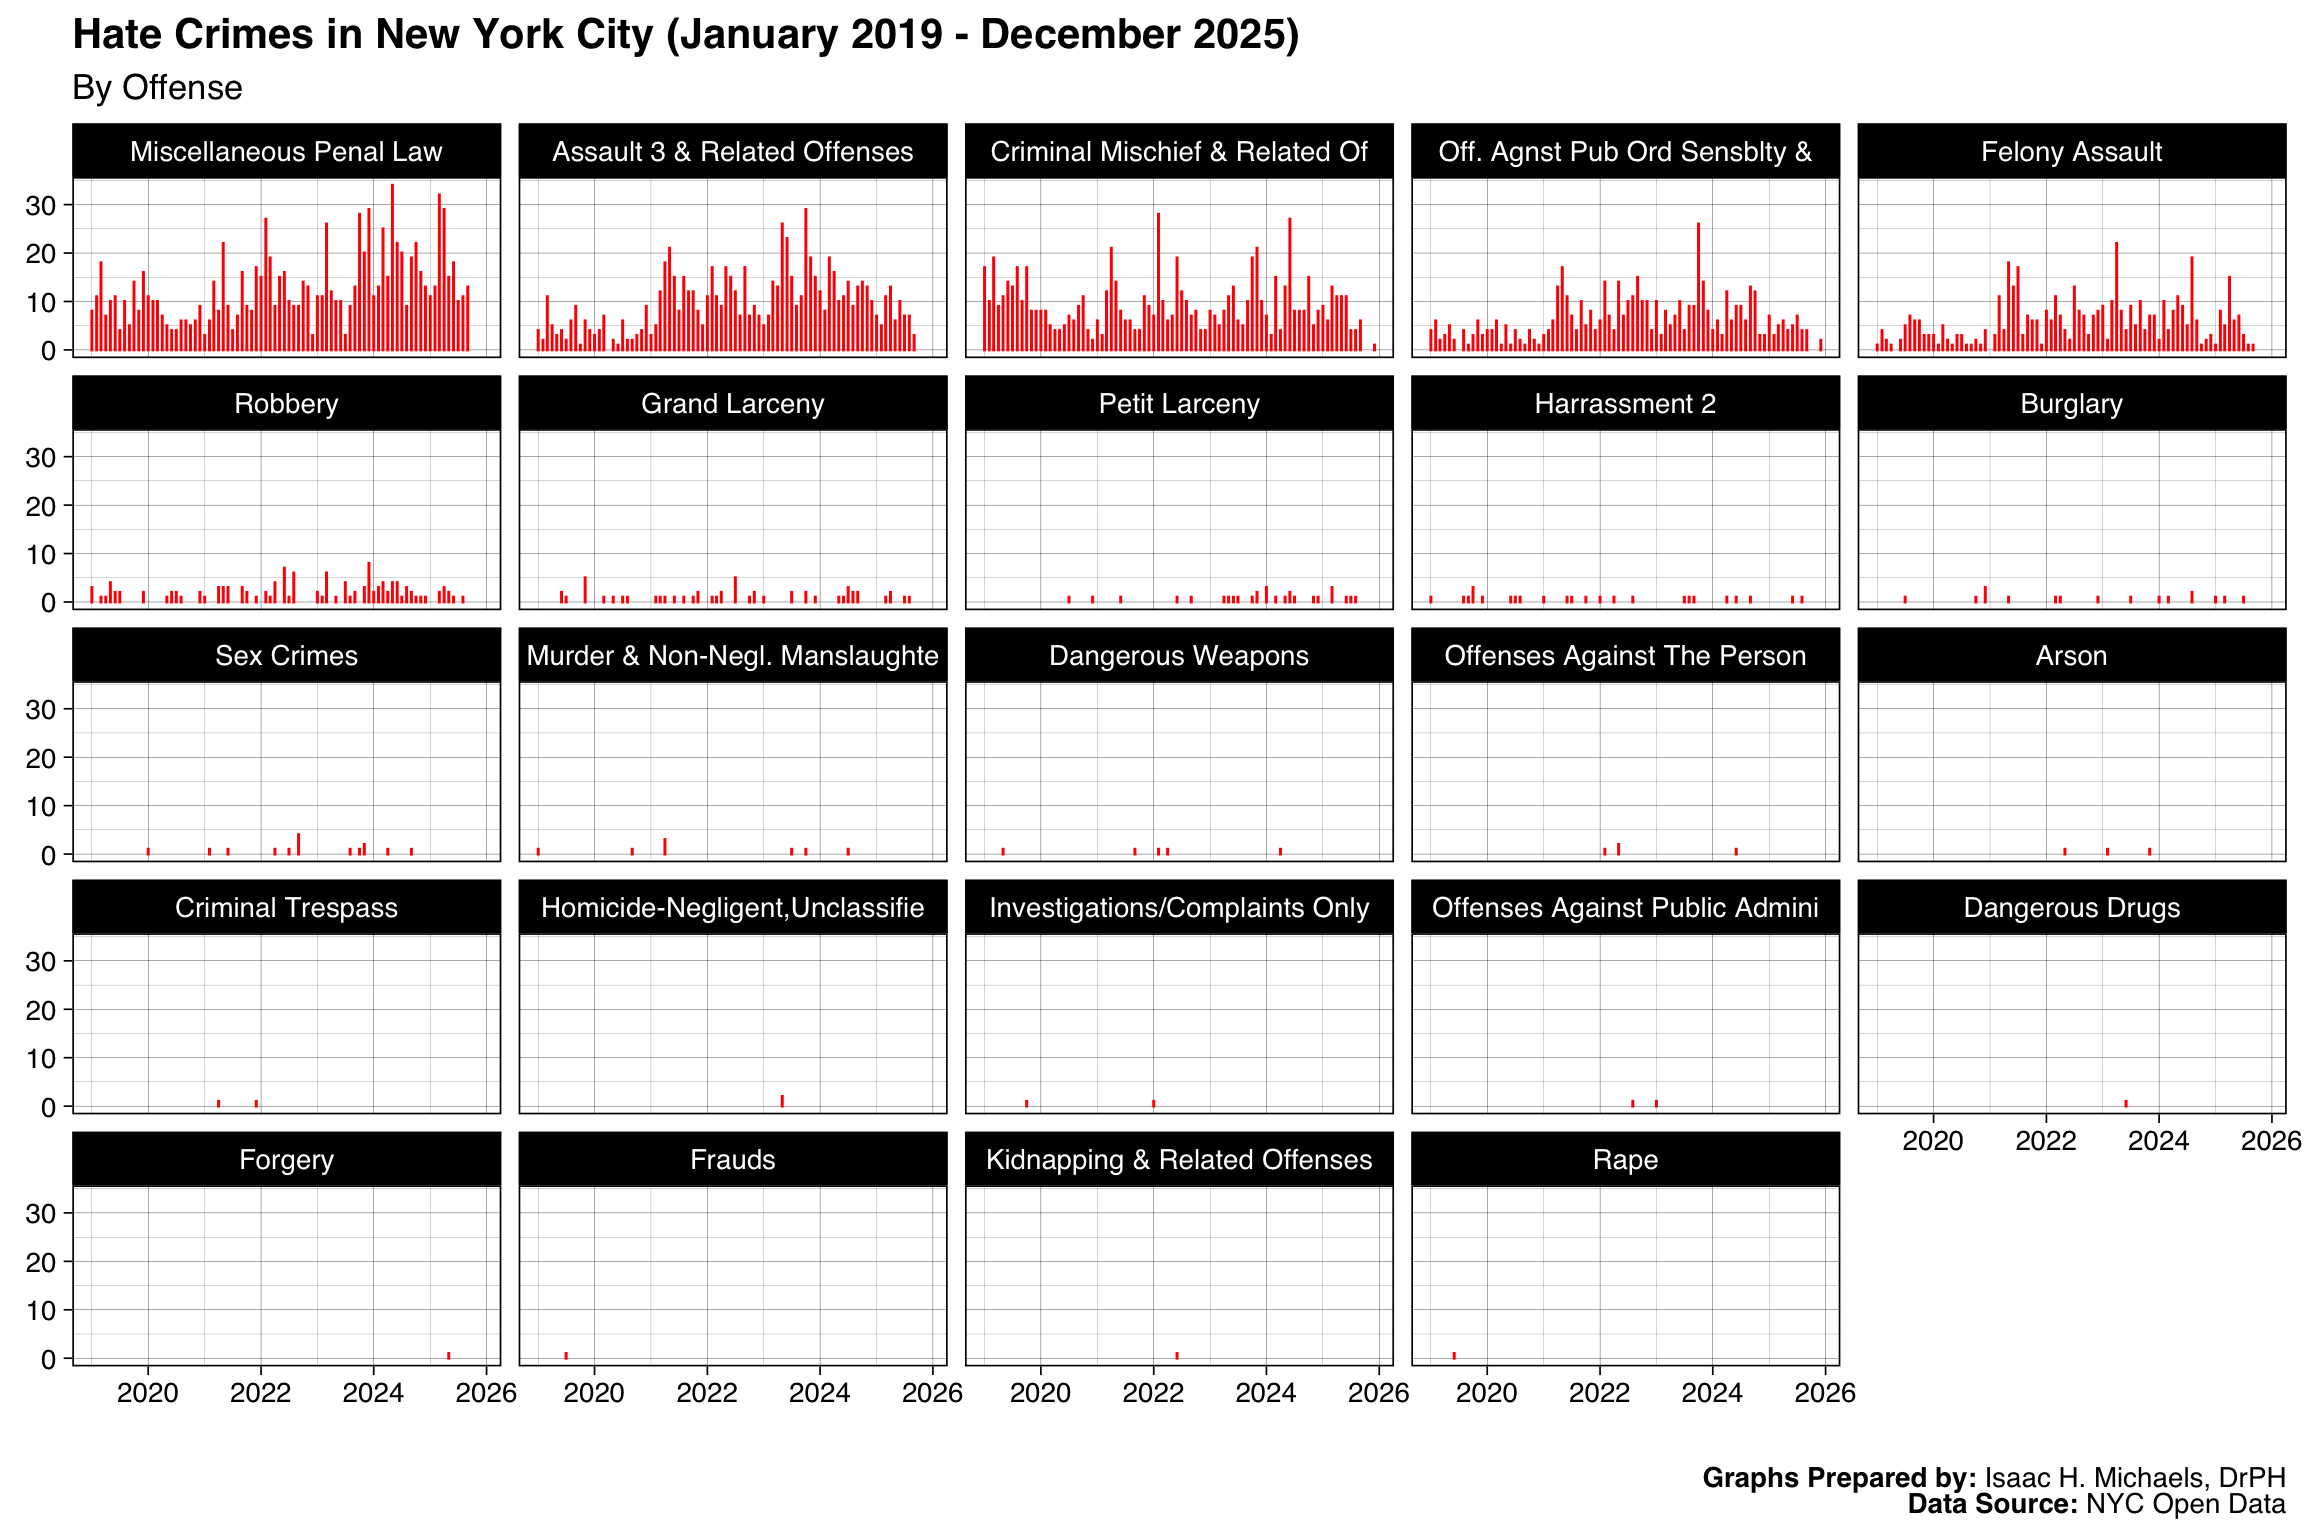
By Offense Description
These panels break out monthly counts by specific offense descriptions (for example, assault, criminal mischief). Each panel focuses on one offense description so you can inspect how that particular offense is recorded through time and compare offense types across the same months. This level of detail supports operational decisions such as which incident types may require additional field training, victim services, or community communication. Note: offense descriptions come from the reporting agency’s incident records.
Graph Prepared By: Isaac H. Michaels, DrPH
Data Source: NYC Open Data
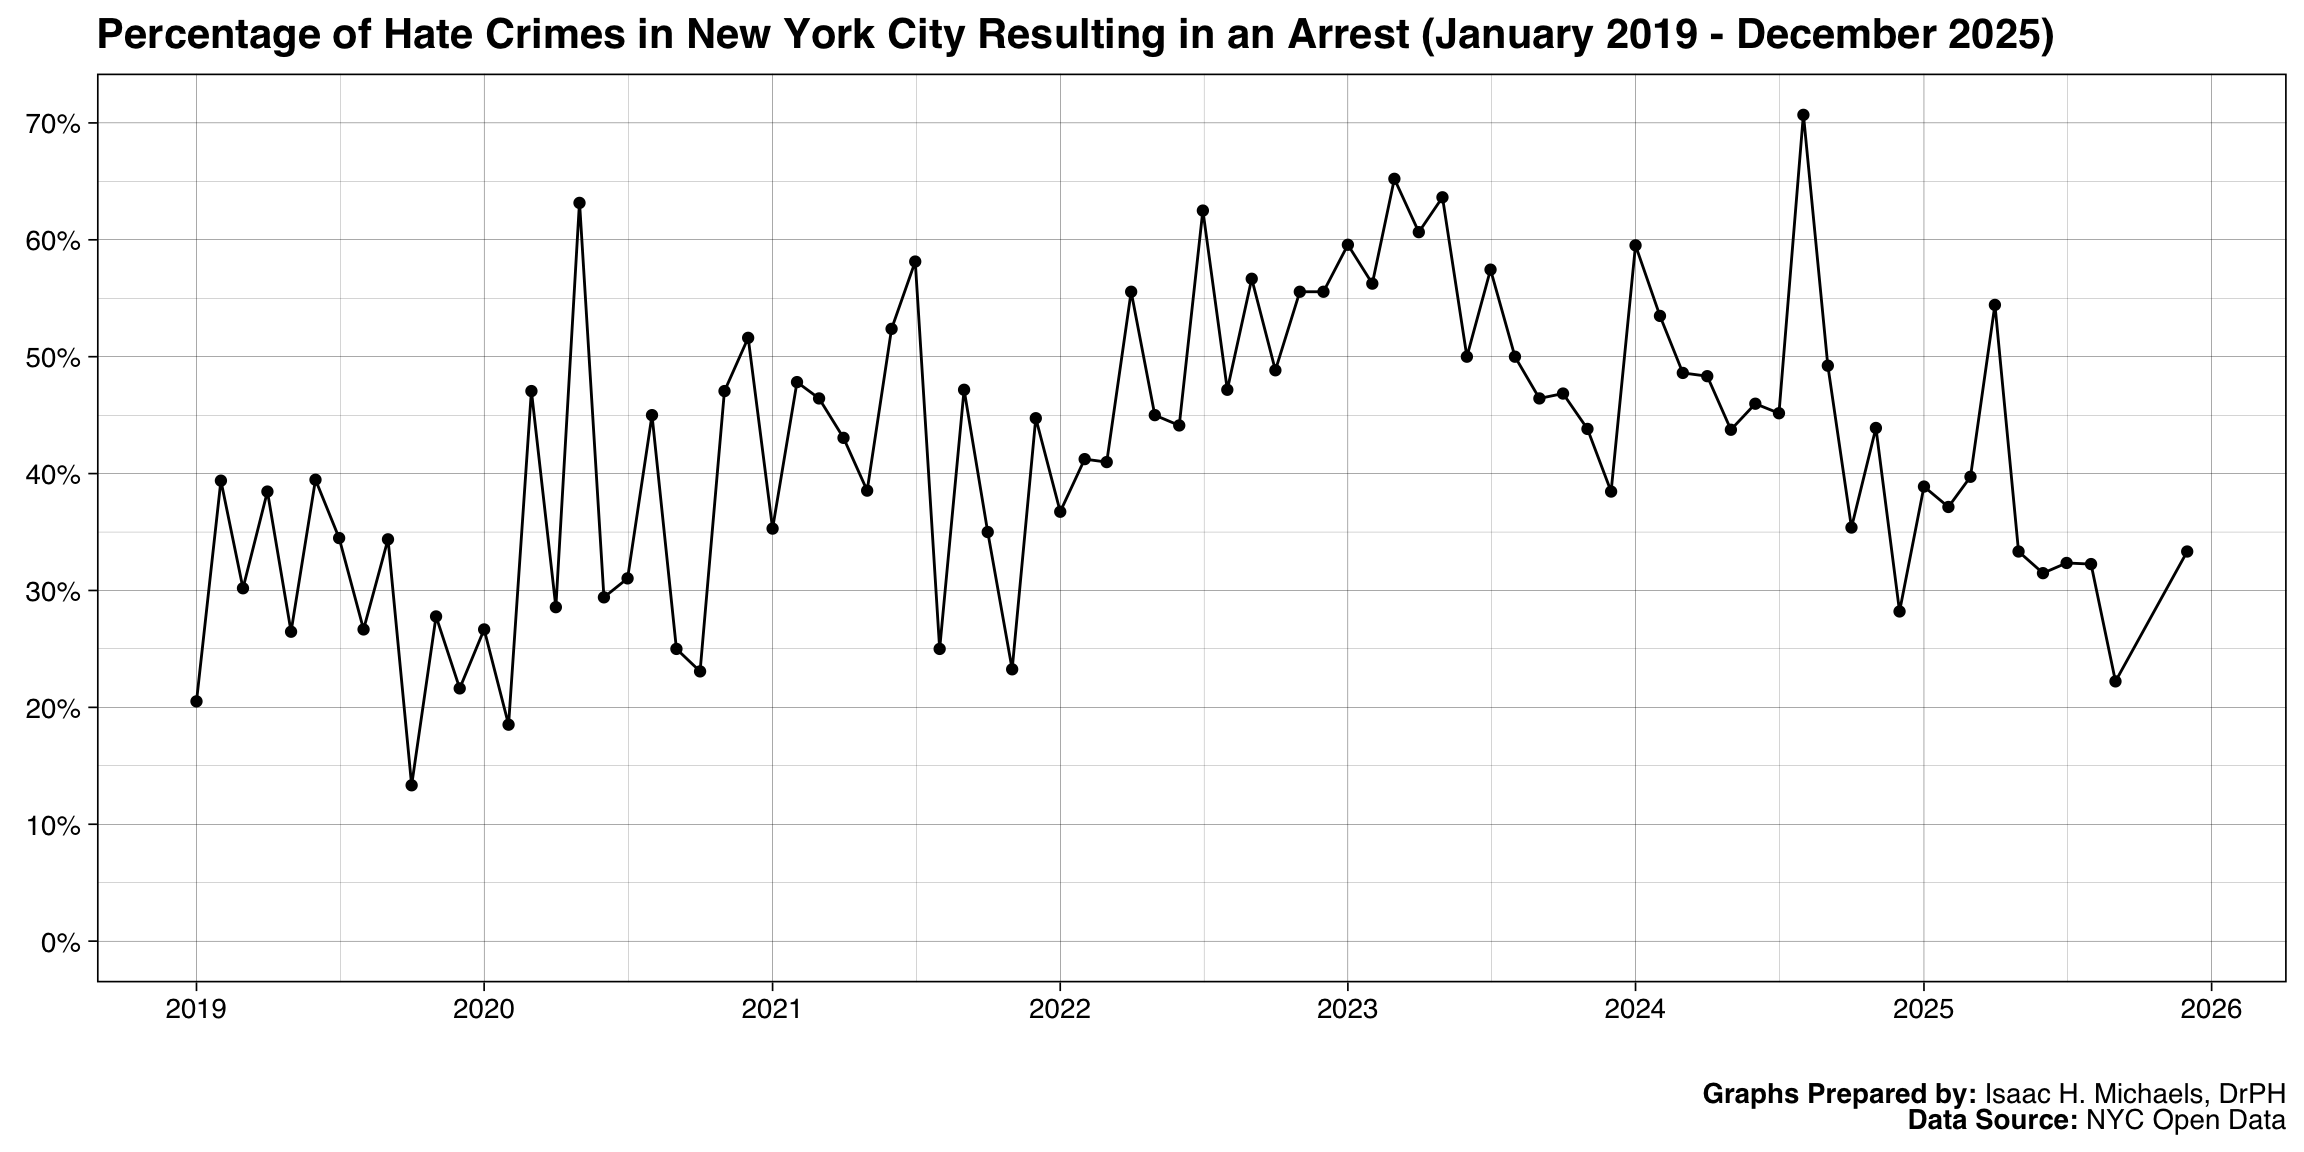
By Arrest Outcome
This figure tracks the share of reported hate-crime incidents that resulted in an arrest, by month. The line represents the proportion of cases closed by arrest out of all recorded hate-crime incidents for that month. This measure reflects enforcement activity and case outcomes recorded in NYPD data. It should be interpreted as an indicator of response and follow-up within the justice system, not as a measure of the severity or prevalence of hate crimes.
Graph Prepared By: Isaac H. Michaels, DrPH
Data Source: NYC Open Data
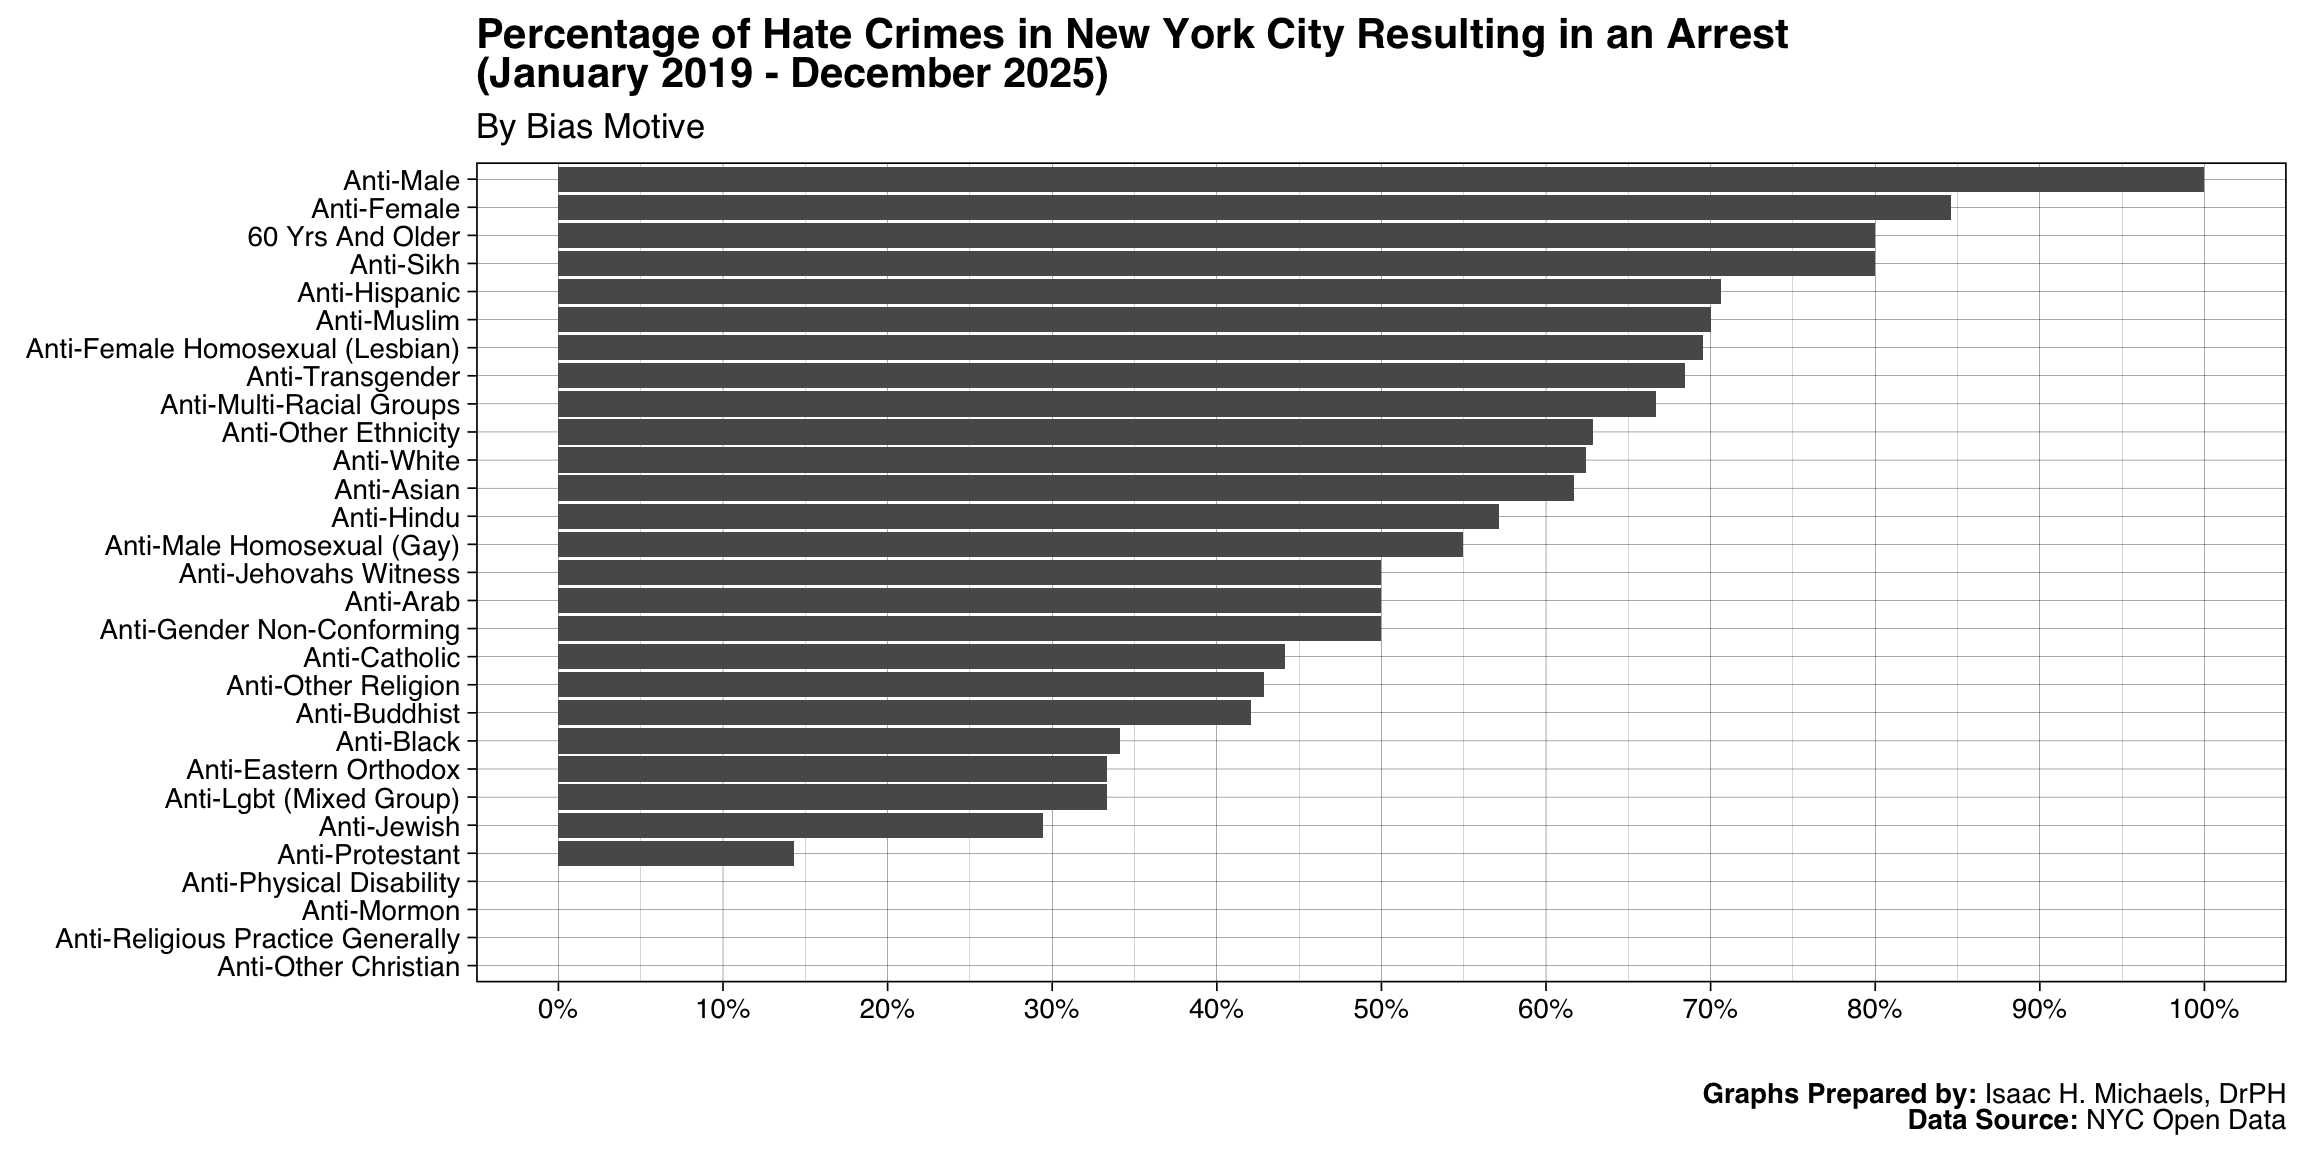
Arrest Outcomes by Bias Motivation
This bar chart compares arrest percentages across bias-motive categories. Each bar represents the proportion of recorded incidents within that motive category that led to an arrest. The figure illustrates variation in recorded outcomes by motive type, helping identify where investigative or prosecutorial follow-through differs across cases. Differences may reflect case characteristics, reporting patterns, or investigative complexities rather than enforcement priorities alone.
Graph Prepared By: Isaac H. Michaels, DrPH
Data Source: NYC Open Data
Spatial Distribution
Overall
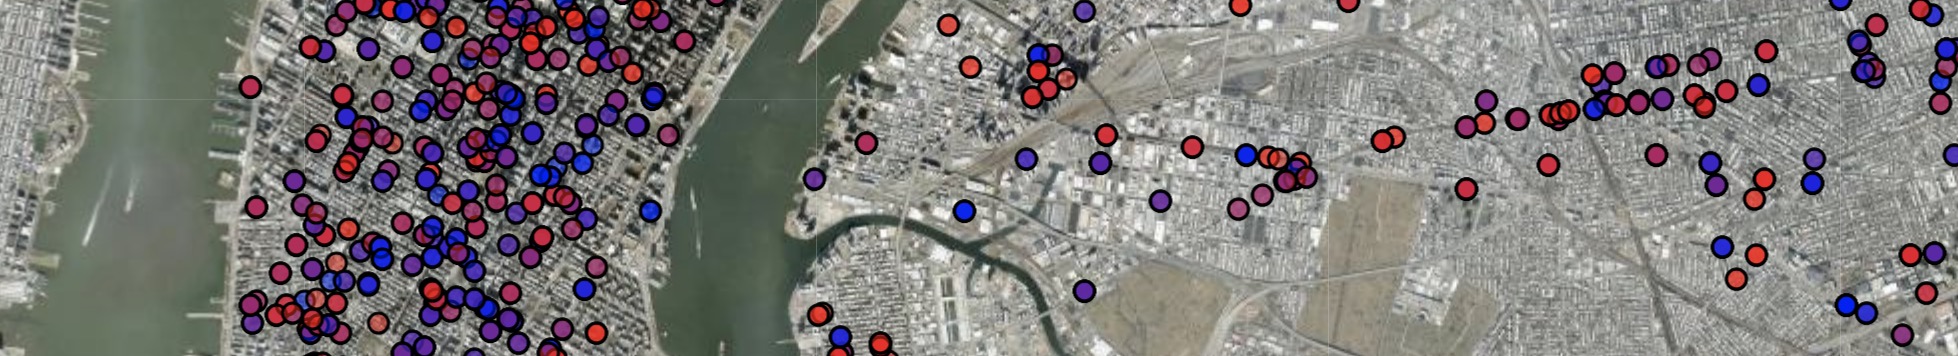
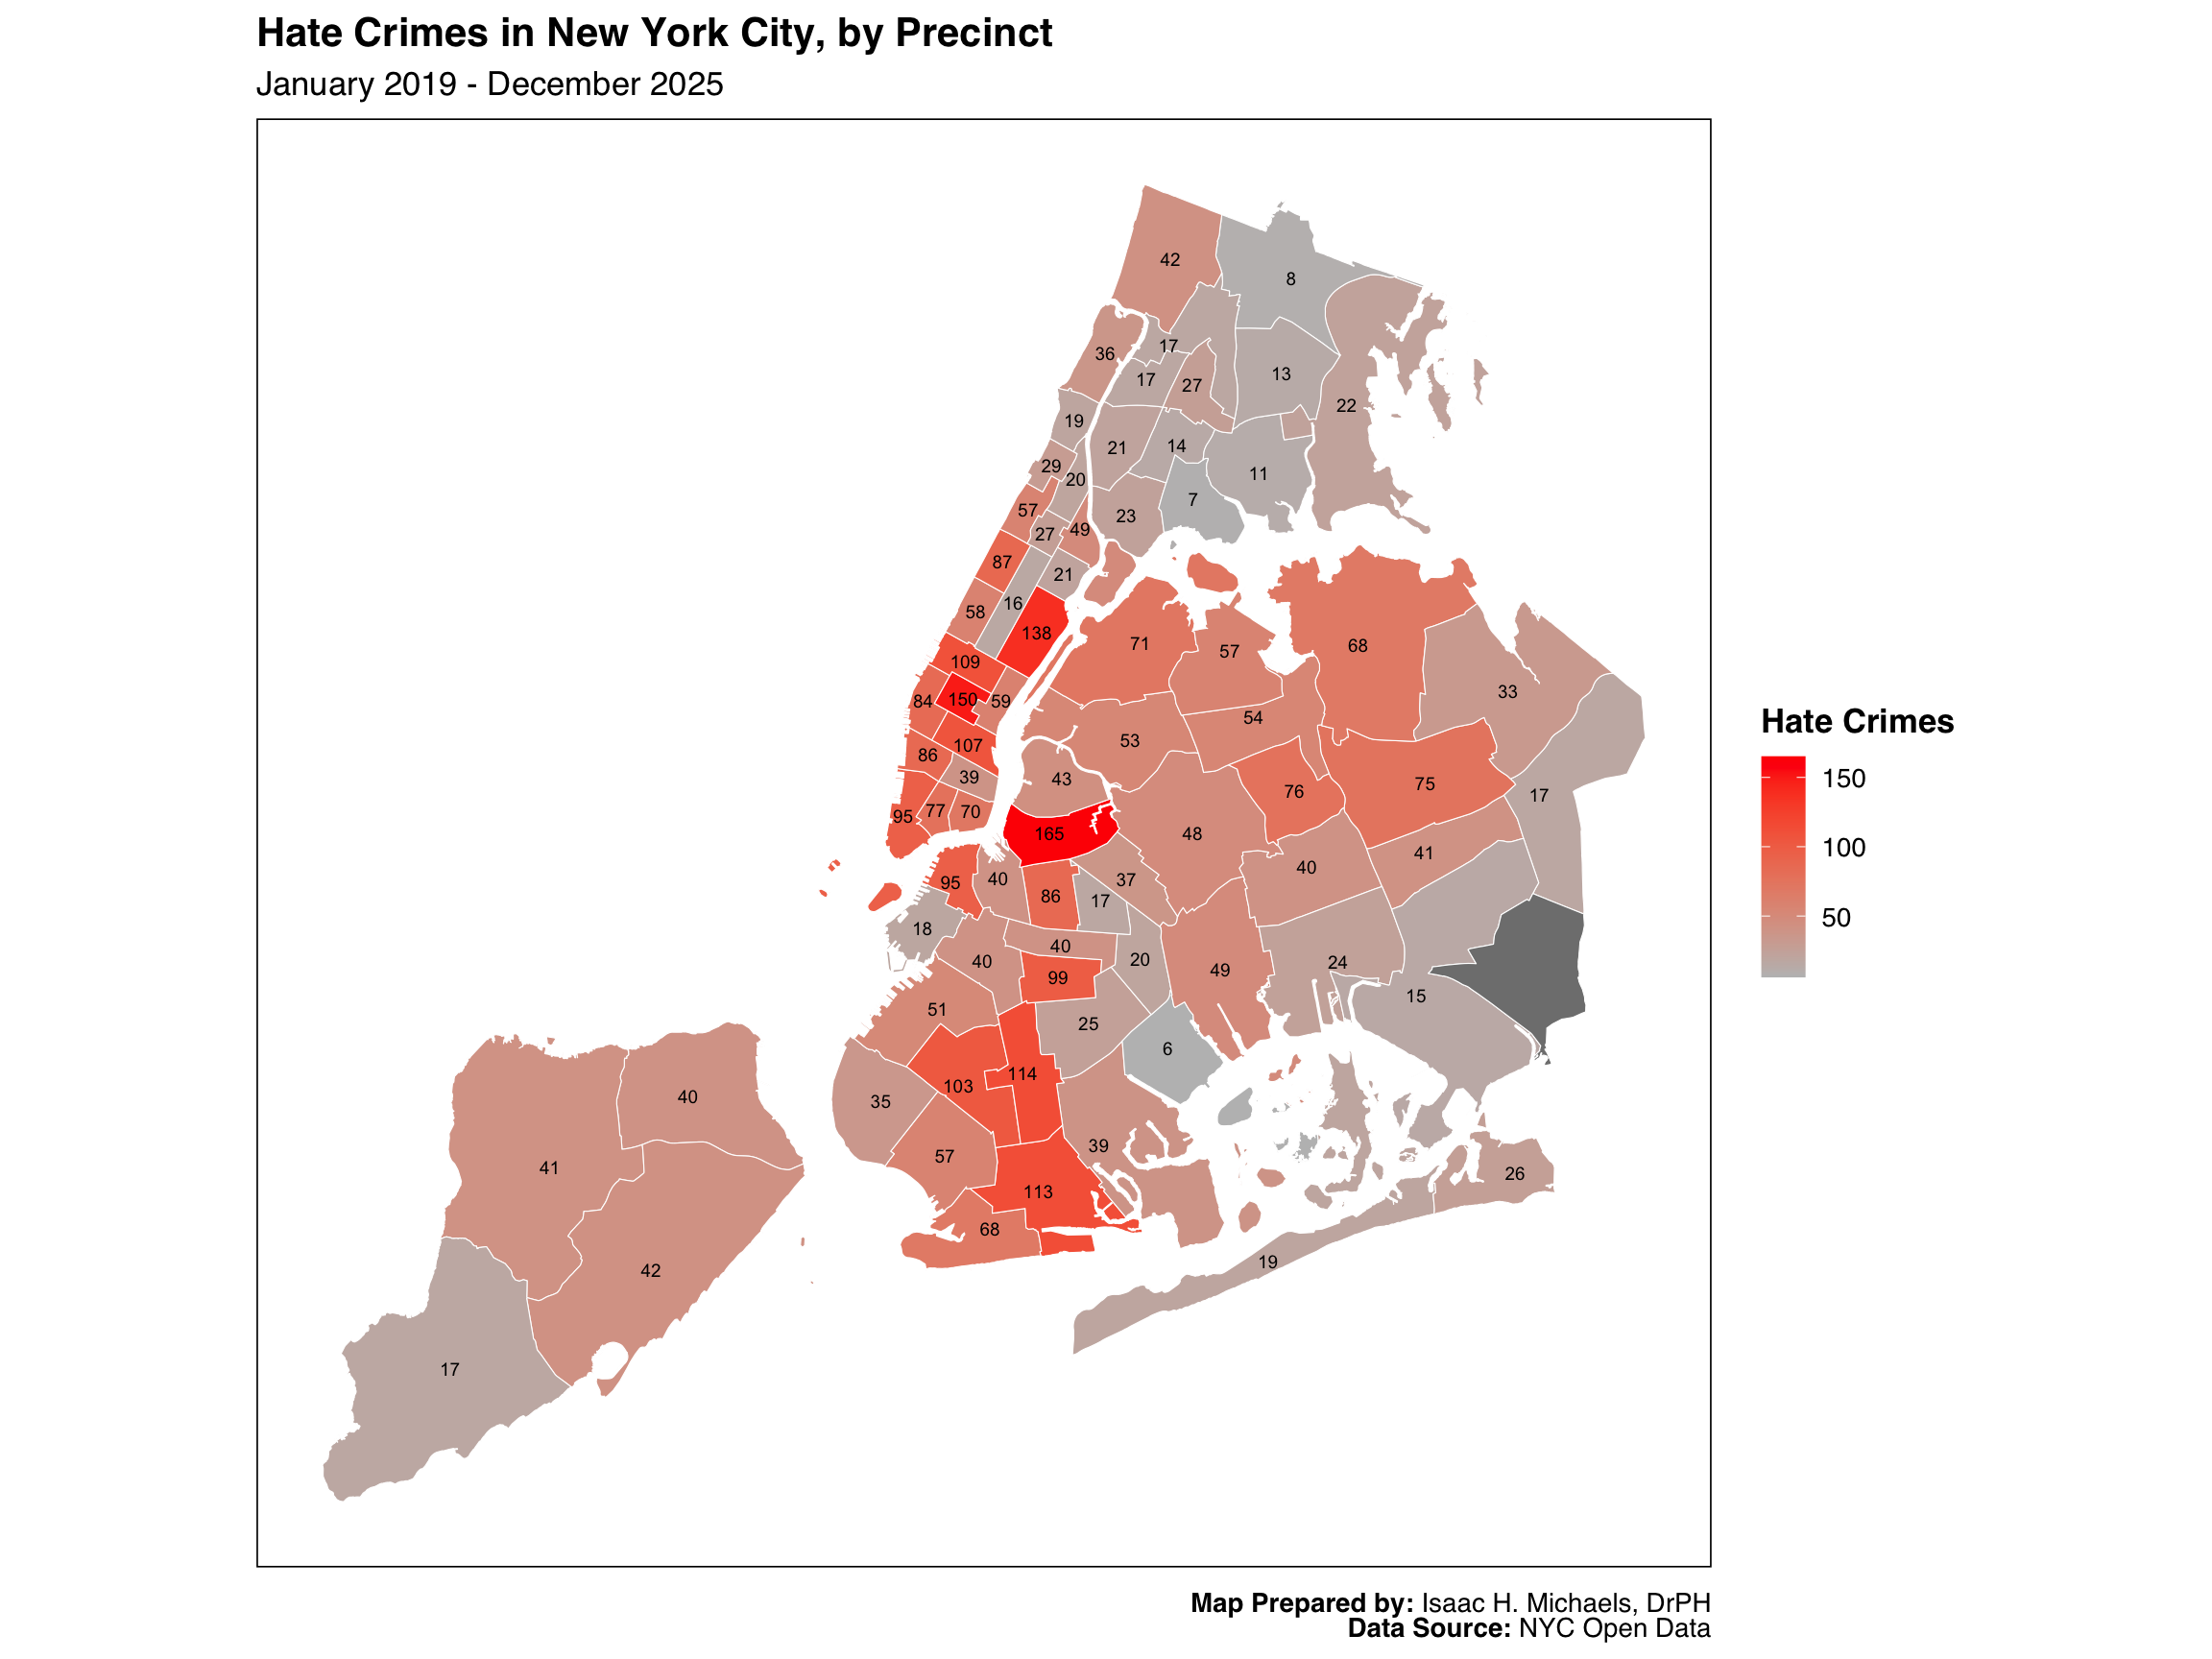
This map displays the total number of reported hate-crime incidents by police precinct. Each precinct area is shaded according to the number of incidents recorded within its boundaries, with counts labeled on the map. This map helps identify where incidents have been recorded geographically and supports coordination between local enforcement, community organizations, and public-safety planning. Geographic boundaries correspond to NYPD precincts, not community districts or ZIP codes.
Map Prepared By: Isaac H. Michaels, DrPH
Data Source: NYC Open Data
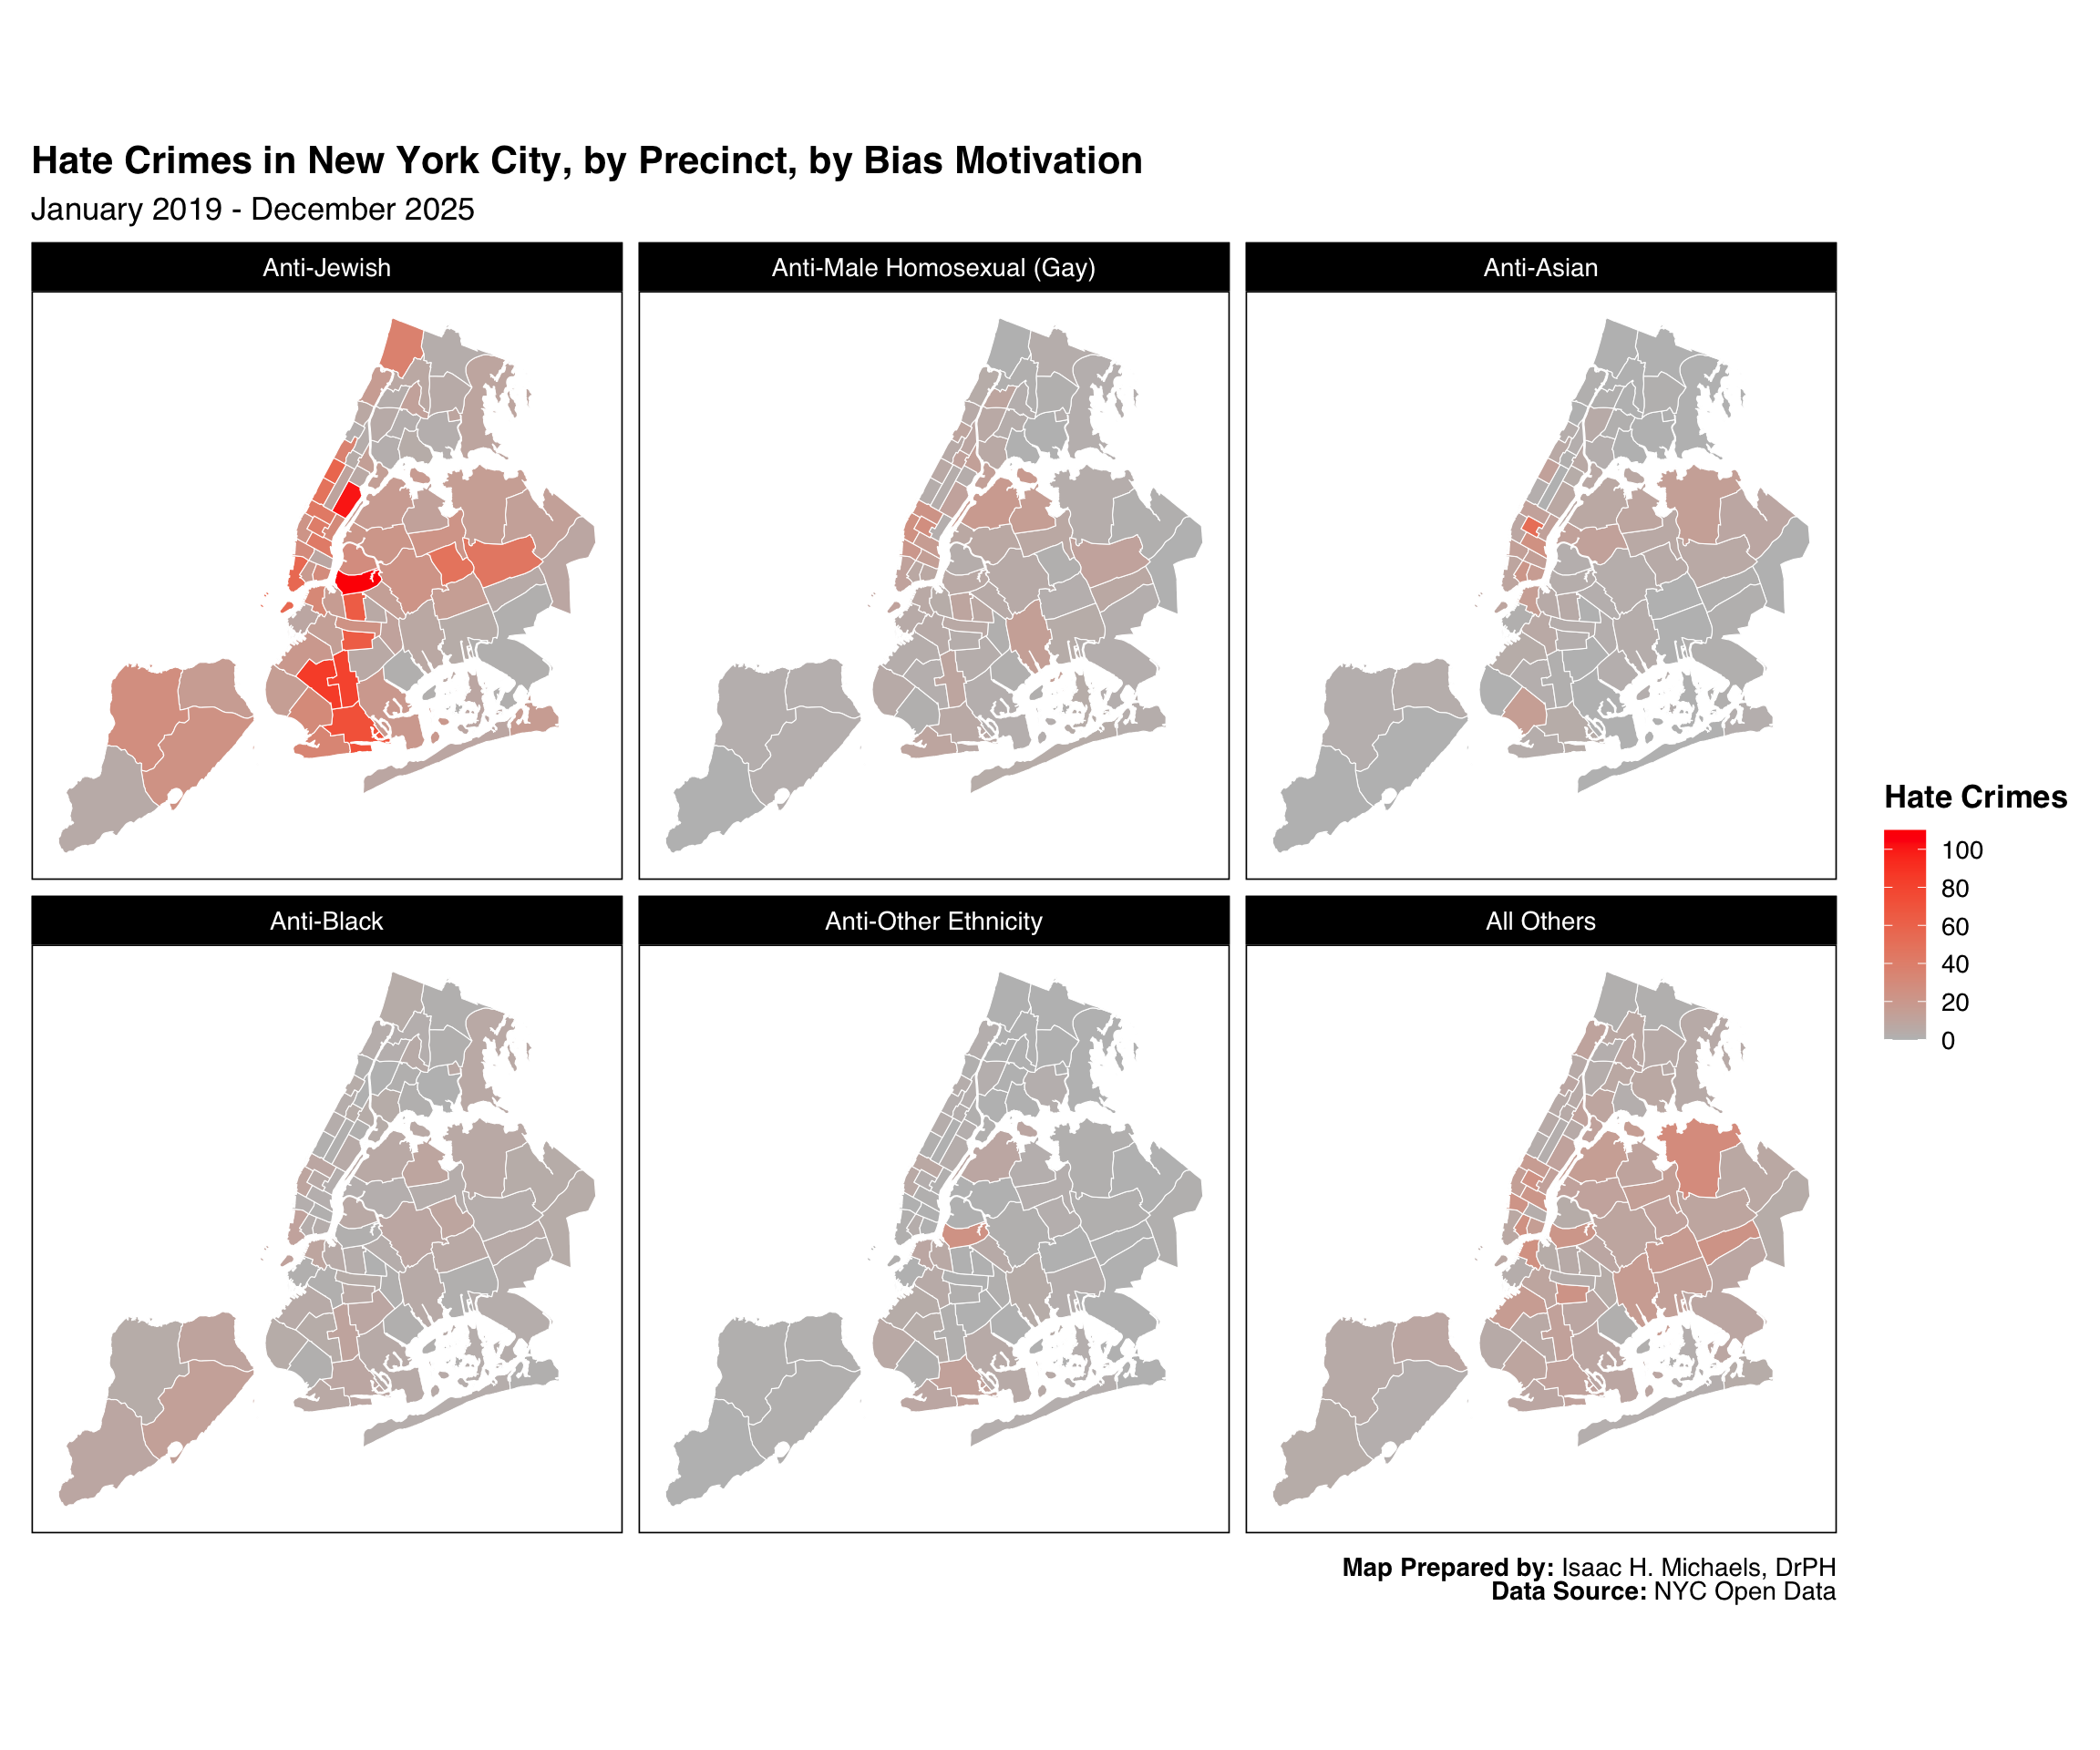
By Bias Motivation
This faceted map series presents the same precinct-level view but separates incidents by reported bias motive. Each panel shows precinct-level totals for one motive category, using the same color scale across maps for comparability. These maps help visualize how bias-motivated incidents are distributed geographically within the city for each motive category, providing a tool for targeted outreach and community engagement.
Map Prepared By: Isaac H. Michaels, DrPH
Data Source: NYC Open Data
Data Table
This table summarizes hate-crime data by major category, including the number of incidents reported in the latest 12-month period, cumulative totals, and a sparkline indicating monthly activity over time. The table highlights how data are structured across categories and can help identify which classifications are used in the dataset. It provides a compact reference for overall context and for linking to more detailed visualizations above.
| Hate Crimes in New York City | ||||
| January 2019 - June 2026 | ||||
| Category | Latest 12 Months | Cumulative Total | Monthly Trend | |
|---|---|---|---|---|
| Citywide | Citywide | 629 | 4,406 | |
| County | New York | 243 | 1,631 | |
| Kings | 207 | 1,545 | ||
| Queens | 120 | 817 | ||
| Bronx | 38 | 255 | ||
| Richmond | 21 | 158 | ||
| Offense Category | Religion/Religious Practice | 423 | 2,463 | |
| Race/Color | 76 | 887 | ||
| Sexual Orientation | 65 | 590 | ||
| Ethnicity/National Origin/Ancestry | 24 | 290 | ||
| Gender | 39 | 169 | ||
| Age | 1 | 5 | ||
| Disability | 1 | 2 | ||
| Bias Motivation | Anti-Jewish | 344 | 2,111 | |
| Anti-Male Homosexual (Gay) | 58 | 521 | ||
| Anti-Asian | 24 | 414 | ||
| Anti-Black | 45 | 341 | ||
| Anti-Muslim | 37 | 181 | ||
| Anti-Other Ethnicity | 9 | 174 | ||
| Anti-White | 7 | 129 | ||
| Anti-Hispanic | 14 | 107 | ||
| Anti-Transgender | 13 | 107 | ||
| Anti-Catholic | 19 | 86 | ||
| Anti-Female | 26 | 52 | ||
| Anti-Female Homosexual (Lesbian) | 2 | 50 | ||
| Anti-Other Religion | 20 | 33 | ||
| Anti-Lgbt (Mixed Group) | 5 | 19 | ||
| Anti-Sikh | 2 | 12 | ||
| Anti-Arab | 1 | 9 | ||
| 60 Yrs And Older | 1 | 5 | ||
| Anti-Other Christian | 1 | 4 | ||
| Anti-Mental Disability | 1 | 1 | ||
| Offense Description | Miscellaneous Penal Law | 242 | 1,246 | |
| Assault 3 & Related Offenses | 101 | 865 | ||
| Criminal Mischief & Related Of | 88 | 839 | ||
| Off. Agnst Pub Ord Sensblty & | 113 | 621 | ||
| Felony Assault | 49 | 509 | ||
| Robbery | 7 | 131 | ||
| Grand Larceny | 9 | 60 | ||
| Harrassment 2 | 4 | 29 | ||
| Petit Larceny | 2 | 28 | ||
| Burglary | 7 | 23 | ||
| Criminal Trespass | 6 | 8 | ||
| Disruption Of A Religious Serv | 1 | 1 | ||
| Law Code Category | Felony | 357 | 2,268 | |
| Misdemeanor | 268 | 2,107 | ||
| Violation | 4 | 29 | ||
| Data as of: July 27, 2026 | ||||
Table Prepared By: Isaac H. Michaels, DrPH
Data Source: NYC Open Data
Hate Crimes in New York State
Trends
Overall
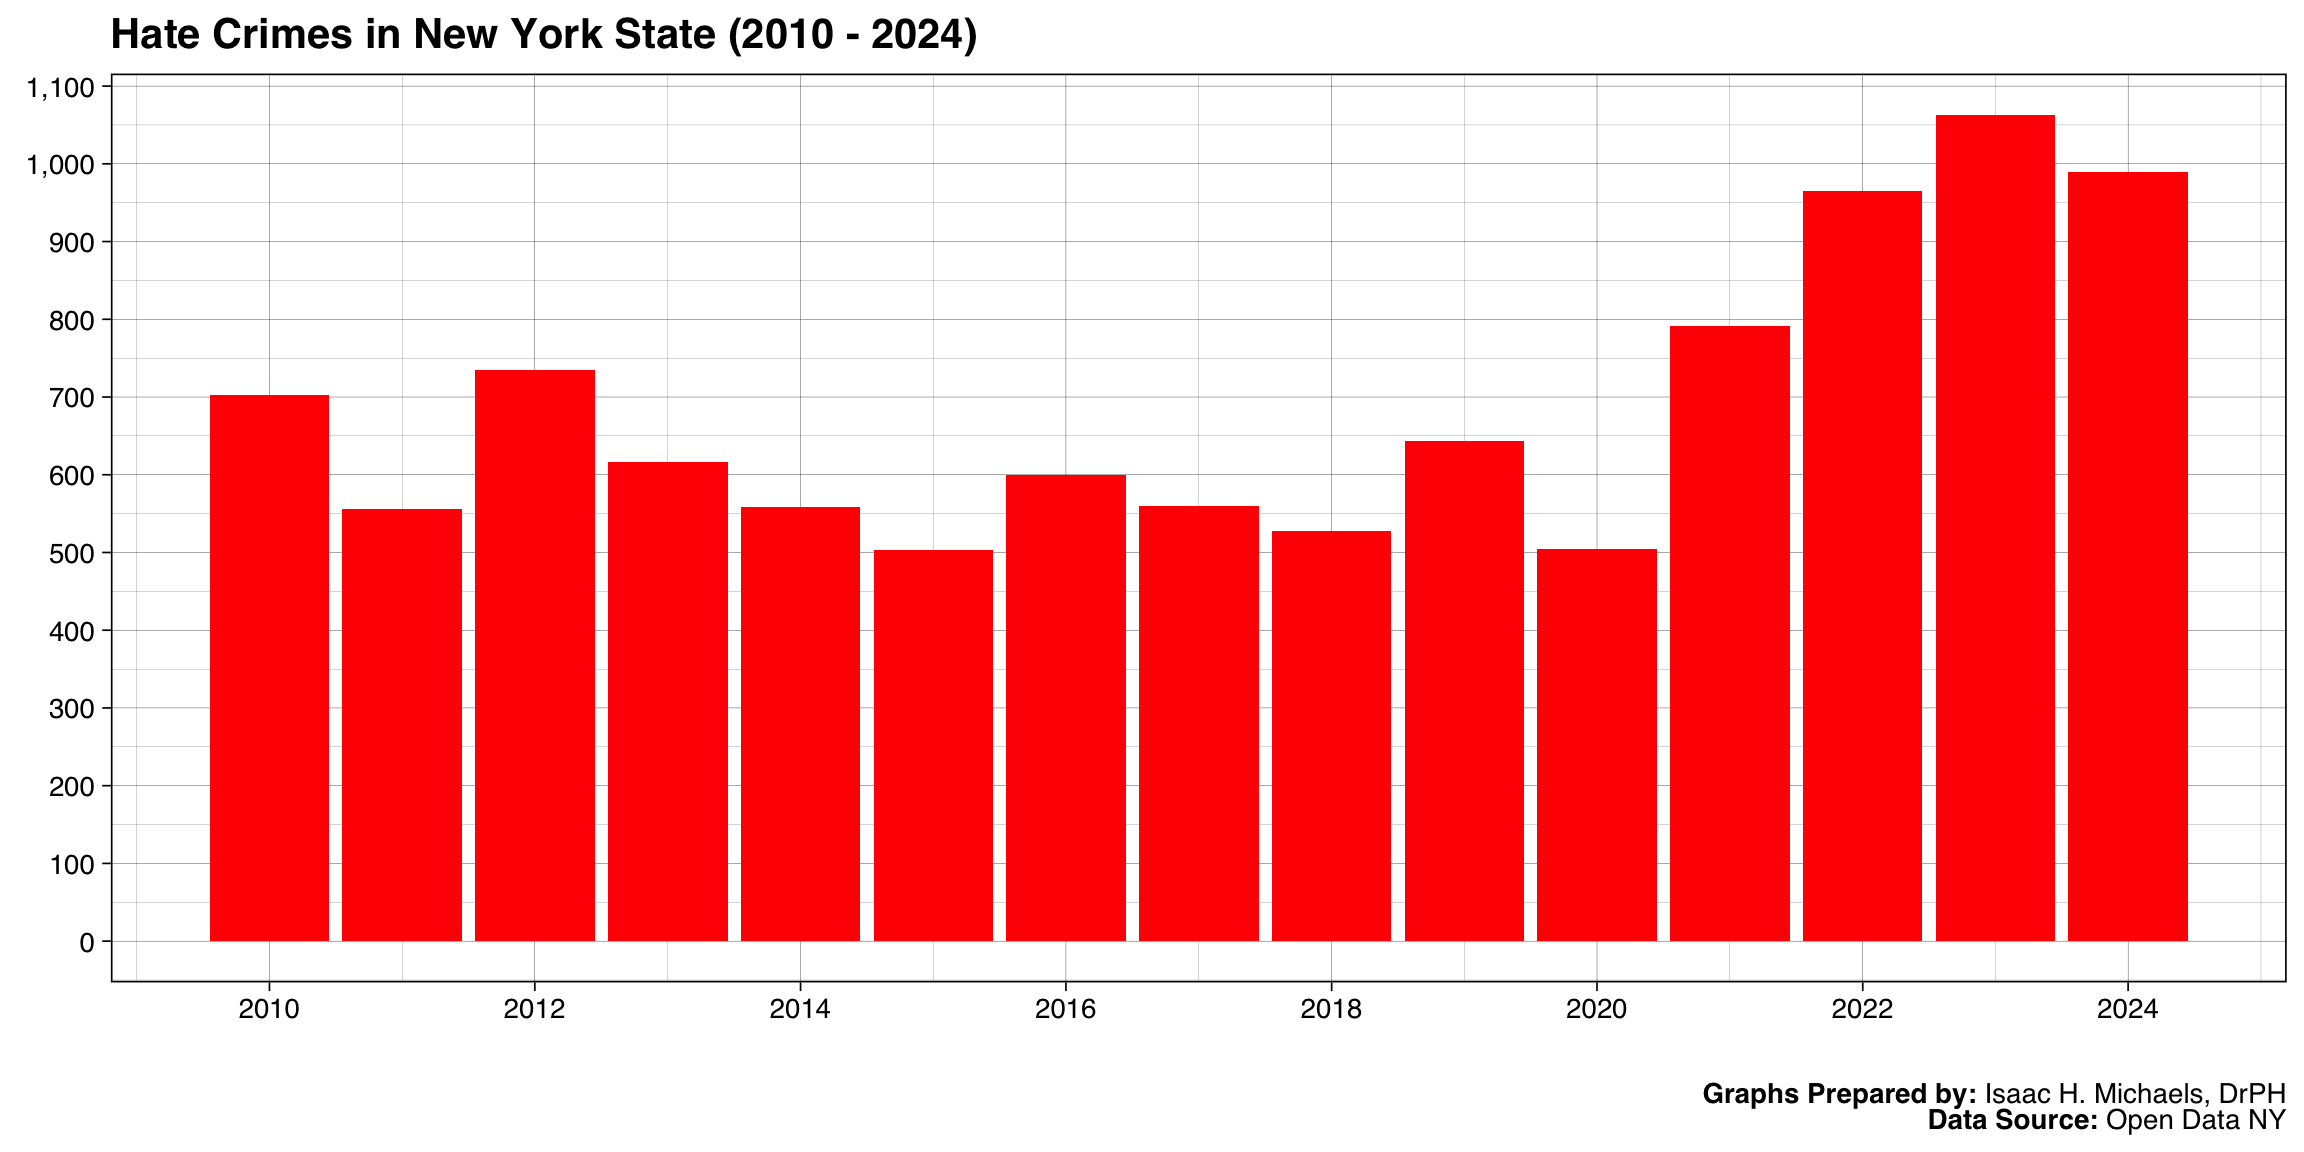
This bar chart illustrates the annual number of reported hate crimes in New York State over the selected period. Each bar represents a calendar year, showing the total number of incidents statewide. The visualization reveals how hate crime activity has fluctuated over time, with visible increases and decreases that may correspond to social or political events, changes in reporting practices, or shifts in enforcement emphasis.
Graph Prepared By: Isaac H. Michaels, DrPH
Data Source: Open Data NY
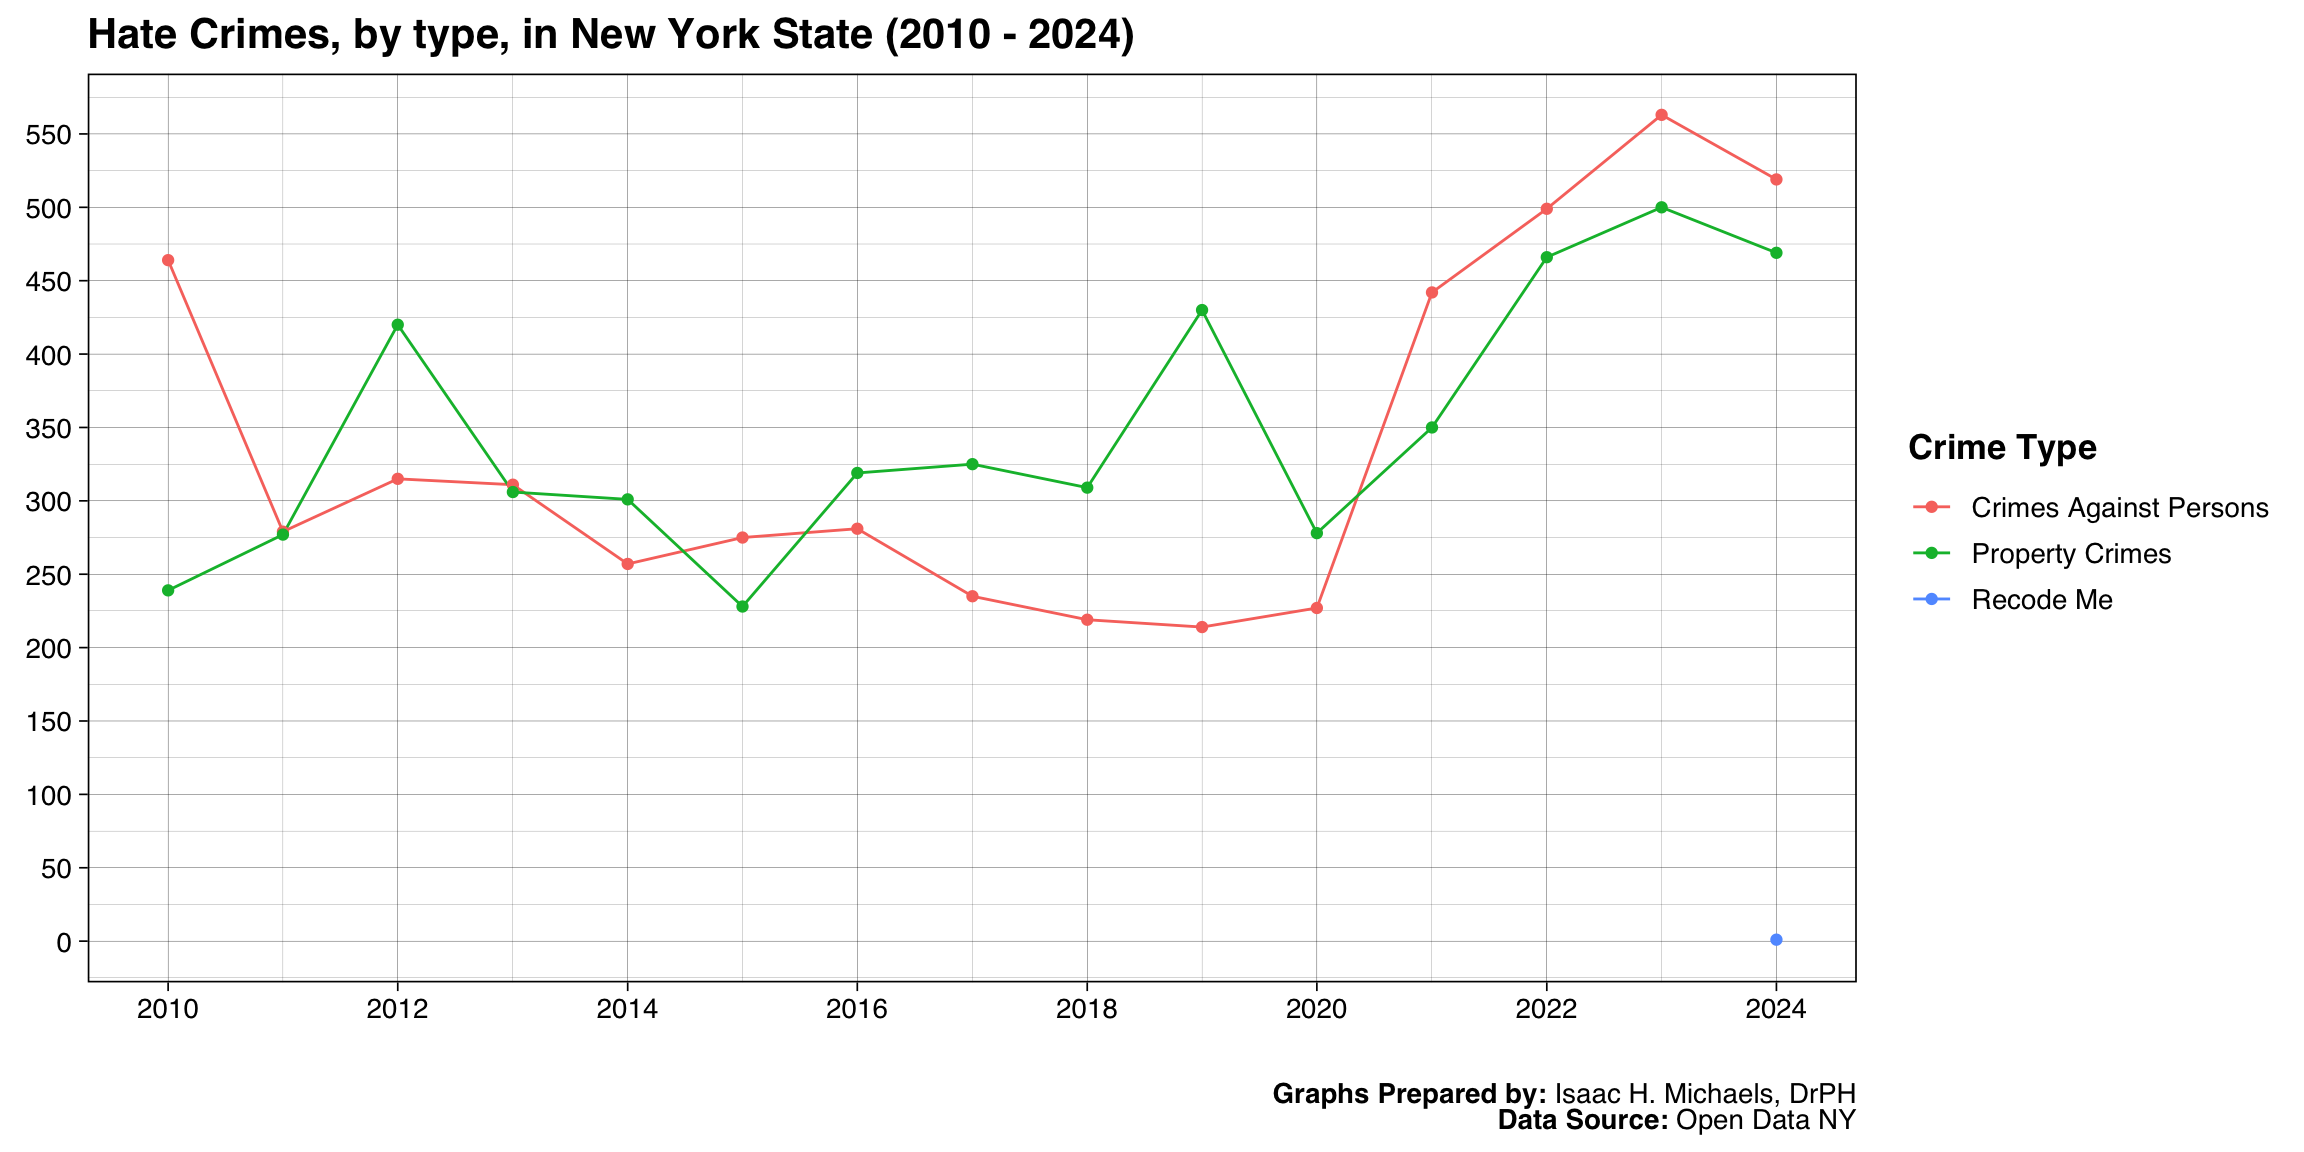
By Type
This line graph presents trends in hate crimes across different crime types in New York State over time. The red line represents a crimes against persons, and the turquoise line represents property crimes — and track their frequencies by year. The visualization highlights both the overall direction of trends and how these two types of hate crimes may rise or fall independently of others, providing insight into changing patterns of hate-motivated behavior.
Graph Prepared By: Isaac H. Michaels, DrPH
Data Source: Open Data NY
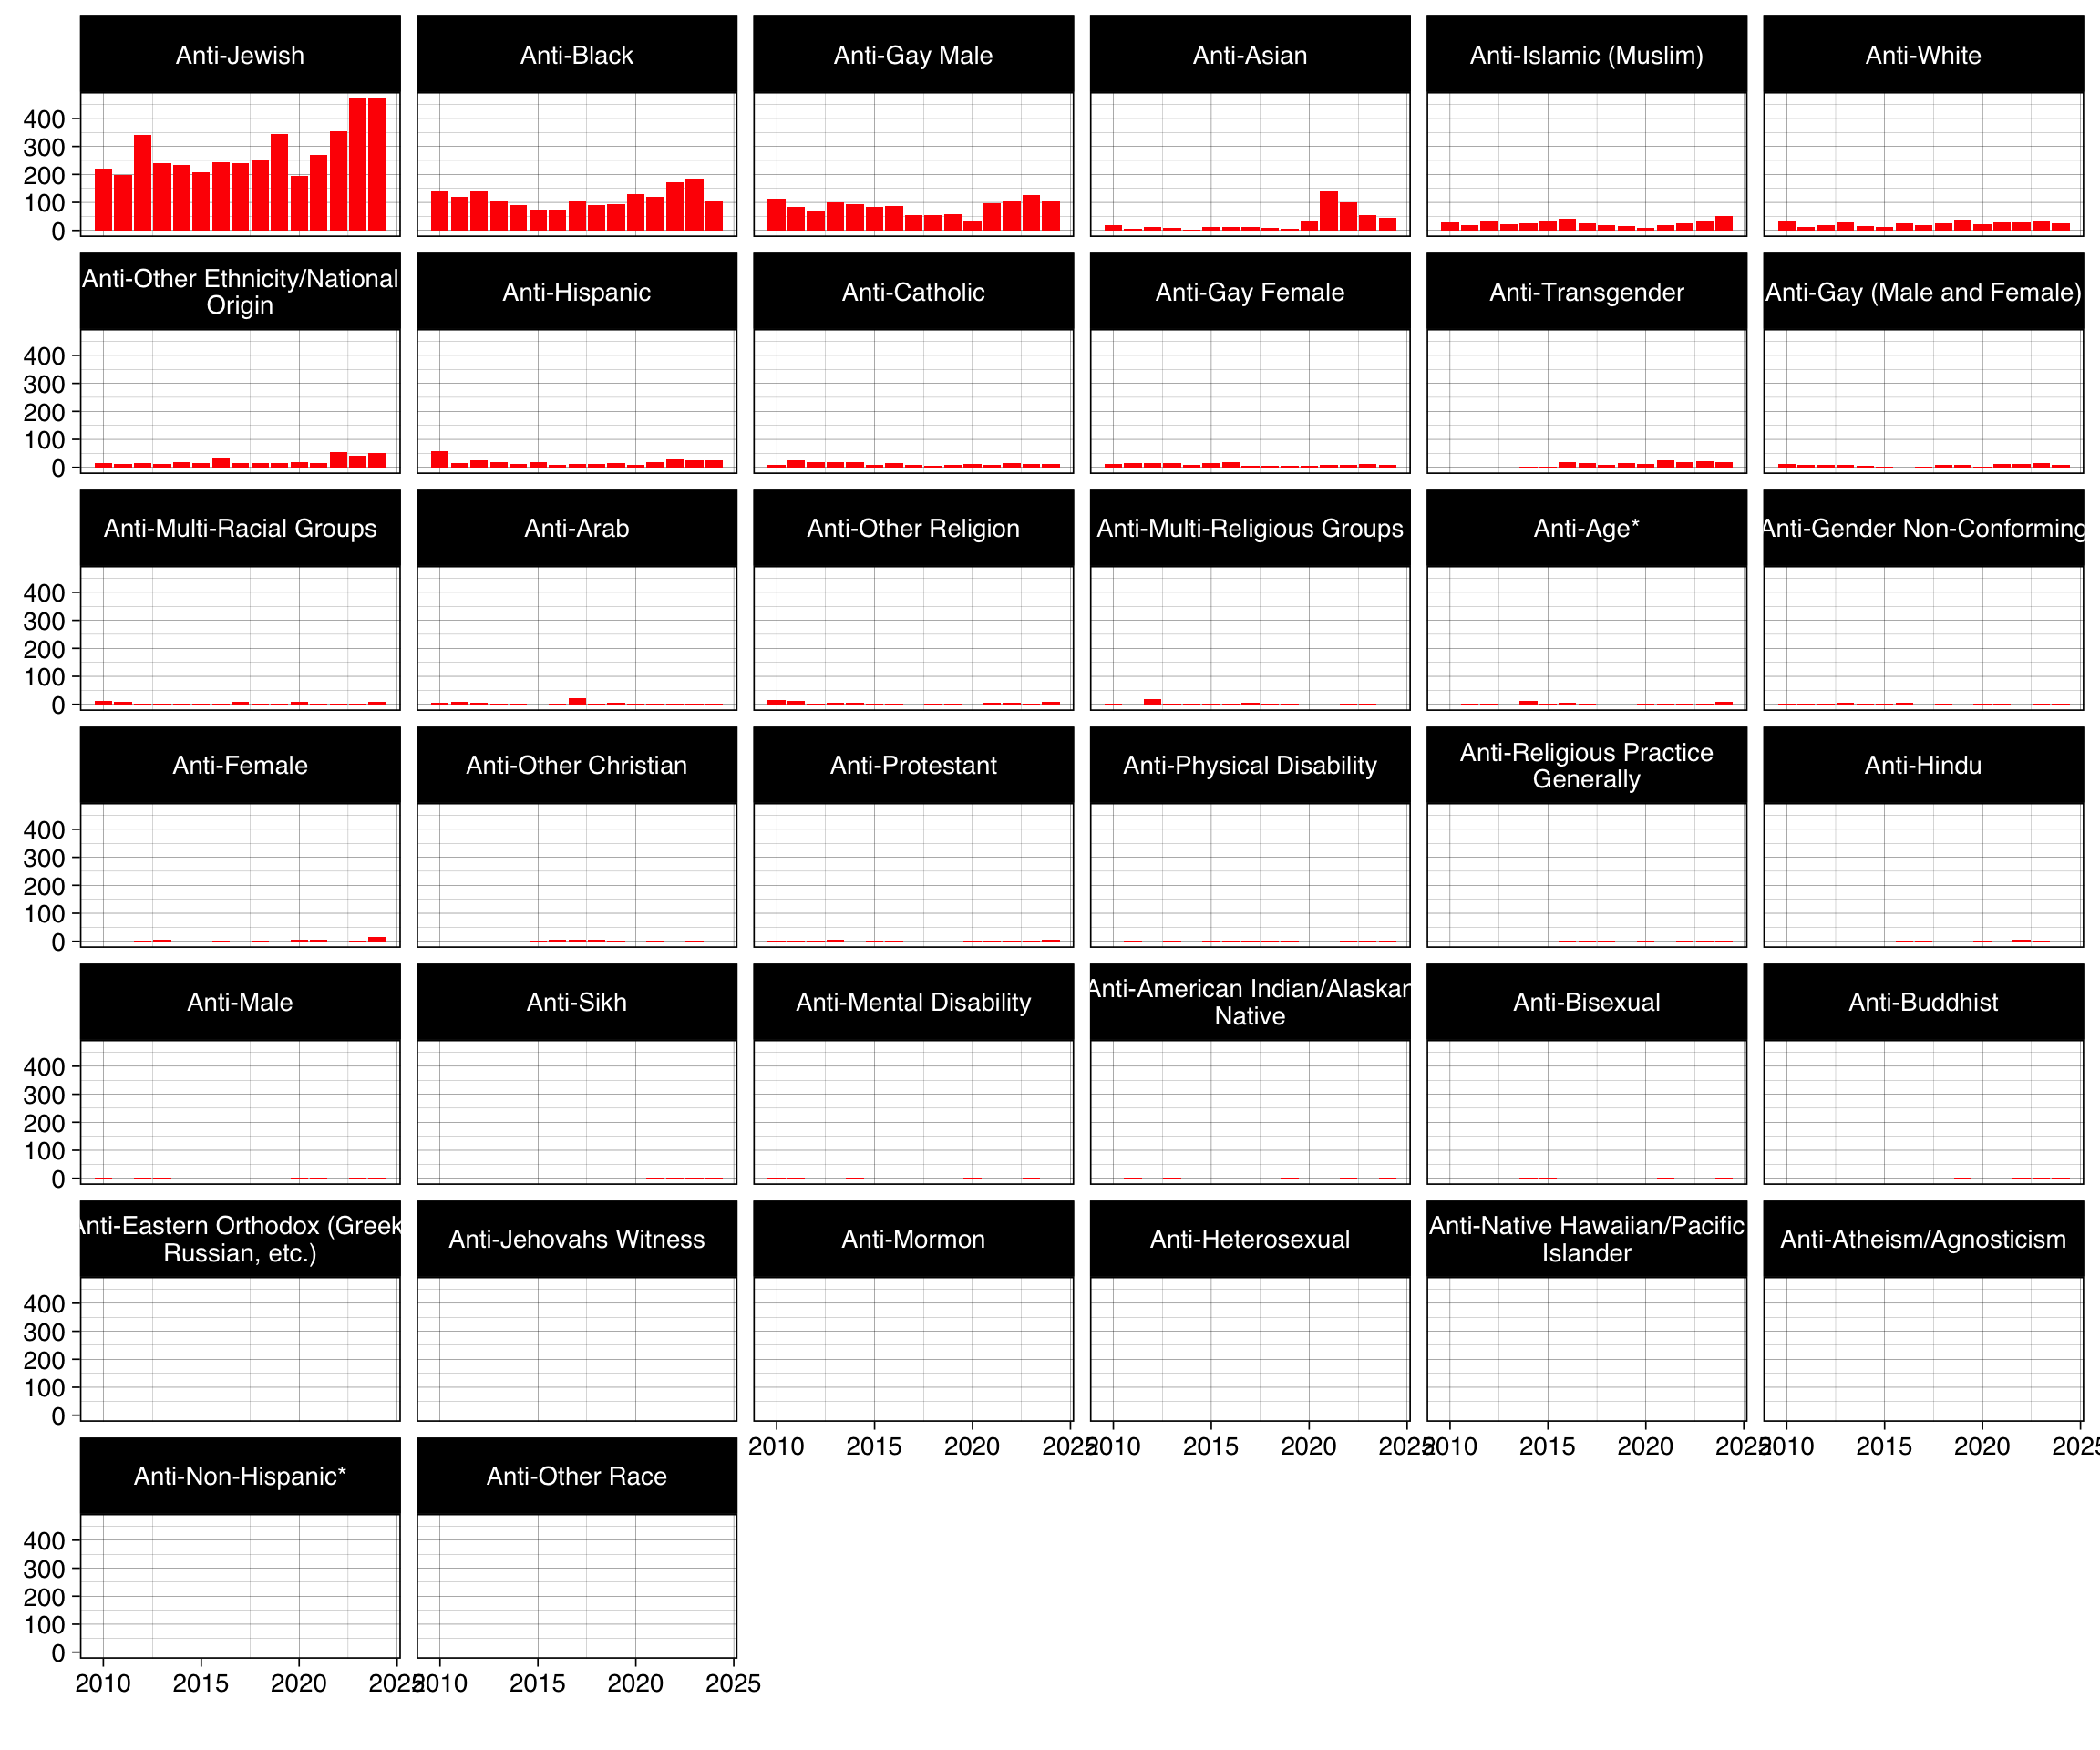
By Bias Motivation
This faceted bar chart shows annual counts of hate crimes in New York State, separated by bias type. Each small panel represents a different bias category—such as race/ethnicity, religion, sexual orientation, or gender identity—and includes a bar chart showing year-by-year totals within that category. The display enables comparisons across bias types and over time, emphasizing which forms of bias have been most prevalent or persistent.
Graph Prepared By: Isaac H. Michaels, DrPH
Data Source: Open Data NY
Spatial Distribution
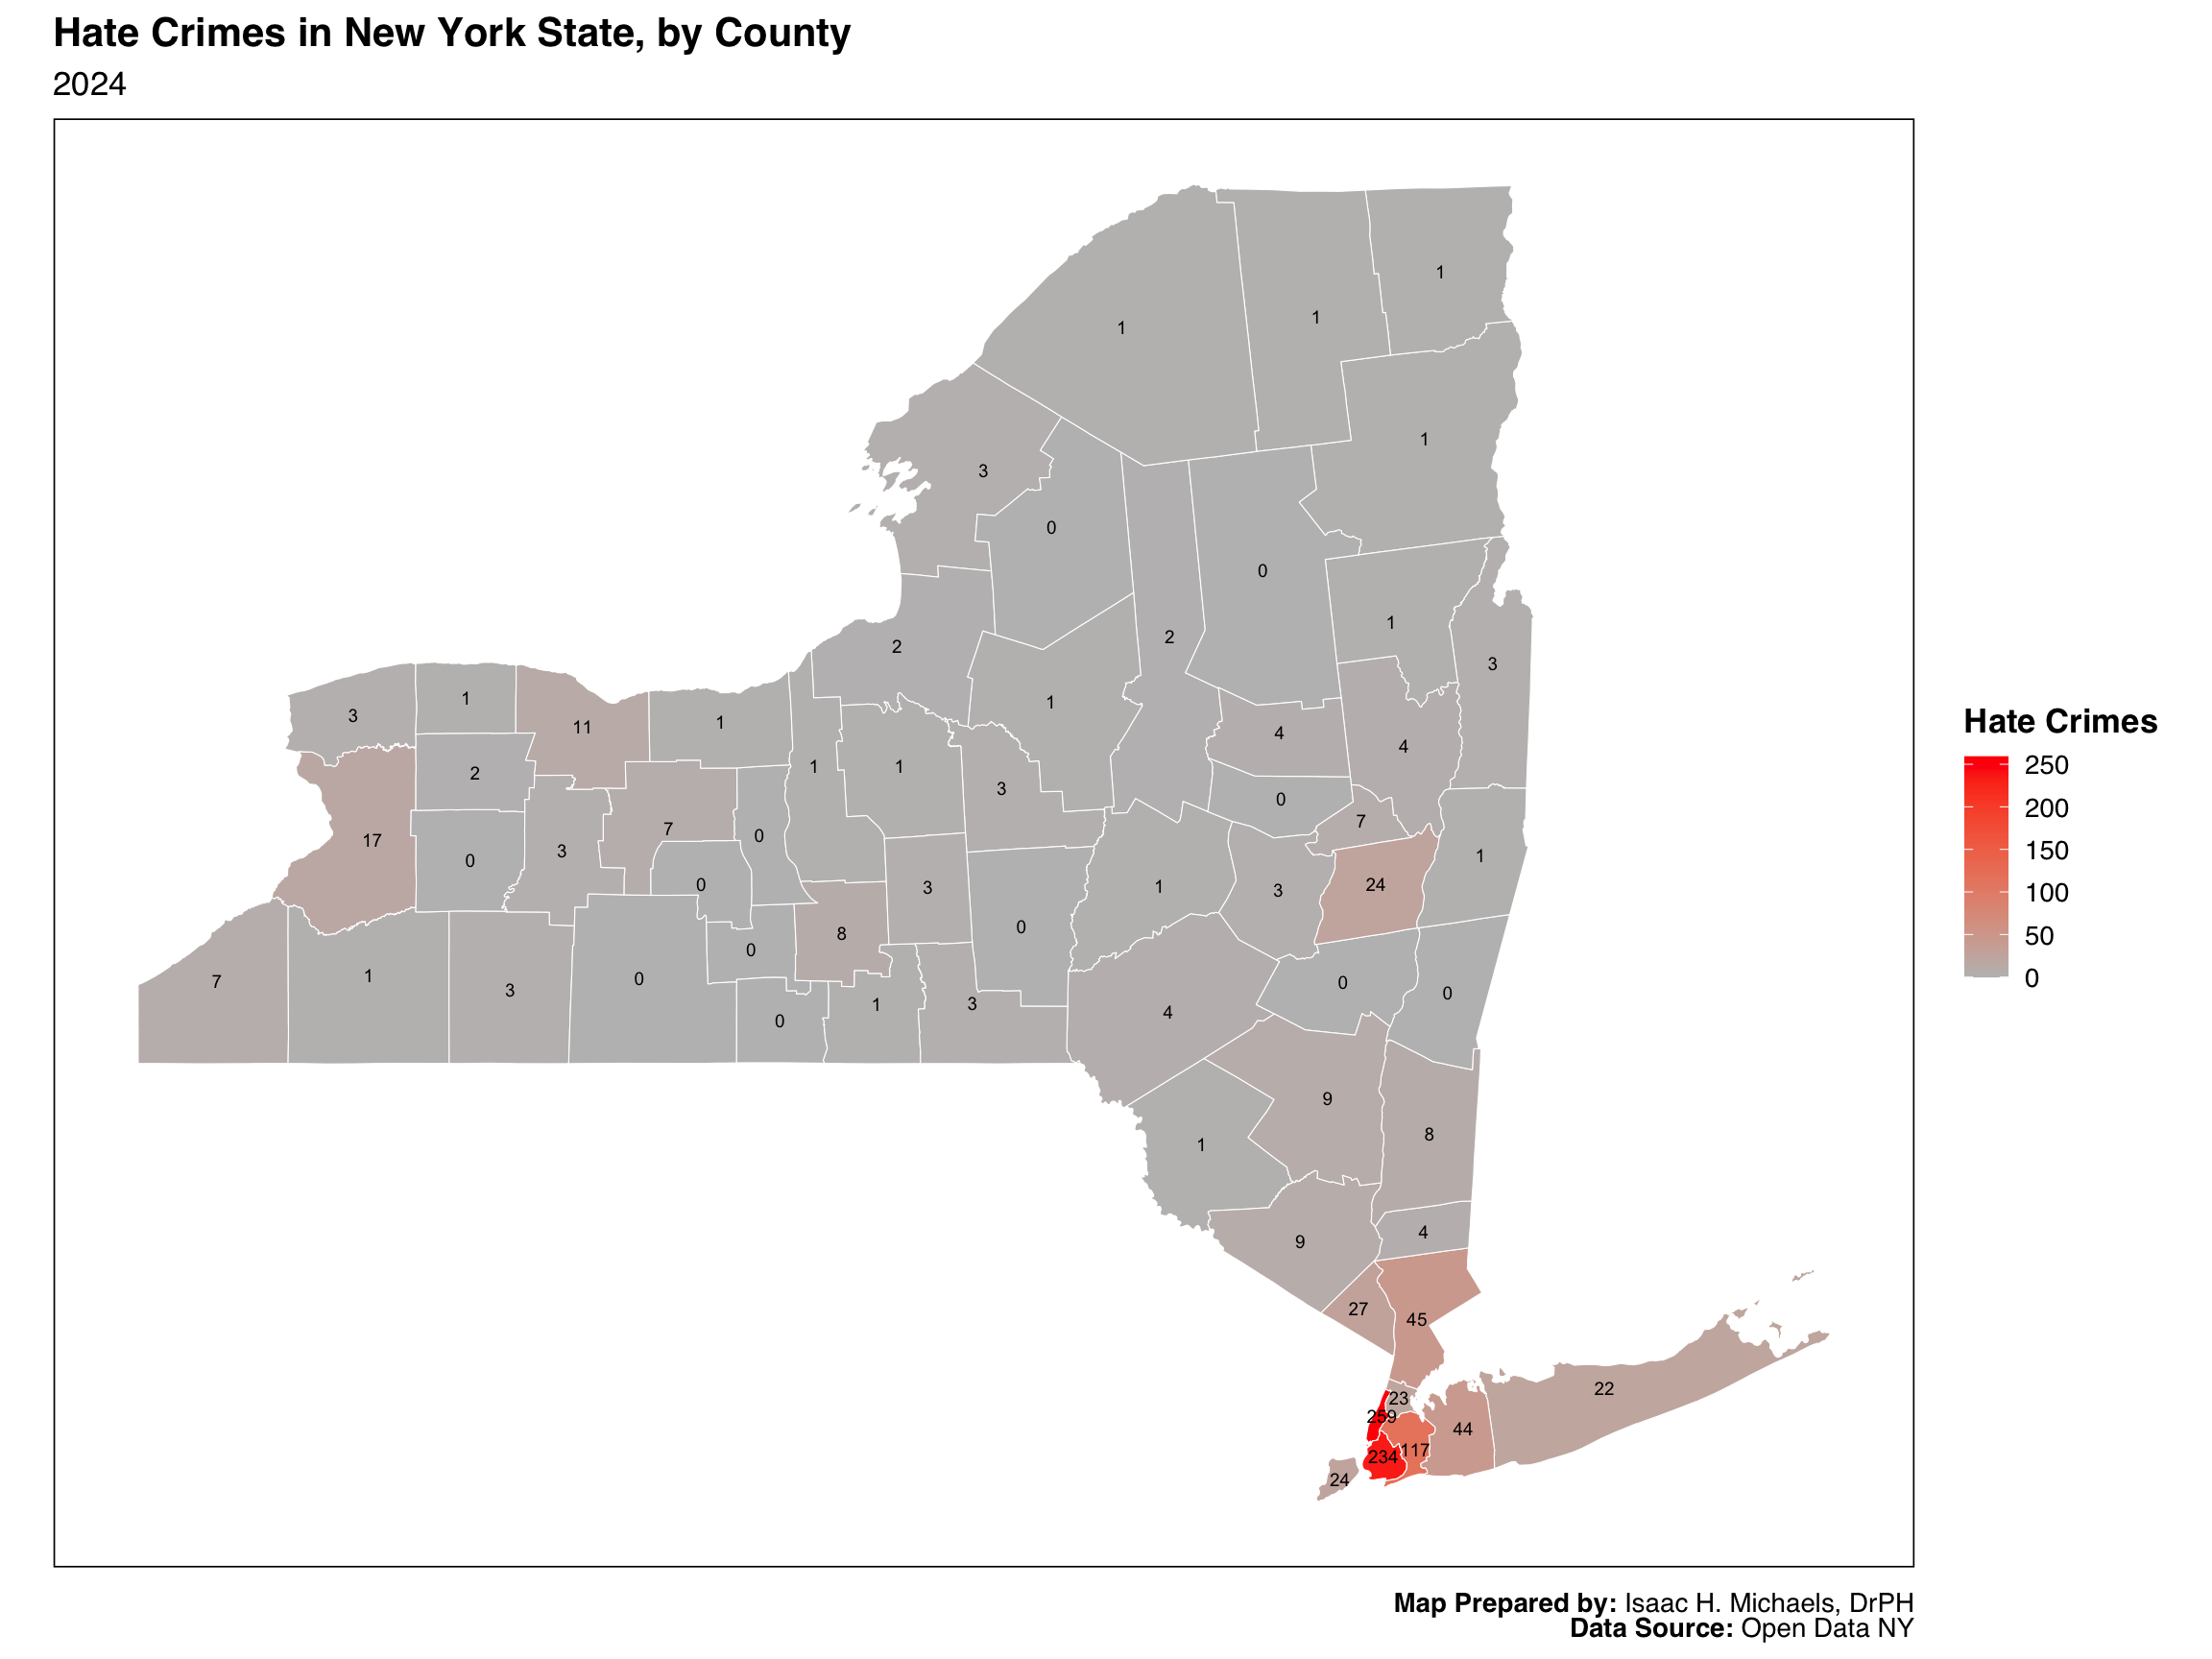
Volume
This choropleth map depicts the total number of reported hate crimes in each New York State county for the most recent year available. Counties are shaded according to the number of reported incidents, with darker red tones indicating higher counts. Numeric labels within each county provide exact values, allowing for both visual and quantitative interpretation. This geographic view highlights areas with elevated levels of reported hate crime activity.
Map Prepared By: Isaac H. Michaels, DrPH
Data Source: Open Data NY
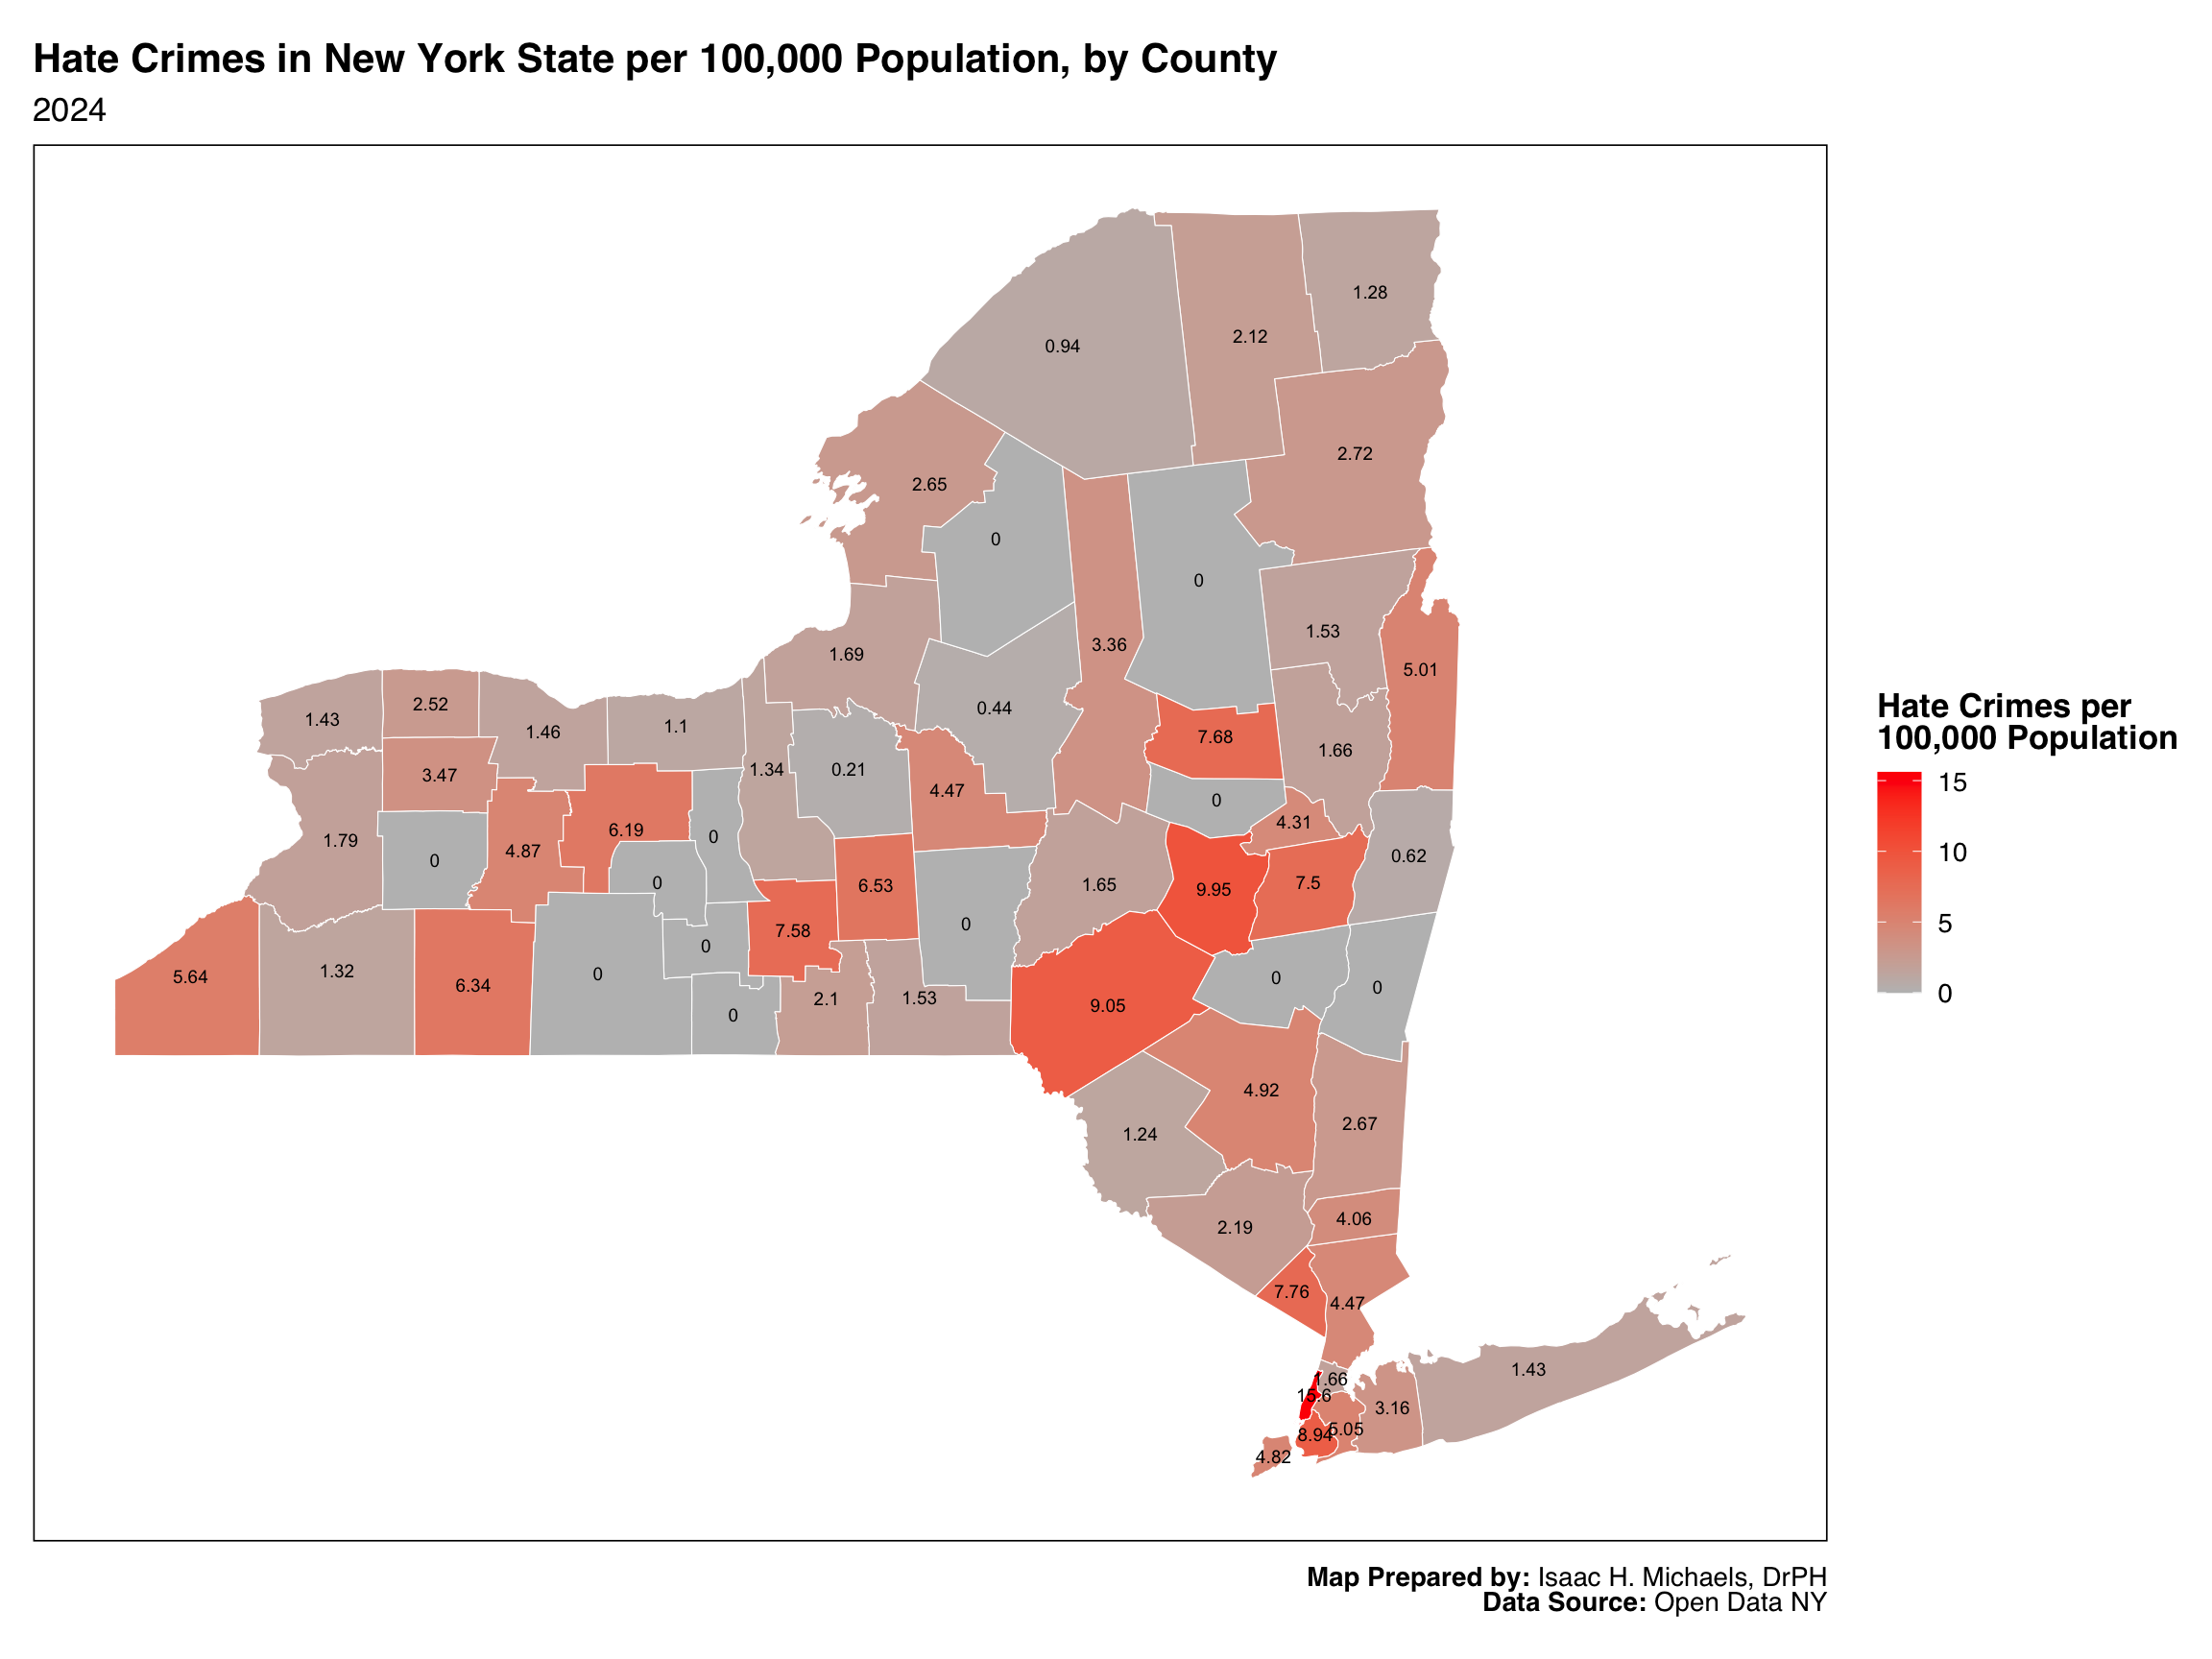
Rate per 100,000 Population
This map presents hate crime rates per 100,000 population across New York State counties for the most recent year available. By standardizing for population size, this map allows for more equitable comparison of hate crime intensity between densely and sparsely populated areas. Darker red shading represents higher rates, while lighter tones correspond to lower rates. County labels display the calculated rate values, rounded to two decimal places.
Map Prepared By: Isaac H. Michaels, DrPH
Data Source: Open Data NY
Data Table
This summary table provides an overview of hate crimes in New York State by key categories across the available years. For each category, it lists the latest year’s total, cumulative total across all years, and a sparkline showing the annual trend. The sparklines visually summarize the direction and variability of hate crime activity within each category, while the numeric columns give context for recent and aggregate levels. This compact view supports quick identification of categories with increasing, decreasing, or stable trends.
| Hate Crimes in New York State | ||||
| 2010 through 2024 | ||||
| Category | Latest Year | Cumulative Total | Annual Trend | |
|---|---|---|---|---|
| Statewide | Statewide | 989 | 10,318 | |
| Crime Type | Property Crimes | 469 | 5,217 | |
| Crimes Against Persons | 519 | 5,100 | ||
| Recode Me | 1 | 1 | ||
| Bias Motivation | Anti-Jewish | 471 | 4,284 | |
| Anti-Black | 106 | 1,746 | ||
| Anti-Gay Male | 108 | 1,271 | ||
| Anti-Asian | 44 | 469 | ||
| Anti-Islamic (Muslim) | 50 | 398 | ||
| Anti-White | 24 | 357 | ||
| Anti-Other Ethnicity/National Origin | 50 | 345 | ||
| Anti-Hispanic | 25 | 309 | ||
| Anti-Catholic | 13 | 198 | ||
| Anti-Gay Female | 8 | 164 | ||
| Anti-Transgender | 18 | 157 | ||
| Anti-Gay (Male and Female) | 8 | 112 | ||
| Anti-Multi-Racial Groups | 8 | 75 | ||
| Anti-Arab | 4 | 73 | ||
| Anti-Other Religion | 10 | 73 | ||
| Anti-Multi-Religious Groups | 0 | 46 | ||
| Anti-Age* | 8 | 40 | ||
| Anti-Gender Non-Conforming | 4 | 39 | ||
| Anti-Female | 14 | 34 | ||
| Anti-Other Christian | 0 | 22 | ||
| Anti-Protestant | 5 | 19 | ||
| Anti-Physical Disability | 1 | 13 | ||
| Anti-Religious Practice Generally | 3 | 12 | ||
| Anti-Hindu | 0 | 11 | ||
| Anti-Male | 1 | 8 | ||
| Anti-Sikh | 1 | 8 | ||
| Anti-Mental Disability | 0 | 7 | ||
| Anti-American Indian/Alaskan Native | 1 | 6 | ||
| Anti-Bisexual | 1 | 5 | ||
| Anti-Buddhist | 1 | 5 | ||
| Anti-Eastern Orthodox (Greek, Russian, etc.) | 0 | 4 | ||
| Anti-Jehovahs Witness | 0 | 3 | ||
| Anti-Mormon | 2 | 3 | ||
| Anti-Heterosexual | 0 | 1 | ||
| Anti-Native Hawaiian/Pacific Islander | 0 | 1 | ||
| Anti-Atheism/Agnosticism | 0 | 0 | ||
| Anti-Non-Hispanic* | 0 | 0 | ||
| Anti-Other Race | 0 | 0 | ||
| County | Kings | 234 | 2,205 | |
| New York | 259 | 2,073 | ||
| Queens | 117 | 1,033 | ||
| Nassau | 44 | 703 | ||
| Suffolk | 22 | 702 | ||
| Westchester | 45 | 439 | ||
| Bronx | 23 | 421 | ||
| Multiple | 23 | 384 | ||
| Erie | 17 | 327 | ||
| Richmond | 24 | 297 | ||
| Albany | 24 | 208 | ||
| Rockland | 27 | 170 | ||
| Monroe | 11 | 137 | ||
| Dutchess | 8 | 123 | ||
| Orange | 9 | 116 | ||
| Ulster | 9 | 67 | ||
| Tompkins | 8 | 55 | ||
| Broome | 3 | 48 | ||
| Saratoga | 4 | 47 | ||
| Clinton | 1 | 45 | ||
| Madison | 3 | 43 | ||
| Niagara | 3 | 43 | ||
| Schenectady | 7 | 38 | ||
| Oneida | 1 | 36 | ||
| St. Lawrence | 1 | 35 | ||
| Cayuga | 1 | 34 | ||
| Oswego | 2 | 32 | ||
| Ontario | 7 | 30 | ||
| Onondaga | 1 | 28 | ||
| Cattaraugus | 1 | 26 | ||
| Otsego | 1 | 25 | ||
| Chautauqua | 7 | 24 | ||
| Cortland | 3 | 22 | ||
| Sullivan | 1 | 20 | ||
| Schoharie | 3 | 19 | ||
| Rensselaer | 1 | 18 | ||
| Wayne | 1 | 18 | ||
| Columbia | 1 | 17 | ||
| Franklin | 1 | 17 | ||
| Livingston | 3 | 16 | ||
| Putnam | 4 | 16 | ||
| Jefferson | 3 | 15 | ||
| Herkimer | 2 | 13 | ||
| Washington | 3 | 13 | ||
| Essex | 1 | 12 | ||
| Chenango | 1 | 10 | ||
| Delaware | 4 | 10 | ||
| Fulton | 4 | 9 | ||
| Steuben | 3 | 9 | ||
| Chemung | 1 | 8 | ||
| Tioga | 1 | 8 | ||
| Allegany | 3 | 7 | ||
| Genesee | 2 | 7 | ||
| Greene | 1 | 7 | ||
| Seneca | 1 | 7 | ||
| Warren | 1 | 6 | ||
| Orleans | 1 | 5 | ||
| Montgomery | 1 | 4 | ||
| Hamilton | 2 | 3 | ||
| Yates | 2 | 3 | ||
| Lewis | 1 | 2 | ||
| Wyoming | 1 | 2 | ||
| Schuyler | 1 | 1 | ||
| Data as of: July 27, 2026 | ||||
Table Prepared By: Isaac H. Michaels, DrPH
Data Source: Open Data NY
This executive summary was generated by an AI summarizer agent and reviewed by an editor agent. I review any summaries flagged for revision.↩︎