Published: October 19, 2026
Updated: October 19, 2026 at 12:59PM
Welcome
Welcome to the Buffalo 311 Service Requests Terminal. This page provides a comprehensive spatial and temporal analysis of municipal service requests submitted to Buffalo 311 over the preceding 24 hours. The 311 system serves as the city’s primary non-emergency interface, and understanding these real-time demand patterns can help inform municipal resource allocation, neighborhood equity assessments, and targeted public health interventions. The data presented here are sourced directly from the Buffalo Open Data platform.
Data Overview
The dataset includes all publicly reportable 311 interactions filed on October 19, 2026, capturing key details such as the date and time of the call, location, responding department, and specific complaint type. The data powering this terminal are pre-filtered to isolate records with valid geospatial coordinates to ensure accurate mapping. Because these records represent a rolling 24-hour window, this dashboard functions as an active surveillance tool rather than a historical archive.
How to Use These Data
This interactive terminal provides synchronized spatial visualizations and data tables to help users explore daily municipal friction. Users can filter the map and underlying records by Council District, responding department, complaint type, and 24-hour resolution status. These tools allow analysts to transition from citywide daily trends to hyper-local, street-level observations, identifying operational backlogs or localized clusters of infrastructure decay.
Why Are These Data Important?
Buffalo 311 data function as a real-time sensor network for structural determinants of health and neighborhood quality of life. Monitoring trends in complaint volume and department response times helps identify emerging environmental hazards before they precipitate broad public health crises. These data are particularly critical for understanding infrastructural vulnerabilities, seasonal variations in municipal strain, and disparities in government service delivery across different council districts.
What Do These Data Show?
These data illustrate the immediate geographic distribution and categorical makeup of municipal service demands. They reveal the spatial footprint of specific urban issues—from systemic residential decay to acute street-level nuisances—and highlight which city departments are currently absorbing the highest volume of triage requests. Furthermore, the data provide operational visibility into short-term municipal responsiveness by tracking which geographic areas are experiencing localized backlogs of unresolved tickets.
What Do These Data Not Show?
These data measure complaint volume, not necessarily the true underlying prevalence of incidents. 311 data are heavily influenced by reporting bias; wealthier, digitally connected neighborhoods often over-utilize 311, while marginalized communities may under-report severe issues. Additionally, these data exclude emergencies handled by 911 and do not always provide the final outcome of the department's investigation, only the administrative closure status of the digital ticket.
Executive Summary
On October 19, 2026, Buffalo residents submitted 13 geocoded service requests to 311. The most frequent complaint type citywide was "High Grass/Weeds", accounting for 3 individual reports. The Public Works, Parks & Streets was the most highly mobilized municipal department, tasked with responding to 61.5% of the day's overall geographic call volume.
24-Hour Surveillance Terminal
Spatial distribution of all geocoded service requests filed on October 19, 2026.
This interactive terminal maps the immediate geographic distribution of quality-of-life and municipal service demands. By isolating specific departments, complaint types, or districts, analysts can transition from citywide daily trends to localized, street-level observations.
Terminal Prepared By: Isaac H. Michaels, DrPH
Data Source: Buffalo Open Data
Summary Table
This matrix converts the raw 24-hour spatial data into a structured comparative analysis. It evaluates the absolute frequency of top complaints across the Council Districts and ranks the city departments experiencing the highest volume of immediate dispatch requests.
| Daily Municipal Service Intelligence Summary | |||||||||||
| Buffalo 311 Service Requests (October 19, 2026) | |||||||||||
| Total | % of Citywide | Delaware (n, %) |
Ellicott (n, %) |
Fillmore (n, %) |
Lovejoy (n, %) |
Masten (n, %) |
Niagara (n, %) |
North (n, %) |
South (n, %) |
University (n, %) |
|
|---|---|---|---|---|---|---|---|---|---|---|---|
| TOTAL VOLUME (% of Citywide Total) | |||||||||||
| Total Requests | 13 | 2 (15.4%) | - | - | - | 5 (38.5%) | 6 (46.2%) | - | - | - | |
| 24-HOUR RESOLUTION STATUS (% of District Total) | |||||||||||
| In Progress | 7 | - | - | - | - | 5 (100.0%) | 2 (33.3%) | - | - | - | |
| New | 6 | 2 (100.0%) | - | - | - | - | 4 (66.7%) | - | - | - | |
| TOP 5 RESPONDING DEPARTMENTS (% of District Total) | |||||||||||
| Public Works, Parks & Streets | 8 | 2 (100.0%) | - | - | - | - | 6 (100.0%) | - | - | - | |
| Permit & Inspection Services | 5 | - | - | - | - | 5 (100.0%) | - | - | - | - | |
| TOP 10 SERVICE REQUESTS (% of District Total) | |||||||||||
| High Grass/Weeds | 3 | - | - | - | - | 3 (60.0%) | - | - | - | - | |
| City Parks Issue | 2 | - | - | - | - | - | 2 (33.3%) | - | - | - | |
| Housing or Building Violations(Exterior) | 2 | - | - | - | - | 2 (40.0%) | - | - | - | - | |
| Damaged or Missing Street Light Pole | 1 | - | - | - | - | - | 1 (16.7%) | - | - | - | |
| Dead Animal Removal Request | 1 | 1 (50.0%) | - | - | - | - | - | - | - | - | |
| Garbage Missed Pick Up | 1 | 1 (50.0%) | - | - | - | - | - | - | - | - | |
| Ice Rink Issue | 1 | - | - | - | - | - | 1 (16.7%) | - | - | - | |
| Park Garbage Pickup | 1 | - | - | - | - | - | 1 (16.7%) | - | - | - | |
| Waterfront Issues | 1 | - | - | - | - | - | 1 (16.7%) | - | - | - | |
| Prepared by: Isaac H. Michaels, DrPH Data Source: Buffalo Open Data Data as of: October 19, 2026 |
|||||||||||
Table Prepared By: Isaac H. Michaels, DrPH
Data Source: Buffalo Open Data
Complaint Volume
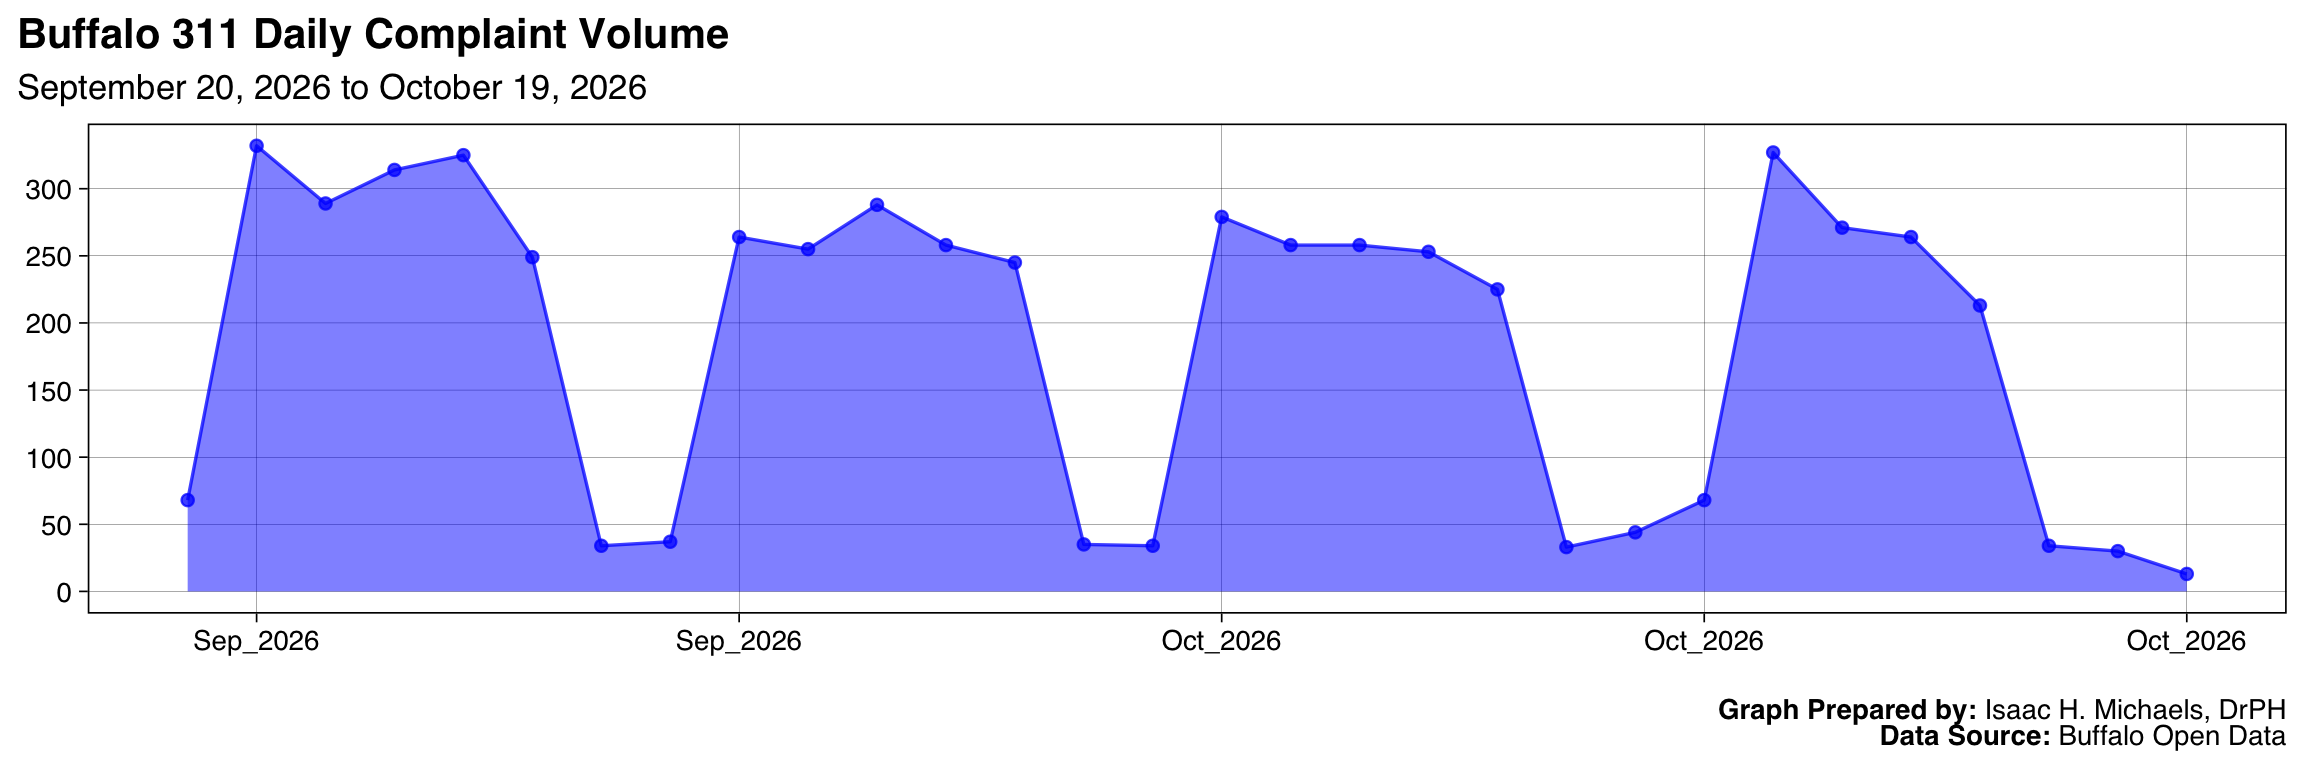
Trend
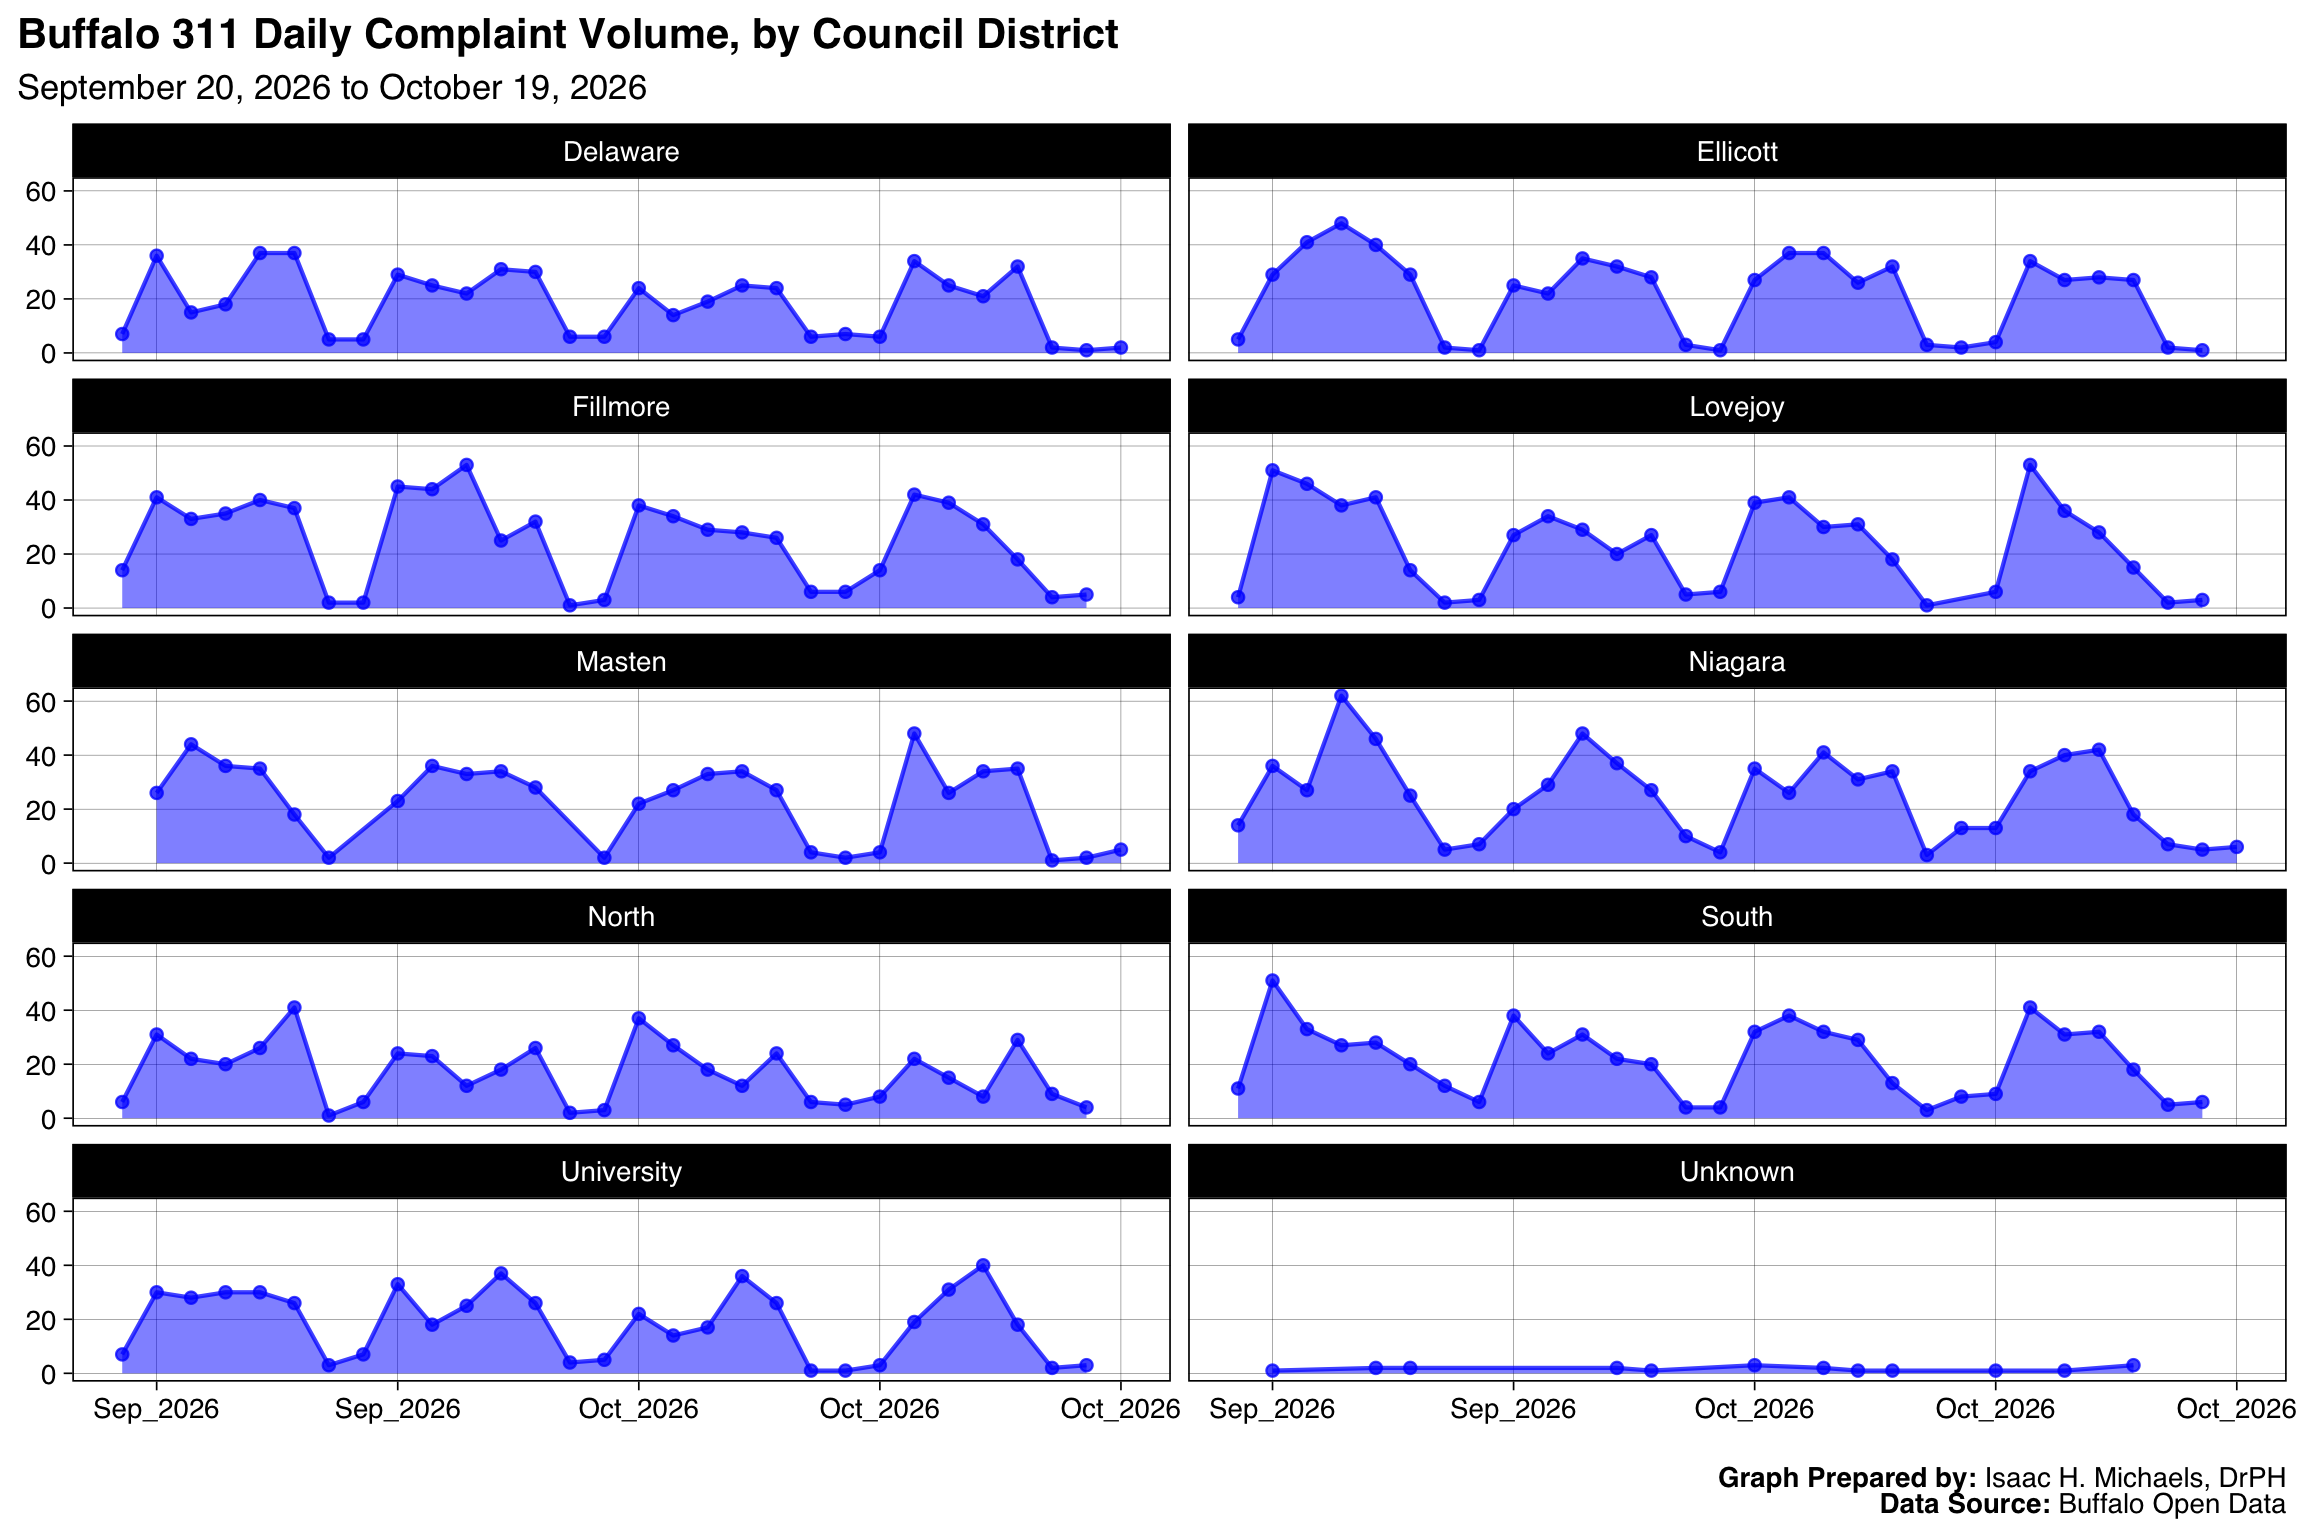
Longitudinal tracking over a 30-day rolling baseline separates acute operational anomalies from systemic seasonal trends. The visualizations below plot the daily volume to identify sudden spikes in municipal demand.
By Complaint Type
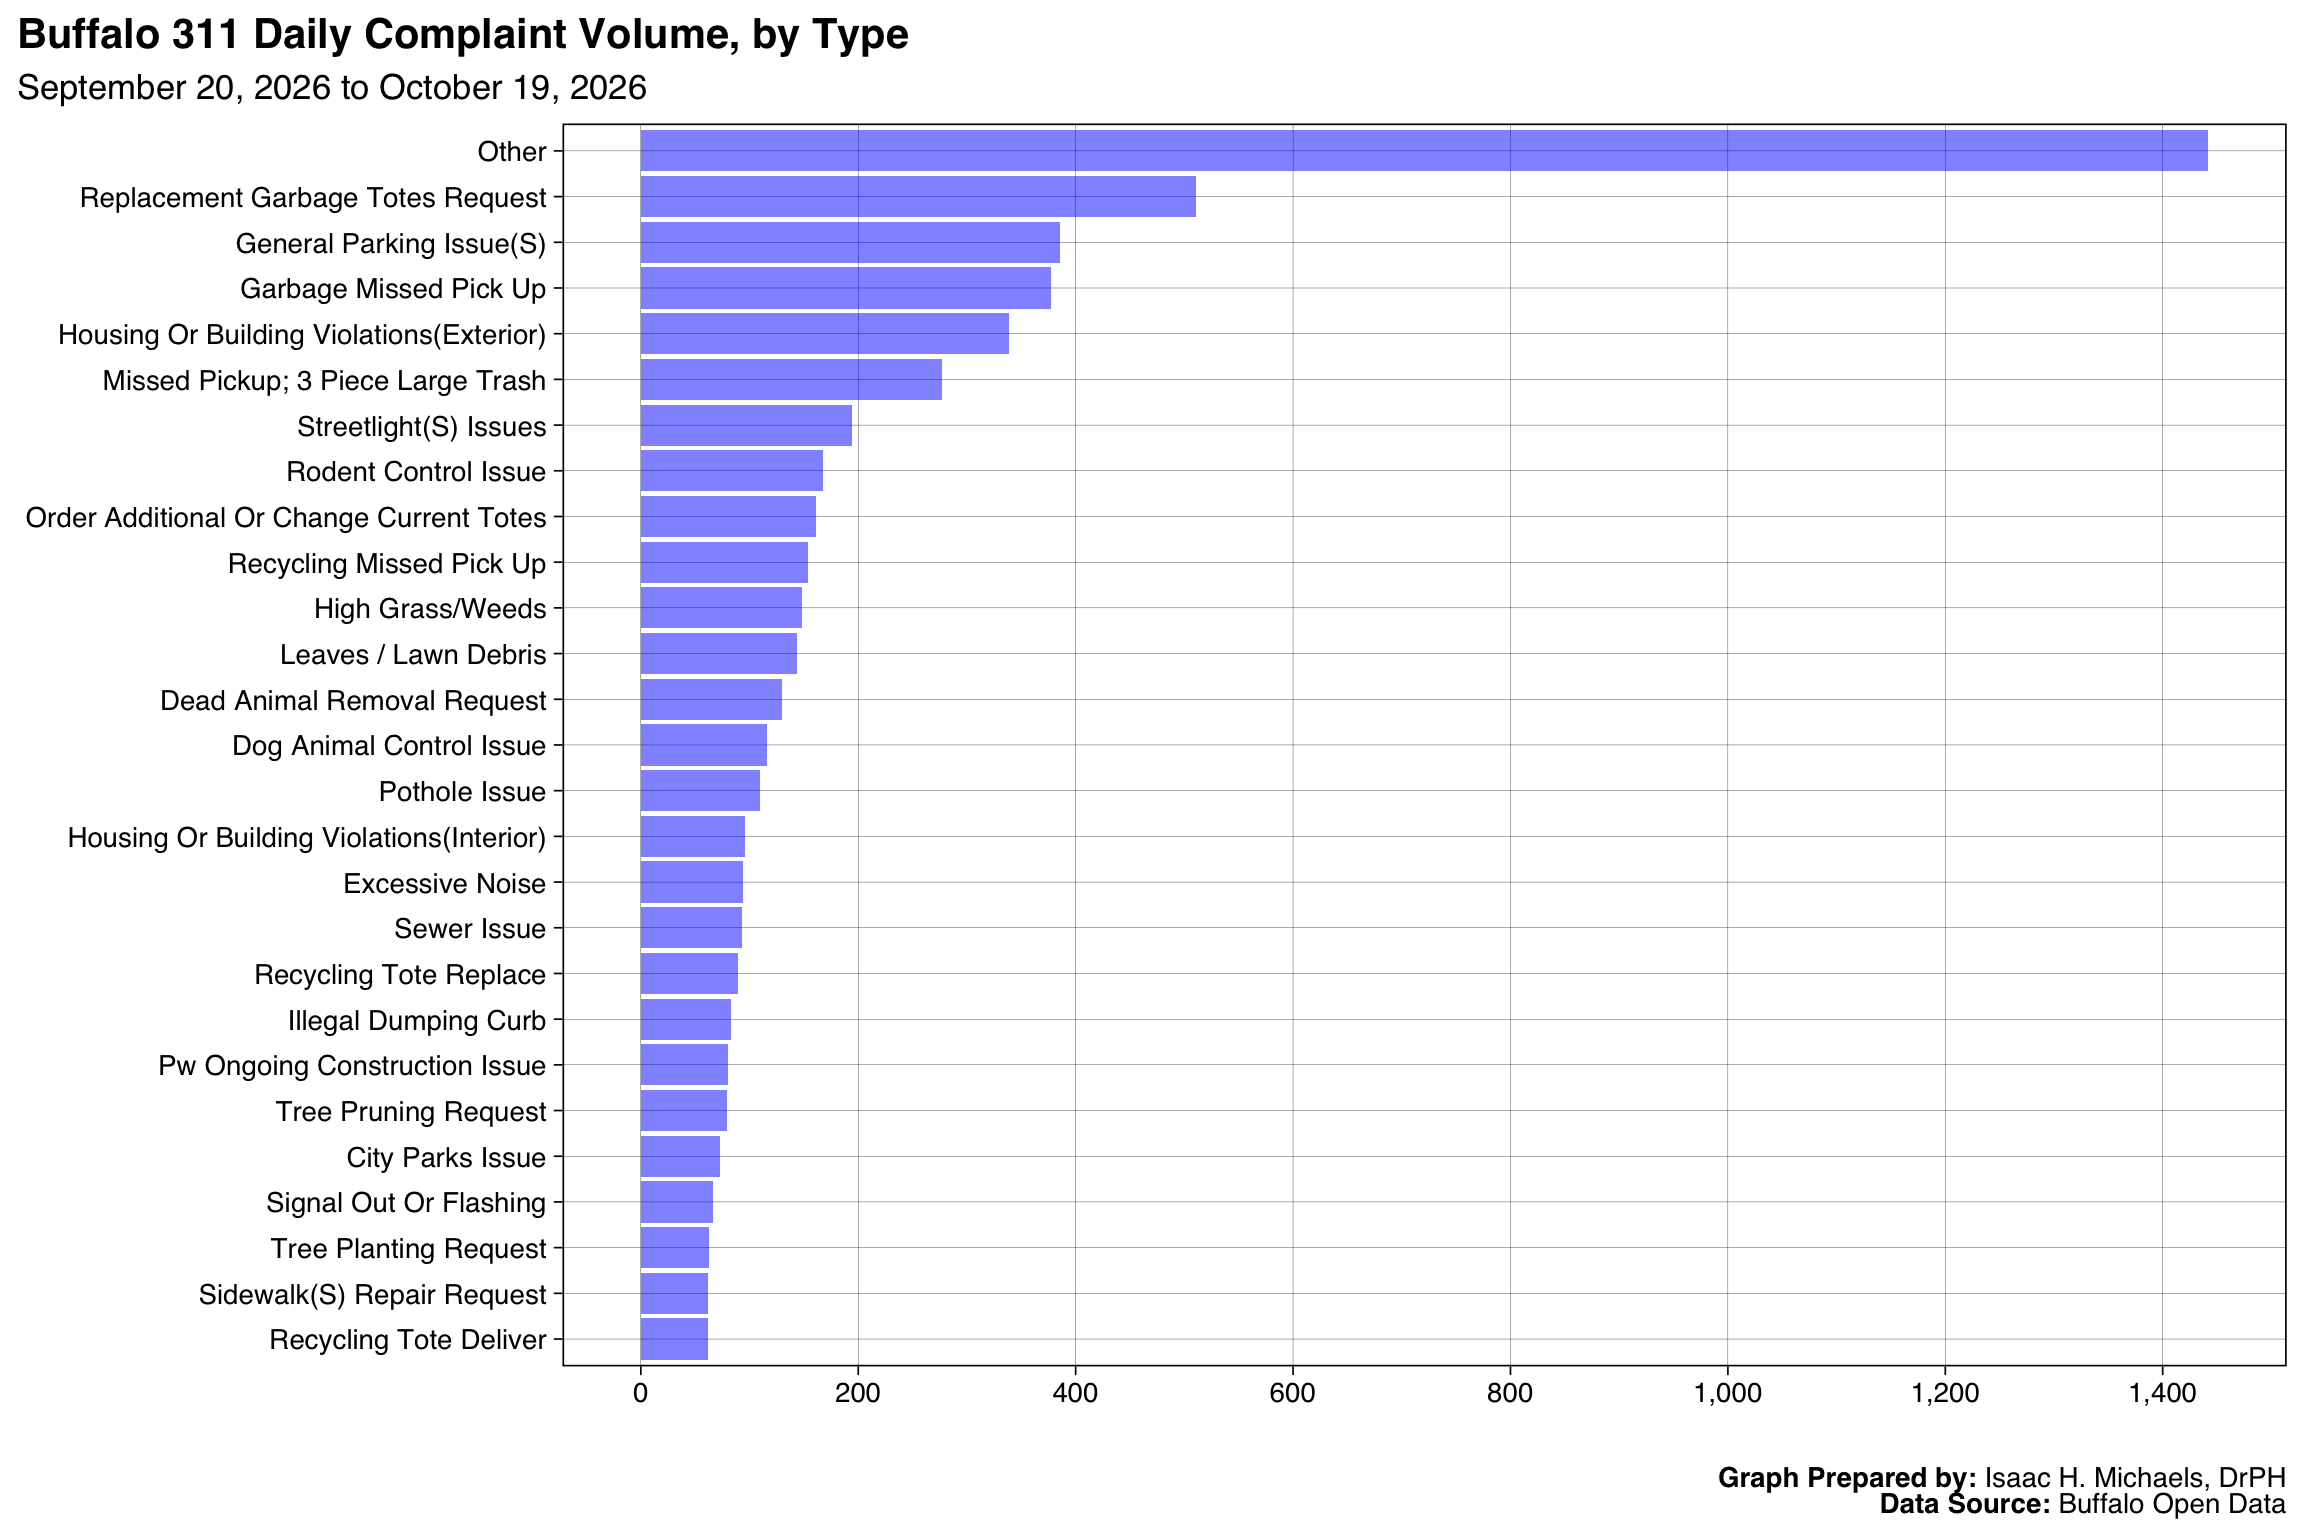
By aggregating the top 25 service requests over the preceding month, this chart establishes the baseline operational burden for city agencies, isolating the most frequent environmental and infrastructural failures.
Graph Prepared By: Isaac H. Michaels, DrPH
Data Source: Buffalo Open Data
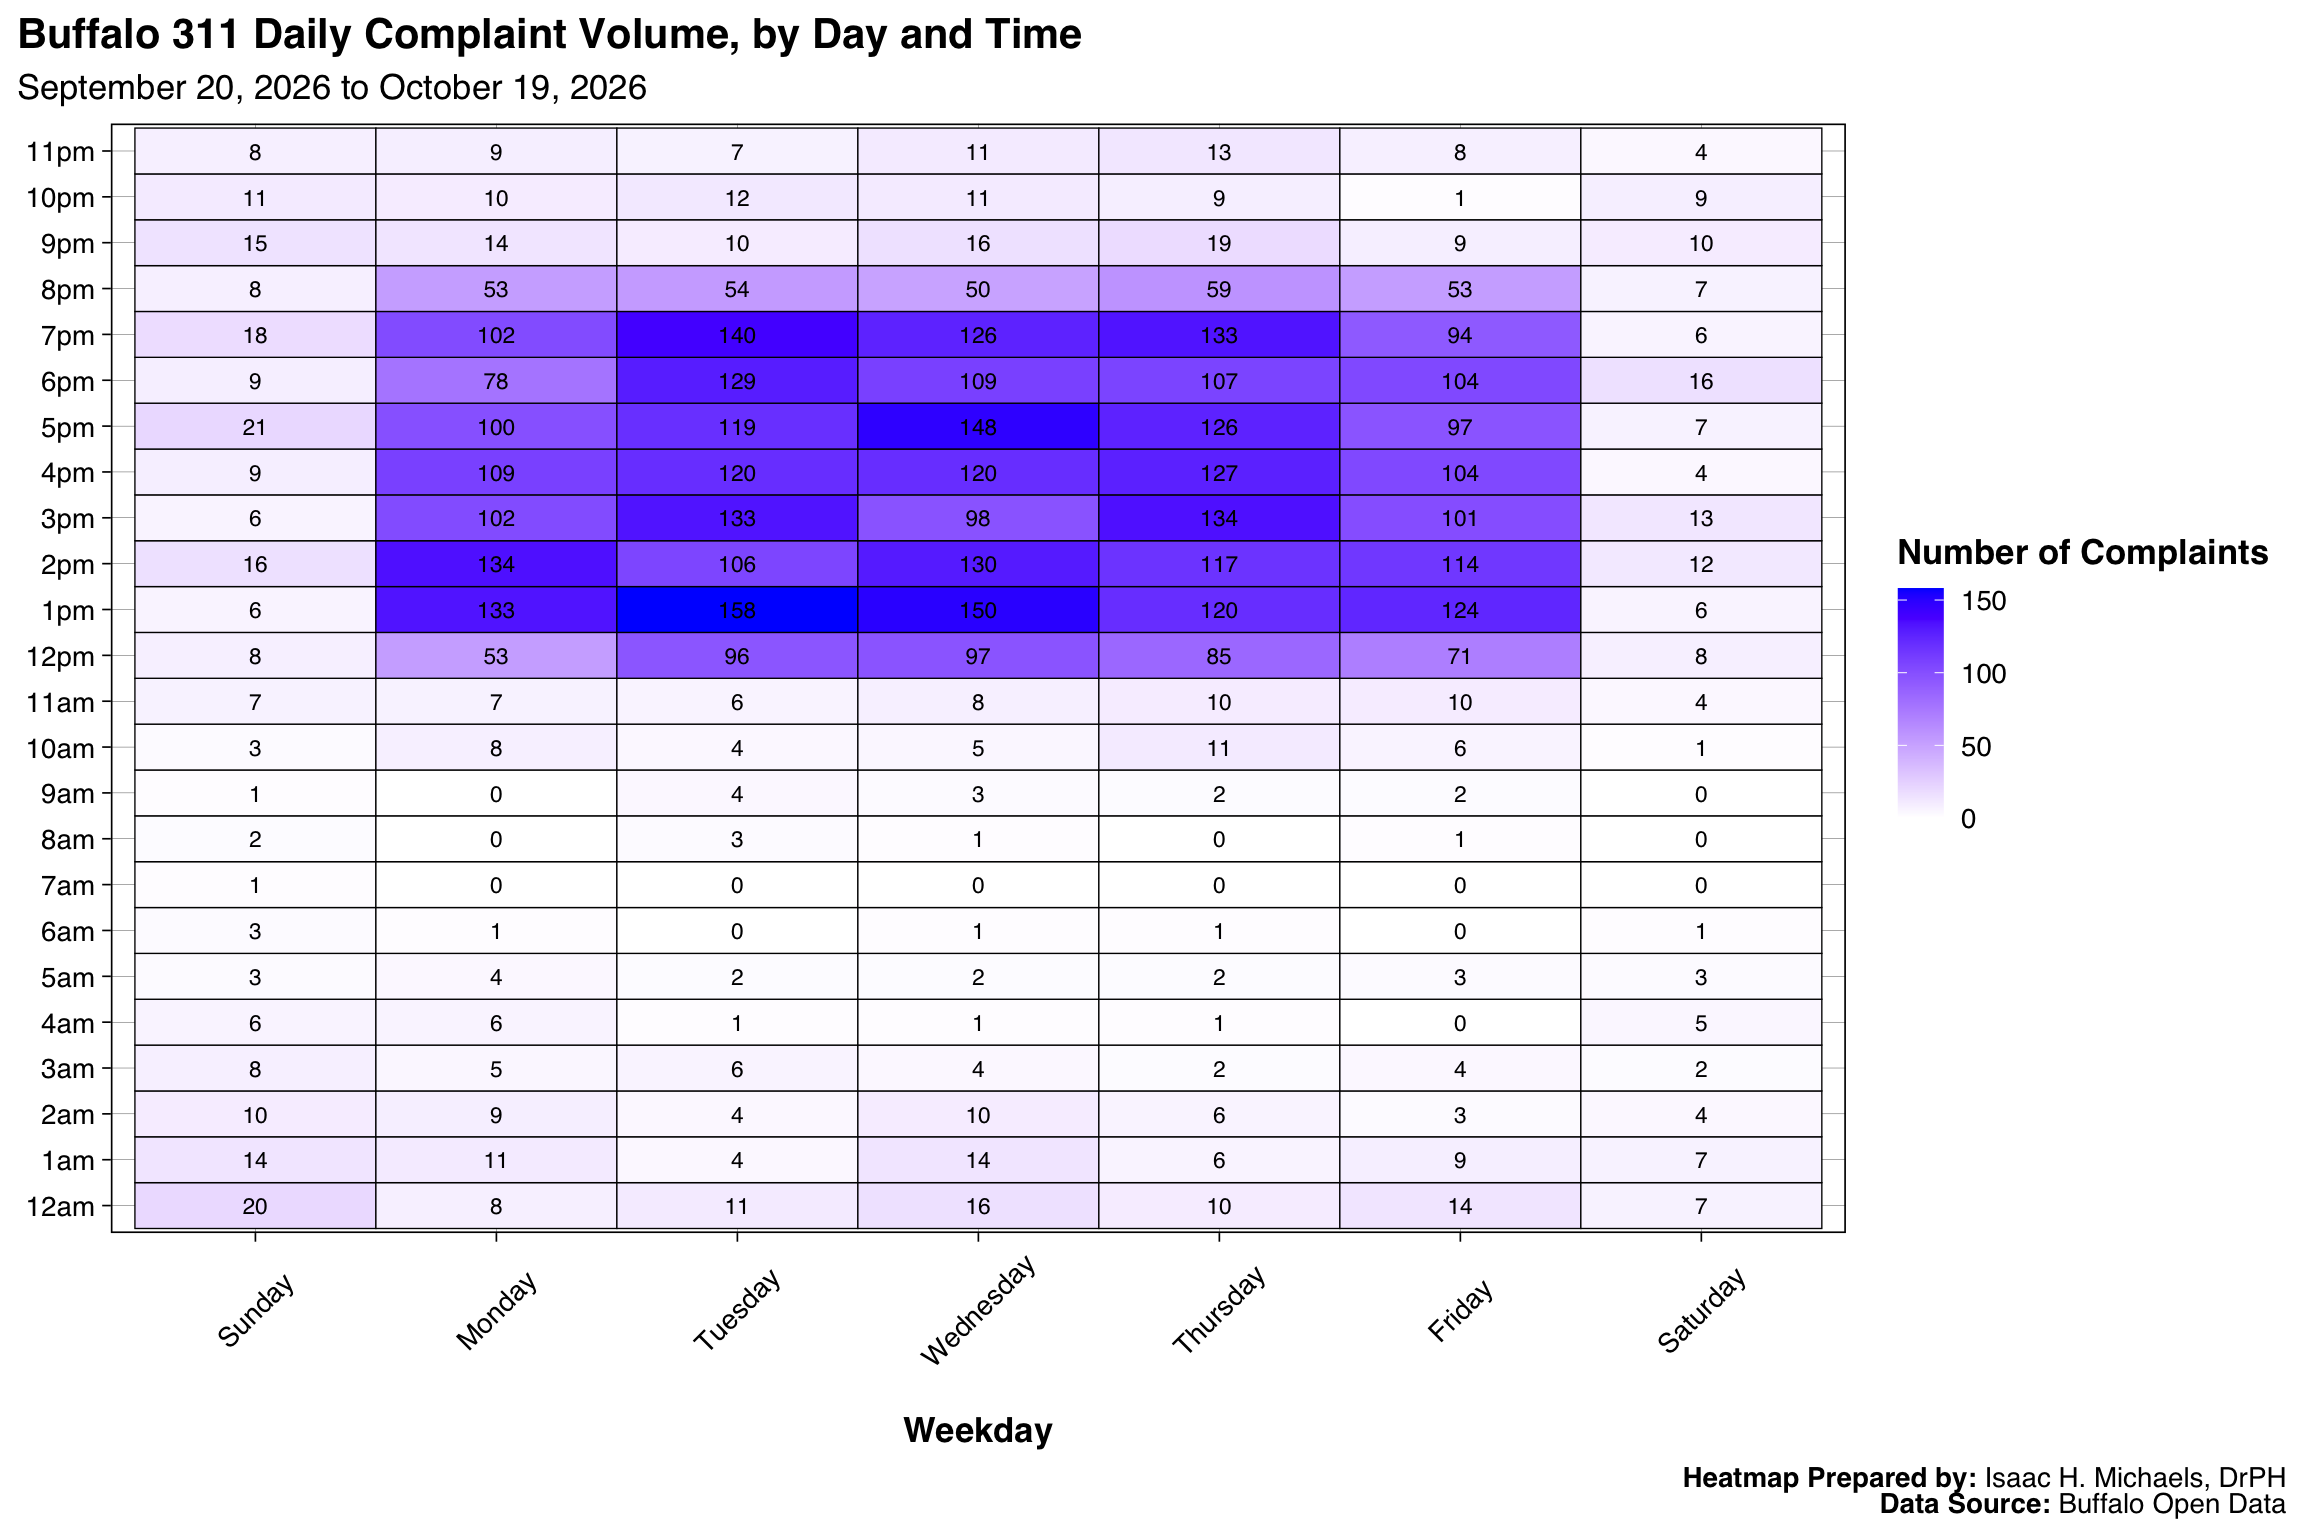
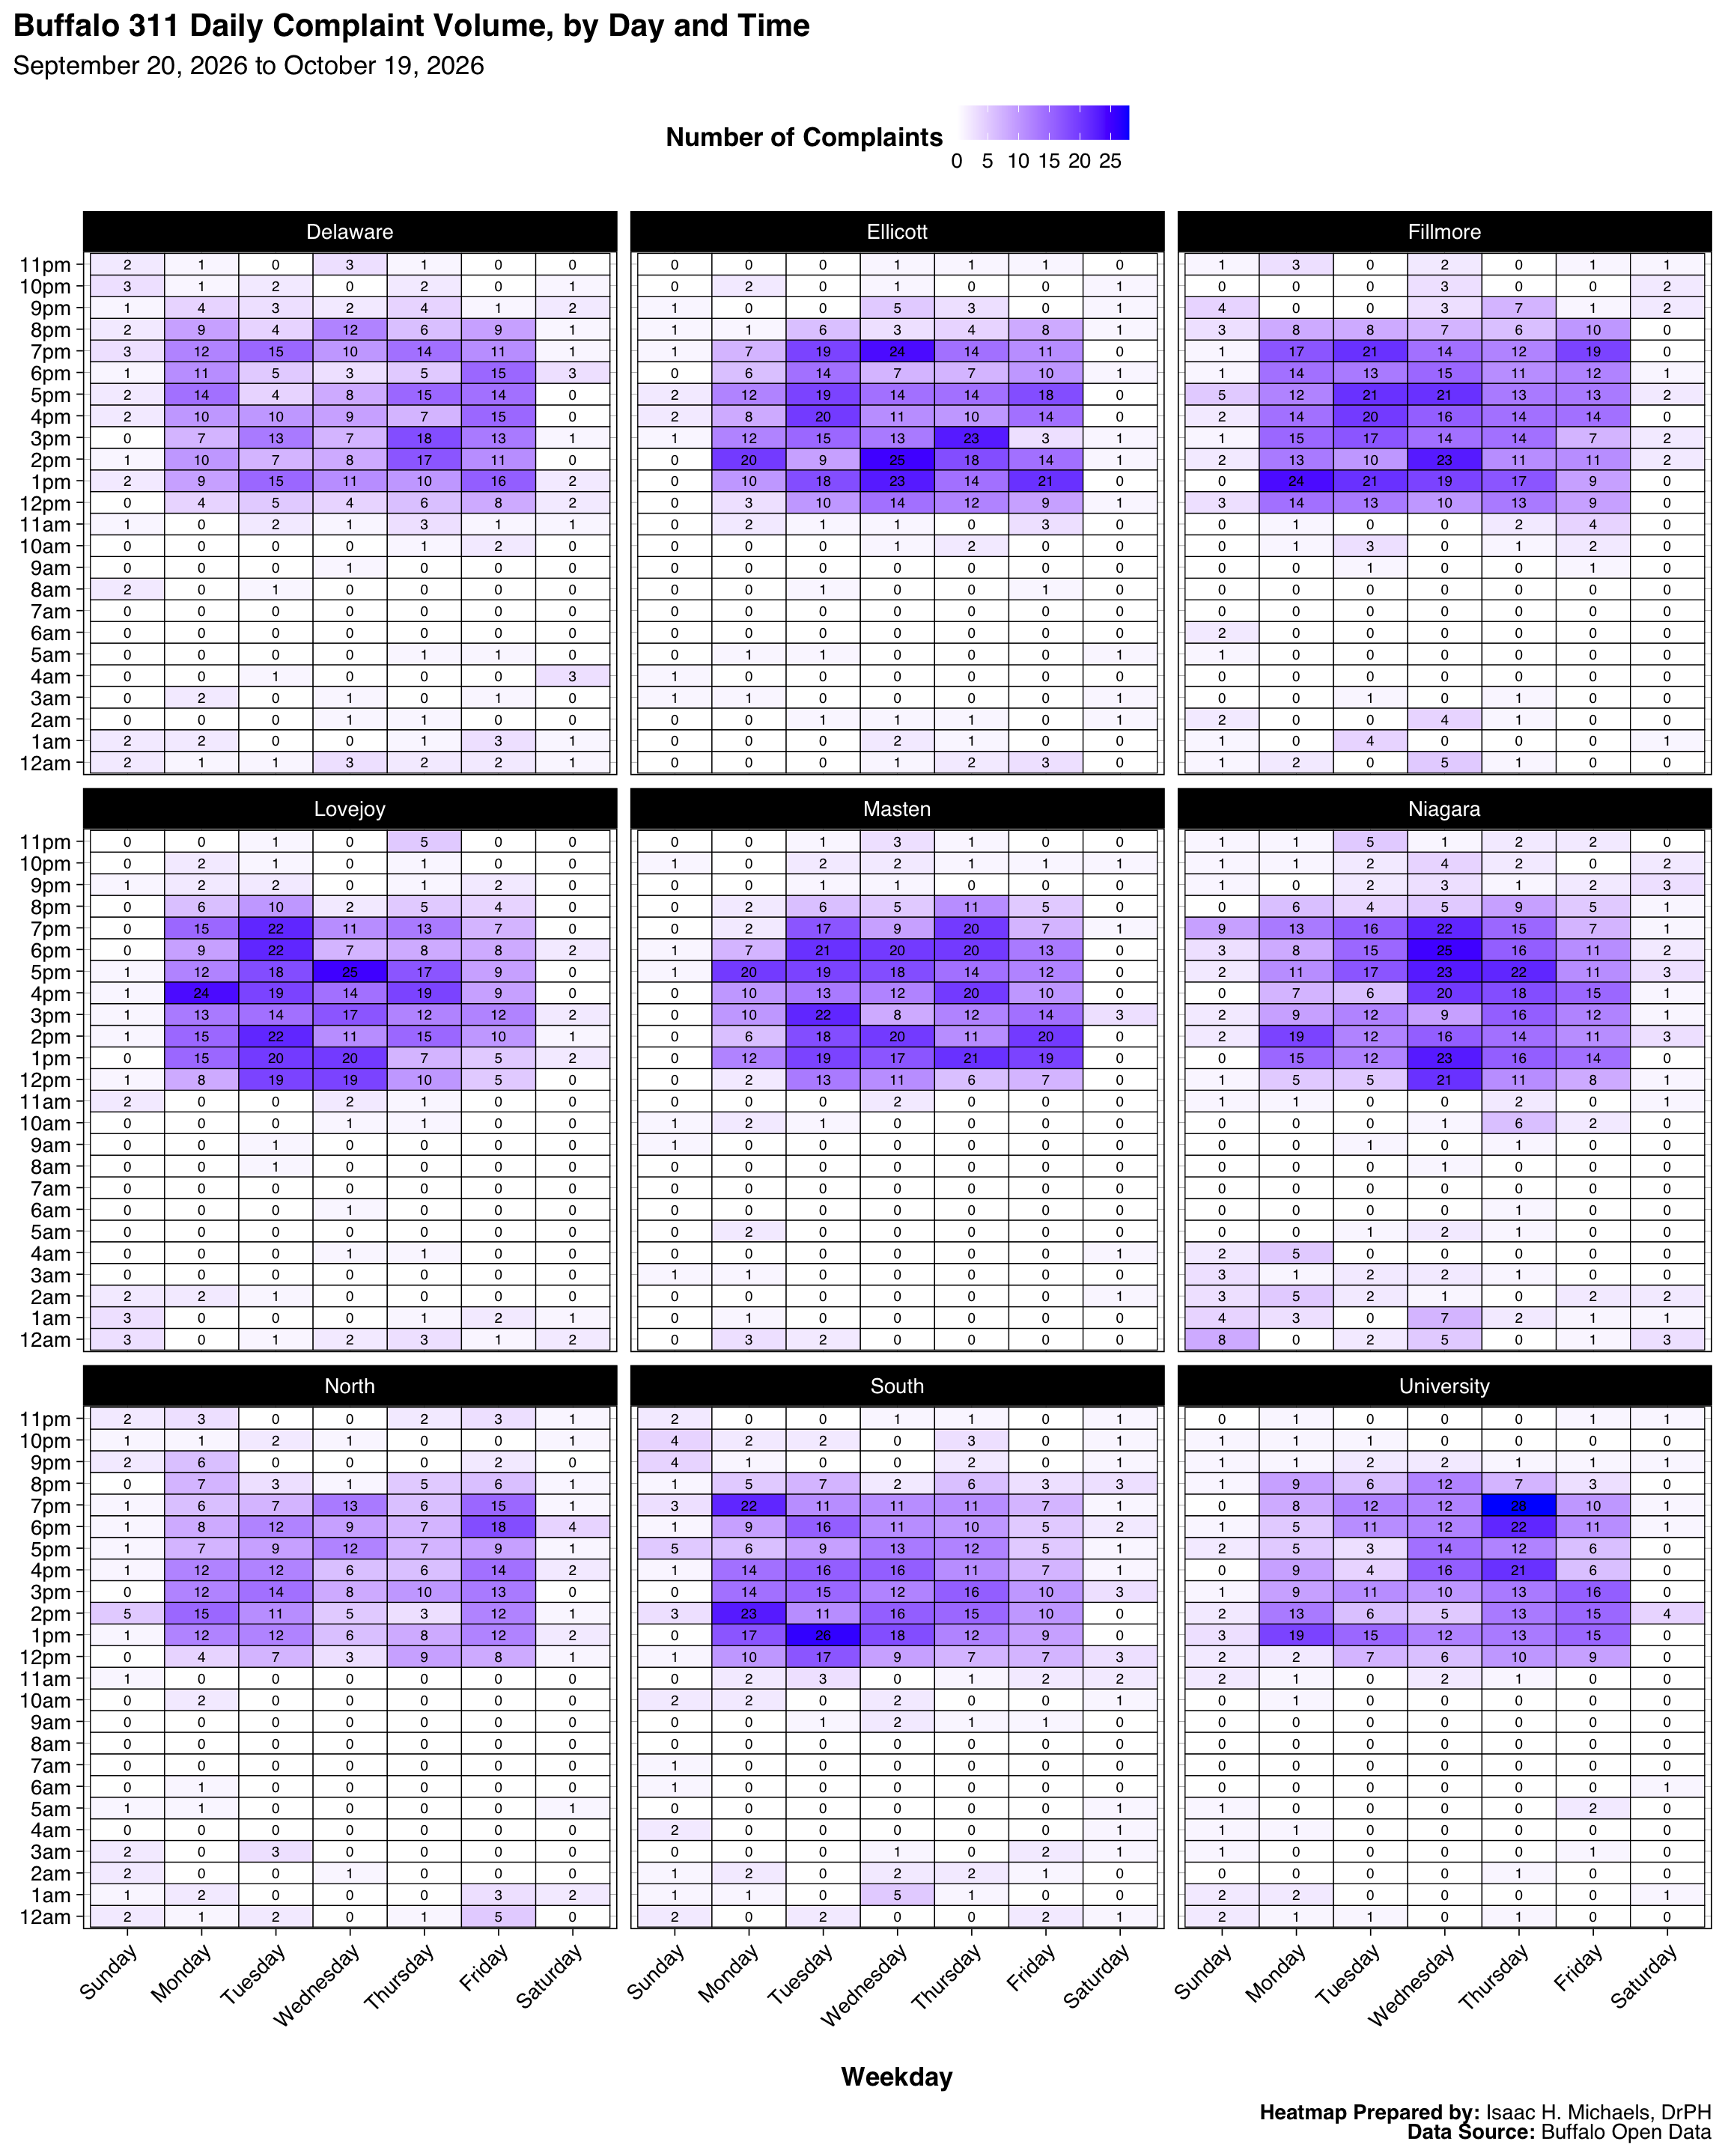
By Weekday and Hour
311 call volumes follow predictable human and operational rhythms. These heatmaps illustrate the chronobiology of municipal demand, revealing exactly when specific operational shifts experience the heaviest reporting burdens.